517 http://dx.doi.org/10.4196/kjpp.2013.17.6.517
ABBREVIATIONS: PBS, phosphate-buffered saline; MTT, 3-[4,5- dimethylthiazol-2-yl]-2,5-diphenyltetrazolium bromide; pIC50, -log IC50; 3D-QSAR, three-dimensional quantitative structure-activity relationship; CoMFA, comparative molecular field analysis; CoMSIA, comparative molecular similarity indices analysis.
Received October 14, 2013, Revised November 11, 2013, Accepted November 15, 2013
Corresponding to: Chaeuk Im, College of Pharmacy, Chung-Ang University, Heuksuk-dong, Dongjak-gu, Seoul 156-756, Korea. (Tel) 82-2-820-5603, (Fax) 82-2- 816-7338, (E-mail) [email protected]
This is an Open Access article distributed under the terms of the Creative Commons Attribution Non-Commercial License (http://
creativecommons.org/licenses/by-nc/3.0) which permits unrestricted non-commercial use, distribution, and reproduction in any medium, provided the original work is properly cited.
Cytotoxicity and Structure-activity Relationships of Naphthyridine Derivatives in Human Cervical Cancer, Leukemia, and Prostate Cancer
Yu Jin Hwang, Mi Lyang Chung, Uy Dong Sohn, and Chaeuk Im College of Pharmacy, Chung-Ang University, Seoul 156-756, Korea
Naphthyridine compounds are important, because they exhibit various biological activities including anticancer, antimicrobial, and anti-inflammatory activity. Some naphthyridines have antimitotic effects or demonstrate anticancer activity by inhibiting topoisomerase II. These compounds have been investigated as potential anticancer agents, and several compounds are now part of clinical trials. A series of naphthyridine derivatives were evaluated for their in vitro cytotoxic activities against human cervical cancer (HeLa), leukemia (HL-60), and prostate cancer (PC-3) cell lines using an MTT assay.
Some compounds (14, 15, and 16) were more potent than colchicine against all three human cancer cell lines and compound (16) demonstrated potency with IC50 values of 0.7, 0.1, and 5.1 μ M, respectively. Comparative molecular field analysis (CoMFA) and comparative molecular similarity indices analysis (CoMSIA) were used for quantitative structure-activity relationship (QSAR) molecular modeling of these compounds. W e obtained accurate and predictive three-dimensional QSAR (3D-QSAR) models as indicated by the high PLS parameters of the HeLa (q2, 0.857; r2, 0.984; r2pred, 0.966), HL-60 (q2, 0.777; r2, 0.937; r2pred, 0.913), and PC-3 (q2, 0.702; r2, 0.983; r2pred, 0.974) cell lines.
The 3D-QSAR contour maps suggested that the C-1 NH and C-4 carbonyl group of the naphthyridine ring and the C-2 naphthyl ring were important for cytotoxicity in all three human cancer cell lines.
Key Words: Cytotoxicity, Naphthyridine, SAR
INTRODUCTION
Cancer remains one of the major causes of death in spite of the long history of anticancer drug development. There have been tremendous efforts to discover and develop more potent and selective anticancer agents [1-3]. Microtubules have been used as targets for the development of anticancer agents. Compounds that attack microtubules disrupt micro- tubule structure and normal function by inhibition or pro- motion of microtubule assembly causing mitotic cell arrest [4,5]. Most of the antimitotic compounds used in clinical practice are either naturally-occurring molecules or their synthetic analogues, such as Vinca alkaloids, which inhibit microtubule polymerization, and taxol, which promotes mi- crotubule assembly [6-8]. Colchicine (Fig. 1) is another im- portant antimitotic agent.
It has been reported that several natural flavones inter-
fere with microtubule polymerization. Some flavones have shown potent cytotoxicity against several cancer cell lines including lung, ovarian, colon, kidney, melanoma, and leu- kemia [9,10]. However, since these flavones interact with various biological targets, their anticancer activities may be the result of multiple activities such as antioxidant, apoptotic, anti-topoisomerase, antimutagenic, and anti-es- trogenic activity [11-15]. To enhance the anticancer activity and selectivity of flavones, some researchers have synthe- sized a series of bio-isosteric flavones, such as quinazoli- nones, azaflavones, and naphthyridines (Fig. 1). These com- pounds have strong antimitotic effects and appear to inter- act with the colchicine binding site on microtubules [16-19].
Naphthyridine derivatives have become important com- pounds, because naphthyridines are found in many natural resources and exhibit various biological activities including anticancer, antimicrobial, and anti-inflammatory activities.
These compounds have been investigated as potential anti- cancer agents, and several compounds are part of clinical trials [2,20-24]. Moreover, it has been reported that some naphthyridine derivatives (e.g., vosaroxin, Fig. 1), were found to inhibit topoisomerase II and displayed potent anti- cancer activity. Chemical modifications of the naphthyr-
Fig. 1. Structures of anticancer agents.
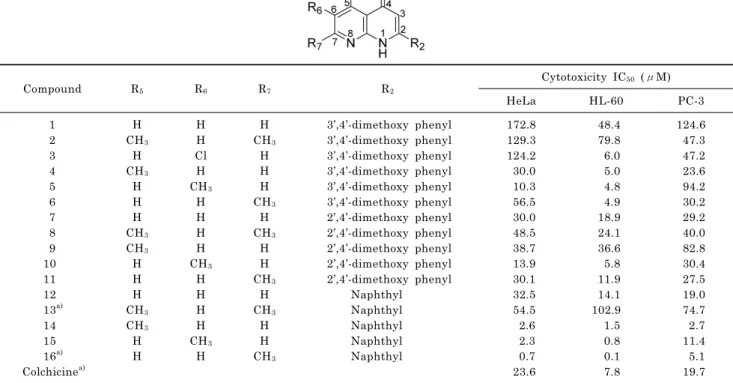
Table 1. Bioactivity of naphthyridine derivatives in human cancer cell lines
Compound R5 R6 R7 R2
Cytotoxicity IC50 (μM)
HeLa HL-60 PC-3
1 H H H 3’,4’-dimethoxy phenyl 172.8 48.4 124.6
2 CH3 H CH3 3’,4’-dimethoxy phenyl 129.3 79.8 47.3
3 H Cl H 3’,4’-dimethoxy phenyl 124.2 6.0 47.2
4 CH3 H H 3’,4’-dimethoxy phenyl 30.0 5.0 23.6
5 H CH3 H 3’,4’-dimethoxy phenyl 10.3 4.8 94.2
6 H H CH3 3’,4’-dimethoxy phenyl 56.5 4.9 30.2
7 H H H 2’,4’-dimethoxy phenyl 30.0 18.9 29.2
8 CH3 H CH3 2’,4’-dimethoxy phenyl 48.5 24.1 40.0
9 CH3 H H 2’,4’-dimethoxy phenyl 38.7 36.6 82.8
10 H CH3 H 2’,4’-dimethoxy phenyl 13.9 5.8 30.4
11 H H CH3 2’,4’-dimethoxy phenyl 30.1 11.9 27.5
12 H H H Naphthyl 32.5 14.1 19.0
13a) CH3 H CH3 Naphthyl 54.5 102.9 74.7
14 CH3 H H Naphthyl 2.6 1.5 2.7
15 H CH3 H Naphthyl 2.3 0.8 11.4
16a) H H CH3 Naphthyl 0.7 0.1 5.1
Colchicinea) 23.6 7.8 19.7
a)Test set compounds. The cancer cells were seeded at a density of approximately 5×10³ cells/well in 96-well plates. Each well contained 180 μl of medium and 20 μl of 10× concentration of prepared compounds or PBS were added. After culturing for 4 days, 0.1 mg of MTT was added to each well and incubated at 37oC for 4 h. The plates were centrifuged at 450× g to precipitate the formazan crystals. The medium was decanted and 150 μl of DMSO was added to each well to dissolve the formazan. In this assay, MTT was converted to blue formazan dye by mitochondrial dehydrogenase in actively respiring cells. The intensity of the blue color formed was measured with an enzyme linked immunosorbent assay (ELISA) reader at 540 nm. The measured mean values were expressed as the IC50, the concentration of the compound that reduced the absorbance at 540 nm by 50%.
idine ring, including conversion into other similar ring sys- tems, have been known to increase the cytotoxic activity of these compounds [22,23,25-27].
To find potent anticancer agents, we have synthesized a series of naphthyridine derivatives obtained by changing substituents at the C-2 position of the naphthyridine core in addition to the C-5, C-6, and C-7 positions. In this paper, we evaluated their cytotoxic activities against three human cancer cell lines and performed three dimensional quantita- tive structure-activity relationships (3D-QSARs).
METHODS Materials
Phosphate-buffered saline (PBS) was purchased from
Boehringer Mannheim. Dimethyl sulfoxide (DMSO), 3-[4,5- dimethylthiazol-2-yl]-2,5-diphenyltetrazolium bromide (MTT), colchicine, and other reagents were obtained from Sigma.
All naphthyridine derivatives were synthesized in our laboratory.
In vitro cytotoxic assay
The cytotoxicities of naphthyridine derivatives were eval- uated in the cell lines of the following human cancers: hu- man cervical cancer (HeLa), leukemia (HL-60), and pros- tate cancer (PC-3). Cytotoxicities were measured with the MTT-based colorimetric assay as described in the Table 1 legend [28-31].
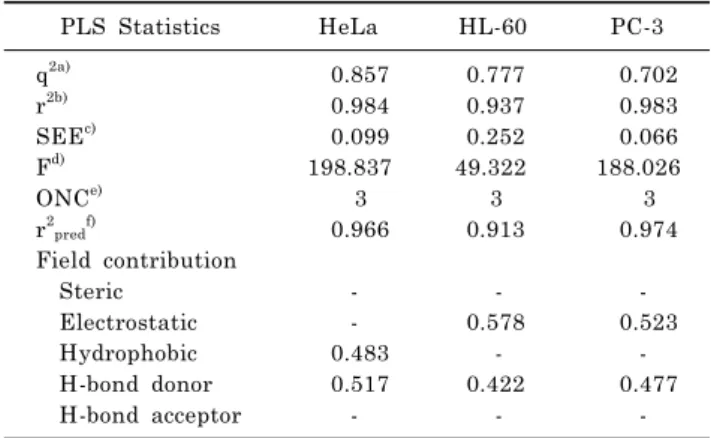
Table 3. Statistical parameters of CoMSIA models
PLS Statistics HeLa HL-60 PC-3
q2a) 0.857 0.777 0.702
r2b) 0.984 0.937 0.983
SEEc) 0.099 0.252 0.066
Fd) 198.837 49.322 188.026
ONCe) 3 3 3
r2predf) 0.966 0.913 0.974
Field contribution
Steric - - -
Electrostatic - 0.578 0.523
Hydrophobic 0.483 - -
H-bond donor 0.517 0.422 0.477
H-bond acceptor - - -
a)q2, cross-validated correlation coefficient; b)r2, non-cross-vali- dated correlation coefficient; c)SEE, standard error of estimate;
d)F, F-test value; e)ONC, optimum number of components; f)r2pred, predicted correlation coefficient.
Table 2. Statistical parameters of CoMFA models
PLS Statistics HeLa HL-60 PC-3
q2a) 0.629 0.720 0.567
r2b) 0.972 0.838 0.984
SEEc) 0.129 0.384 0.064
Fd) 115.440 28.394 199.171
ONCe) 3 3 3
Field contribution
Steric 0.377 0.478 0.366
Electrostatic 0.623 0.522 0.634
Hydrophobic - - -
H-bond donor - - -
H-bond acceptor - - -
a)q2, cross-validated correlation coefficient; b)r2, non-cross-vali- dated correlation coefficient; c)SEE, standard error of estimate;
d)F, F-test value; e)ONC, optimum number of components.
Molecular modeling
A data set of 17 compounds exhibiting cytotoxic activity with IC50 values ranging from 0.1 μM to 172.8 μM was used to perform the 3D-QSAR analysis. The data set was divided into two groups. The first group comprised of four- teen compounds that were used for the training set. The second group comprised of three randomly-selected com- pounds, which were the test set and were used for external validation of the 3D-QSAR models. All biological activity data expressed as IC50 values were transformed into pIC50
(-log IC50) values and used as the dependent variable in the CoMFA and CoMSIA studies. The molecular structures and cytotoxic activities of the training and the test sets are described in Table 1.
All computational studies were performed with the SYBYL-X 2.0 molecular modeling software package. Com- pound structures were generated with the sketch tool, and geometry optimization was carried out using the TRIPOS force field and the Powell conjugate gradient algorithm with a gradient convergence value of 0.05 kcal/mol. Partial atomic charges of the molecules were calculated by the Gasteiger-Hückel charges. Low-energy conformations were searched for using the simulated annealing method, and molecular alignment was achieved by the distill rigid meth- od in SYBYL. The active compound (15) in the training set was selected as a template molecule, and the phenyl moiety of the C-2 naphthyl ring was used as a common sub- structure in the alignment.
CoMFA and CoMSIA
CoMFA and CoMSIA analyses are based on the relation- ship between biological activity and structural properties of compounds when the receptor structure is unknown.
CoMFA was executed in the steric and electrostatic fields.
Aligned molecules were put into the 3D cubic lattice with a grid spacing of 2.0 Å. The Lennard-Jones and Coulombic potentials were applied to calculate the steric and electro- static field energies of the CoMFA, respectively. The sp3 probe carbon atom with a charge of +1 and a Van der Waal’s radius of 1.52 Å was used to calculate the CoMFA steric and electrostatic fields. A default value of 30 kcal/mol
was used as the maximum steric and electrostatic energy cut-off.
The CoMSIA method uses a common probe atom and sim- ilarity indices calculated at regularly spaced grid intervals for the aligned molecules. The CoMSIA calculates five fields: steric, electrostatic, hydrophobic, hydrogen bond ac- ceptor, and hydrogen bond donor. The common probe atom with radius 1.0 Å, charge +1, hydrophobicity +1, hydrogen bond donating +1, and hydrogen bond accepting +1 was used to calculate the five fields. A default value of 0.3 was used for the attenuation factor.
Partial least square (PLS) analysis
A partial least squares (PLS) approach was employed to derive the 3D-QSAR models. Cross-validation was per- formed with the leave-one-out (LOO) method in which one compound was removed from the data set, and its biological activity was predicted with the model derived from the rest of the data set. The LOO cross-validation was carried out to determine the optimal number of components (ONC) and the correlation coefficient q2, which indicated the predictive ability of the analysis. The final QSAR model was devel- oped with the obtained optimal number of components to determine the non-cross-validation correlation coefficient r2, which indicated the quality of the data fit in the equation.
To assess the predictive ability of the derived 3D-QSAR models, test set compounds with known biological activities were used to validate the 3D-QSAR models. The predictive correlation coefficient r2pred value was calculated using the following equation:
r2pred=(SD−PRESS)/SD
where SD is the sum of the squared deviations between the biological activities of the test set and the mean activ- ities of the training set; PRESS is the sum of the squared deviations between the experimental and the predicted ac- tivities of the test set compounds.
Table 5. Experimental and predicted cytotoxicities (pIC50) of the test set
Compounds HeLa HL-60 PC-3
Exp.a) Pred.b) Resid.c) Exp.a) Pred.b) Resid.c) Exp.a) Pred.b) Resid.c)
13 4.26 4.36 0.10 3.99 4.42 0.43 4.13 4.08 −0.05
16 6.15 5.96 −0.19 7.10 6.96 −0.14 5.29 5.33 0.04
Colchicine 4.63 4.69 0.06 5.11 5.41 0.30 4.71 4.71 0.00
a)Exp., experimental cytotoxic activity; b)Pred., predicted activity by the CoMSIA model; c)Resid., difference between the actual and predicted activity; The pIC50 (-log IC50) values were converted from IC50 values.
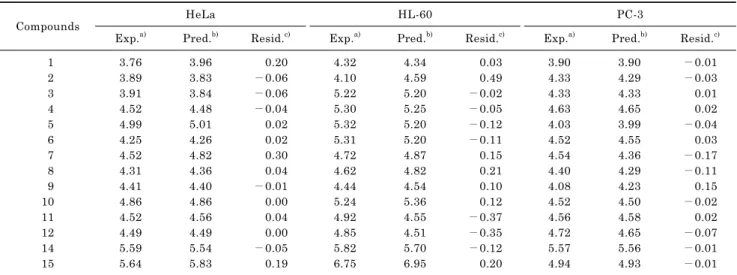
Table 4. Experimental and predicted cytotoxicities (pIC50) of the training set
Compounds HeLa HL-60 PC-3
Exp.a) Pred.b) Resid.c) Exp.a) Pred.b) Resid.c) Exp.a) Pred.b) Resid.c)
1 3.76 3.96 0.20 4.32 4.34 0.03 3.90 3.90 −0.01
2 3.89 3.83 −0.06 4.10 4.59 0.49 4.33 4.29 −0.03
3 3.91 3.84 −0.06 5.22 5.20 −0.02 4.33 4.33 0.01
4 4.52 4.48 −0.04 5.30 5.25 −0.05 4.63 4.65 0.02
5 4.99 5.01 0.02 5.32 5.20 −0.12 4.03 3.99 −0.04
6 4.25 4.26 0.02 5.31 5.20 −0.11 4.52 4.55 0.03
7 4.52 4.82 0.30 4.72 4.87 0.15 4.54 4.36 −0.17
8 4.31 4.36 0.04 4.62 4.82 0.21 4.40 4.29 −0.11
9 4.41 4.40 −0.01 4.44 4.54 0.10 4.08 4.23 0.15
10 4.86 4.86 0.00 5.24 5.36 0.12 4.52 4.50 −0.02
11 4.52 4.56 0.04 4.92 4.55 −0.37 4.56 4.58 0.02
12 4.49 4.49 0.00 4.85 4.51 −0.35 4.72 4.65 −0.07
14 5.59 5.54 −0.05 5.82 5.70 −0.12 5.57 5.56 −0.01
15 5.64 5.83 0.19 6.75 6.95 0.20 4.94 4.93 −0.01
a)Exp., experimental cytotoxic activity; b)Pred., predicted activity by the CoMSIA model; c)Resid., difference between the actual and predicted activity; The pIC50 (-log IC50) values were converted from IC50 values.
RESULTS In vitro cytotoxicity
Colchicine and the 16 synthesized compounds were eval- uated in three human cancer cell lines: HeLa, HL-60, and PC-3. The cytotoxic activities of the compounds were ob- tained as IC50 values, and the data are summarized in Table 1. Colchicine showed moderate cytotoxicity with IC50
values of 23.6, 7.8, and 19.7 μM, respectively. The IC50 val- ues of the synthesized compounds ranged from 0.7 μM to 172.8 μM for HeLa cells, from 0.1 μM to 102.9 μM for HL-60 cells, and from 2.7 μM to 124.6 μM for PC-3 cells.
In HeLa cells, the compounds (5, 10, and 15) with a meth- yl group at the C-6 position were more potent than colchicine. Cytotoxicities of the compounds (14, 15, and 16) with the C-2 naphthyl ring were increased to give IC50 val- ues of 2.6, 2.3, and 0.71 μM, respectively. Compounds (7, 8, and 11) with a 2’,4’-dimethoxy phenyl ring showed stron- ger biological activity than compounds (1, 2, and 6) with a 3’,4’-dimethoxy phenyl ring. For HL-60 cells, the 3’,4’-di- methyoxy phenyl ring compounds (4, 5, and 6) exhibited more potent cytotoxicities than the 2’,4’-dimethoxy phenyl ring compounds (9, 10, and 11). The introduction of a naph- thyl ring at the C-2 position (14, 15, and 16) enhanced activ- ities to show IC50 values of 1.5, 0.8, and 0.1 μM, res- pectively. In PC-3 cells, most of the C-2 naphthyl ring com-
pounds (12, 14, 15, and 16) had more potent biological activ- ities than the 3’,4’- or 2’,4’-dimethyoxy phenyl ring com- pounds.
3D-QSAR analysis
The summaries of CoMFA and CoMSIA statistics for the training and test sets are listed in Tables 2 and 3. The pre- dicted biological activities and residuals between the ex- perimental and predicted activities from CoMSIA are shown in Tables 4 and 5, respectively.
Human cervical cancer (HeLa) cells
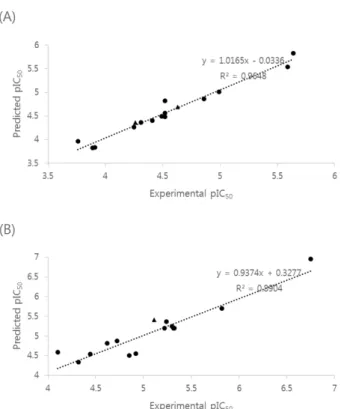
The CoMFA model for steric and electrostatic fields gave a cross-validated coefficient (q2) value of 0.629 and a non- cross-validated coefficient (r2) value of 0.972 with an opti- mal number of components (ONC) of 3 (Table 2). PLS analy- sis of the CoMSIA model with hydrophobic and hydrogen bond donor fields provided a q2 of 0.857 with an ONC of 3. From the CoMSIA model, a high r2 value of 0.984 with a low standard error estimate (SEE) of 0.099 and an F val- ue (F) of 198.837 were obtained. The predictive correlation coefficient value (r2pred) was 0.966. The graph of experi- mental versus predicted pIC50 values for the training and test sets is shown in Fig. 2A. The contributions of hydro- phobic and hydrogen bond donor fields were 48.3 and 51.7
Fig. 2. Correlation plots between the experimental and predicted activities for training and test set compounds. (A) Human cervical cancer cell line (HeLa), (B) leukemia cell line (HL-60), and (C) prostate cancer cell line (PC-3). The IC50 values were transformed into pIC50 (-log IC50) values (●: training set molecules, ▲: test set molecules).
%, respectively (Table 3).
Leukemia (HL-60) cells
By using the CoMFA default settings for steric and elec- trostatic fields, a cross-validated coefficient value of 0.720, an optimized component number of 3, and a non-cross-vali- dated coefficient value of 0.838 were observed. The CoMSIA model with electrostatic and hydrogen bond donor fields yielded a cross-validated coefficient value of 0.777 with 3 principal components and a non-cross-validated coefficient value of 0.937. The F test value and SEE value were 49.322 and 0.252, respectively. The predictive correlation coeffi- cient r2pred was 0.913. Fig. 2B illustrates the correlation be- tween the experimental versus predicted pIC50 values for the training and test set compounds. The corresponding contributions of electrostatic and hydrogen bond donor fields were 57.8 and 42.2%, respectively.
Prostate cancer (PC-3) cells
The CoMFA model with steric and electrostatic fields de- termined the cross-validated coefficient, non-cross-valida- ted coefficient, and optimum number component to be 0.567, 0.984, and 3, respectively. The CoMSIA model using electrostatic and hydrogen bond donor fields gave a cross-validated correlation coefficient of 0.702 for 3 compo- nents and a non-cross-validation coefficient of 0.983. The F value, standard estimate error, and r2pred value were 188.026, 0.066, and 0.974, respectively. The plot of ex- perimental versus predicted activity values is shown in Fig.
2C. The electrostatic and hydrogen bond donor field de- scriptors contributed 52.3 and 47.7%, respectively.
DISCUSSION
In the in vitro bioassay, compounds (14, 15, and 16) were much more active than colchicine and other synthesized compounds, with IC50 values of 2.6, 2.3, and 0.7 μM against HeLa cells, 1.5, 0.8, and 0.1 μM against HL-60 cells, and 2.7, 11.4, and 5.1 μM against PC-3 cells, respectively.
Compounds with a C-2 naphthyl ring (14, 15, and 16) showed more potent cytotoxicities than the 2’,4’- or 3’,4’-di- methyoxy phenyl ring compounds, suggesting that bulky lipophilic groups at the C-2 position were beneficial for po- tent activity. Compound (16) with both a C-7 CH3 and a C-2 naphthyl ring displayed the most potent activity against all three human cancer cell lines. In general, meth- yl-substituted compounds at the C-6 or C-7 positions were more active than those substituted at the C-5 position, while compounds with two methyl groups at both the C-5 and C-7 positions or no substituted group at the C-5, C-6, and C-7 positions in naphthyridine were substantially less active.
In all three QSARs, the results of the CoMSIA models were better than those from the CoMFA. The statistical pa- rameters from the CoMSIA models demonstrated high cross-validated q2 values (0.857, 0.777, and 0.702) and non-cross-validated coefficient r2 values (0.984, 0.937, and 0.983) suggesting that these models were highly predictive.
In general, a q2 value >0.5 is considered an indication that the model is internally predictive. The small residual val- ues between experimental and predicted activities in Table 4 showed that the predicted activities from the CoMSIA models correlated well with experimental activities. The test set is used to validate the predictive ability of the QSAR model, and predictive ability is expressed by the pre- dictive correlation coefficient values (r2pred), which were 0.966, 0.913, and 0.974, respectively. These high predictive
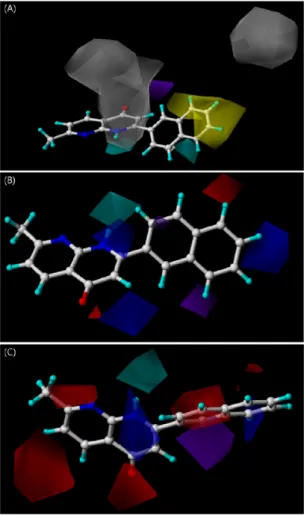
Fig. 3. Three-contour maps for the CoMSIA models. (A) Cervical cancer cell line (HeLa), (B) leukemia cell line (HL-60), and (C) prostate cancer cell line (PC-3). Compound (16) is shown within the fields (blue, favorable positive charge; red, favorable negative charge; yellow, favorable hydrophobicity; white, unfavorable hy- drophobicity; cyan, favorable hydrogen bond donor; purple, un- favorable hydrogen bond donor).
correlation coefficient values and small residual values in Table 5 indicated that these CoMSIA models predicted the biological activity of test set molecules well. The graphs of experimental versus predicted pIC50 values for the training and test sets (Fig. 2) illustrated a good correlation between experimental activities and predicted activities and the pre- dictivity of the QSAR models.
3D-contour maps visually illustrate the QSAR informa- tion to show regions around molecules where increased or decreased activity is expected by physicochemical property changes in the molecules. In the electrostatic contour map, the blue and red contour regions are favorable for positive charges and negative charges, respectively. The yellow con- tours indicate where hydrophobic groups enhance biological activity, whereas the white contours show regions where hydrophilic groups increase activity. The cyan areas are fa- vorable hydrogen bond donor fields, while the purple area represents unfavorable hydrogen bond donor fields. Com- pound (16) with the most potent activity against three hu- man cancer cell lines is shown in the fields (Fig. 3).
For HeLa cells (Fig. 2A), there was yellow contour around
the 3’, 4’, 5’, and 6’ hydrogens of the C-2 naphthyl ring, where the hydrophobic groups like a methyl group were fa- vorable for activity. The large white contour near the C-4 carbonyl and the C-1 NH group of the naphthyridine ring suggested that introduction of hydrophilic groups would in- crease activity. The cyan contours were shown at the C-1 NH of naphthyridine and the 6’ positions of the naphthyl ring, suggesting that hydrogen bond donor groups would enhance activity. The purple contour at the 2’ position of the naphthyl ring demonstrated the unfavorable region for hydrogen bond donators. Compounds (14, 15, and 16) were well correlated with the hydrophobic contours and hydro- gen bond donor contours to give a reasonable explanation for their potent activity.
The contour map of HL-60 cells is shown in Fig. 2B. The blue contours, which are favorable positive charge, were found near the C-1 NH of the naphthyridine and the 5’ hy- drogen atom of the naphthyl ring. The red contour near the C-4 carbonyl group of the naphthyridine and the 4’ hy- drogen of the naphthyl ring displayed favorable regions for negative charge groups. It was observed that the hydrogen bond donor contour map was similar to that of HeLa and exhibits the cyan contour at the C-1 NH of the naphthyr- idine and the purple contour at the 7’ position of the naph- thyl ring. Compounds 15 and 16 were well correlated with the electrostatic and hydrogen bond donor contours to show potent activity.
The CoMSIA electrostatic and hydrogen bond donor con- tours of PC-3 cells are shown in Fig. 2C. It was observed that the blue contours were near the C-1 NH of the naph- thyridine and the 3’ hydrogen of the naphthyl ring and the red contours were at the naphthyl ring and the C-7 CH3, the C-2 carbonyl, the C-5 hydrogen, and the C-6 hydrogen of naphthyridine. The cyan contour around the C-1 NH of the naphthyridine and the purple contour near the naph- thyl ring were observed. Thus, if the C-7 CH3 was replaced with electronegative groups (e.g., methoxy or carbonyl groups), and the naphthyl ring was substituted with a qui- noline ring, the biological activity could be improved.
Compounds 14, 15, and 16 also correlated well with the electrostatic and hydrogen-bond donor fields to exhibit high potency.
In conclusion, compounds 14, 15, and 16 showed much more potent cytotoxicities than colchicine in human cancer cell lines. The accurate and predictive 3D-QSAR models were elucidated by high PLS parameters of the HeLa (q2, 0.857; r2, 0.984; r2pred, 0.966), HL-60 (q2, 0.777; r2, 0.937;
r2pred, 0.913), and PC-3 (q2, 0.702; r2, 0.983; r2pred, 0.974) cell lines. The small residual values of the training and test sets indicated that the predicted activity from the CoMSIA models corresponded well with the experimental activity.
The 3D-QSAR contour maps suggested that the C-1 NH and the C-4 carbonyl group of the naphthyridine ring and the C-2 naphthyl ring were important for cytotoxicity in all three human cancer cell lines. Introduction of methyl groups at the 3’, 4’, 5’, and 6’ hydrogens of the C-2 naphthyl ring could increase activity against HeLa cells, while re- placements of the 4’ hydrogen with negatively charged groups, the 5’ hydrogen with positively or negatively charg- ed groups, and the 7’ hydrogen of the C-2 naphthyl ring with hydrogen bond acceptor groups could enhance activity for HL-60 cells. The substitution of the naphthyl ring with a quinoline ring was recommended for cytotoxicity for PC-3 cells. These 3D-QSAR model results could serve as a useful guideline for designing new drugs.
REFERENCES
1. Jemal A, Siegel R, Ward E, Hao Y, Xu J, Murray T, Thun MJ.
Cancer statistics, 2008. CA Cancer J Clin. 2008;58:71-96.
2. Hu WP, Yu HS, Chen YR, Tsai YM, Chen YK, Liao CC, Chang LS, Wang JJ. Synthesis and biological evaluation of thioben- zanilides as anticancer agents. Bioorg Med Chem. 2008;16:
5295-5302.
3. Kemnitzer W, Jiang S, Wang Y, Kasibhatla S, Crogan-Grundy C, Bubenik M, Labrecque D, Denis R, Lamothe S, Attardo G, Gourdeau H, Tseng B, Drewe J, Cai SX. Discovery of 4-aryl- 4H-chromenes as a new series of apoptosis inducers using a cell- and caspase-based HTS assay. Part 5: modifications of the 2- and 3-positions. Bioorg Med Chem Lett. 2008;18:603-607.
4. Wordenmam L, Mitchison TJ. Dynamics of microtubule assem- bly in vivo. Modern Cell Biology. 1994;13:287-301.
5. Jordan MA, Wilson L. Microtubules as a target for anticancer drugs. Nat Rev Cancer. 2004;4:253-265.
6. Xia Y, Yang ZY, Xia P, Bastow KF, Tachibana Y, Kuo SC, Hamel E, Hackl T, Lee KH. Antitumor agents. 181. Synthesis and biological evaluation of 6,7,2’,3’,4’-substituted-1,2,3,4- tetrahydro-2-phenyl-4-quinolones as a new class of antimitotic antitumor agents. J Med Chem. 1998;41:1155-1162.
7. Rowinsky EK, Donehower RC. The clinical pharmacology and use of antimicrotubule agents in cancer chemotherapeutics.
Pharmacol Ther. 1991;52:35-84.
8. Verweij J, Clavel M, Chevalier B. Paclitaxel (Taxol) and doce- taxel (Taxotere): not simply two of a kind. Ann Oncol. 1994;5:
495-505.
9. Shi Q, Chen K, Li L, Chang JJ, Autry C, Kozuka M, Konoshima T, Estes JR, Lin CM, Hamel E. Antitumor agents, 154. Cyto- toxic and antimitotic flavonols from Polanisia dodecandra. J Nat Prod. 1995;58:475-482.
10. Manthey JA, Grohmann K, Guthrie N. Biological properties of citrus flavonoids pertaining to cancer and inflammation. Curr Med Chem. 2001;8:135-153.
11. Hodek P, Trefil P, Stiborová M. Flavonoids-potent and versatile biologically active compounds interacting with cytochromes P450. Chem Biol Interact. 2002;139:1-21.
12. Manthey JA, Guthrie N. Antiproliferative activities of citrus flavonoids against six human cancer cell lines. J Agric Food Chem. 2002;50:5837-5843.
13. Chan HY, Wang H, Leung LK. The red clover (Trifolium pra- tense) isoflavone biochanin A modulates the biotransformation pathways of 7,12-dimethylbenz[a]anthracene. Br J Nutr. 2003;
90:87-92.
14. Lee D, Bhat KP, Fong HH, Farnsworth NR, Pezzuto JM, King- horn AD. Aromatase inhibitors from Broussonetia papyrifera.
J Nat Prod. 2001;64:1286-1293.
15. Pouget C, Fagnere C, Basly JP, Besson AE, Champavier Y, Habrioux G, Chulia AJ. Synthesis and aromatase inhibitory activity of flavanones. Pharm Res. 2002;19:286-291.
16. Lai YY, Huang LJ, Lee KH, Xiao Z, Bastow KF, Yamori T, Kuo SC. Synthesis and biological relationships of 3’,6-substituted 2-phenyl-4-quinolone-3-carboxylic acid derivatives as antimi- totic agents. Bioorg Med Chem. 2005;13:265-275.
17. Li L, Wang HK, Kuo SC, Wu TS, Lednicer D, Lin CM, Hamel
E, Lee KH. Antitumor agents. 150. 2’,3’,4’,5’,5,6,7-substituted 2-phenyl-4-quinolones and related compounds: their synthesis, cytotoxicity, and inhibition of tubulin polymerization. J Med Chem. 1994;37:1126-1135.
18. Zhang SX, Bastow KF, Tachibana Y, Kuo SC, Hamel E, Mauger A, Narayanan VL, Lee KH. Antitumor agents. 196. Substituted 2-thienyl-1,8-naphthyridin-4-ones: their synthesis, cytotoxicity, and inhibition of tubulin polymerization. J Med Chem. 1999;42:
4081-4087.
19. Chen K, Kuo SC, Hsieh MC, Mauger A, Lin CM, Hamel E, Lee KH. Antitumor agents. 174. 2’,3’,4’,5,6,7-Substituted 2- phenyl-1,8-naphthyridin-4-ones: their synthesis, cytotoxicity, and inhibition of tubulin polymerization. J Med Chem. 1997;40:
2266-2275.
20. Litvinov VP. Chemistry and biological activities of 1,8-naph- thyridines. Russ Chem Rev. 2004;73:637-670.
21. Kren V, Rezanka T. Sweet antibiotics - the role of glycosidic residues in antibiotic and antitumor activity and their ran- domization. FEMS Microbiol Rev. 2008;32:858-889.
22. Tsuzuki Y, Tomita K, Shibamori K, Sato Y, Kashimoto S, Chiba K. Synthesis and structure-activity relationships of novel 7- substituted 1,4-dihydro-4-oxo-1-(2-thiazolyl)-1,8-naphthyridine-3- carboxylic acids as antitumor agents. Part 2. J Med Chem.
2004;47:2097-2109.
23. Tomita K, Tsuzuki Y, Shibamori K, Tashima M, Kajikawa F, Sato Y, Kashimoto S, Chiba K, Hino K. Synthesis and struc- ture-activity relationships of novel 7-substituted 1,4-dihydro-4- oxo-1-(2-thiazolyl)-1,8-naphthyridine-3-carboxylic acids as anti- tumor agents. Part 1. J Med Chem. 2002;45:5564-5575.
24. Srivastava SK, Jha A, Agarwal SK, Mukherjee R, Burman AC.
Synthesis and structure-activity relationships of potent anti- tumor active quinoline and naphthyridine derivatives. Antican- cer Agents Med Chem. 2007;7:685-709.
25. Tsuzuki Y, Tomita K, Sato Y, Kashimoto S, Chiba K. Synthesis and structure-activity relationships of 3-substituted 1,4- dihydro-4-oxo-1-(2-thiazolyl)-1,8-naphthyridines as novel anti- tumor agents. Bioorg Med Chem Lett. 2004;14:3189-3193.
26. Abbas JA, Stuart RK. Vosaroxin: a novel antineoplastic quino- lone. Expert Opin Investig Drugs. 2012;21:1223-1233.
27. Deady LW, Rogers ML, Zhuang L, Baguley BC, Denny WA.
Synthesis and cytotoxic activity of carboxamide derivatives of benzo[b][1,6]naphthyridin-(5H)ones. Bioorg Med Chem. 2005;
13:1341-1355.
28. Park JG, Kramer BS, Steinberg SM, Carmichael J, Collins JM, Minna JD, Gazdar AF. Chemosensitivity testing of human colorectal carcinoma cell lines using a tetrazolium-based colori- metric assay. Cancer Res. 1987;47:5875-5879.
29. Manthey JA, Guthrie N. Antiproliferative activities of citrus flavonoids against six human cancer cell lines. J Agric Food Chem. 2002;50:5837-5843.
30. Hwang YJ, Park SM, Yim CB, Im C. Cytotoxic activity and quantitative structure activity relationships of arylpropyl sulfonamides. Korean J Physiol Pharmacol. 2013;17:237-243.
31. Lim JC, Park SY, Nam Y, Nguyen TT, Sohn UD. The protective effect of eupatilin against hydrogen peroxide-induced injury involving 5-lipoxygenase in feline esophageal epithelial cells.
Korean J Physiol Pharmacol. 2012;16:313-320.