ISSN 1225-6552, eISSN 2287-7630 https://doi.org/10.7853/kjvs.2019.42.4.265
< Original Article >
Veterinary Service
Available online at http://kjves.org
*Corresponding author: Yong-il Cho, Tel. +82-61-750-3234, Fax. +82-61-750-3234, E-mail. [email protected]
Assessment of bovine blood sample stability for complete blood count and blood gases and electrolytes analysis during storage
Hector M. Espiritu, Shohel Al Faruk, Gyeong-jae Lee, Bryan Irvine M. Lopez, Sang-suk Lee, Yong-il Cho*
Department of Animal Science and Technology, Sunchon National University, Suncheon 57922, Korea (Received 11 December 2019; revised 16 December 2019; accepted 17 December 2019)
Abstract
Delayed arrival of blood samples from the field and a large number of samples delivered often causes delay in sample analysis leading to inaccurate measurements. Therefore, this study aimed to assess wheth- er prolonged storage in refrigerator could influence the stability of cattle blood samples and to establish an optimal time limit for complete blood count (CBC) parameters and blood gas and electrolyte (BGE) parameters analyses. Samples collected from healthy cows were tested immediately for CBC and BGE using automated hematology, blood gas and electrolyte analyzers. Samples were kept in refrigerator at 4°C and analyzed after 6 h, 12 h, 24 h, 48 h, 72 h, 120 h, and 192 h of storage. Mean differences be- tween observations were assessed at 5% significance level using ANOVA and Duncan’s multiple range test. Total CBC parameters and the platelet profile remained stable for 192 h, except for MCHC. Among leukocyte-related counts, NEU and EOS remained stable for 192 hours. WBC and LYM, and MONO values produced inconsistent measurements which recovered its initial measurement after 12 h and 24 h of storage, respectively, then remained stable until 120 h. Among the blood gas indices, PCO2, PO2, tCO2, and BE showed declining and significant changes over time, but pH, tHb, and SO2 remained sta- ble for 192 h. Electrolyte status in the blood showed that ions are unstable and tend to change in as early as 6 h of storage. This study established that cattle blood specimens for CBC analysis can be stored for 120 h at 4°C, but specimens for BGE analyses must be tested within 6 to 24 h.
Key words : Blood stability, Blood cell count, Blood gas analysis
INTRODUCTION
Animal health monitoring is a highly crucial routine used to determine the current status of health and wel- fare of animals and to reduce disease incidence. Testing of physiological parameters is an essential implemen- tation in monitoring the health status of animals. The most accepted test in assessing the physiological state of animals is blood testing. There are many inhibiting and stimulating factors that affect the circulatory system of animals, and those factors may influence blood compo- nents (Radkowska and Herbut, 2014). Maintenance of
the body’s physiological balance is one of the main functions of blood, and hematological indicators such as complete blood count (CBC), and biochemistry indi- cators such as electrolyte and blood gas levels are some of the main determinants of the animals (Anderson et al, 1999; Sattar and Mirza, 2009; Radkowska and Herbut, 2014). Evaluation of these hematological indicators is fundamental in the routine assessment of healthy and dis- eased animals in veterinary clinics and field situations.
An essential tool in evaluating the overall health of and disease presence in an animal is the CBC (Margallo and Jia, 2018). The CBC is particularly advantageous because it can suggest certain disease manifestations when physical examinations are too vague for diagnosis,
and it is very useful when establishing a prognosis (Margallo and Jia, 2018). Evaluations of blood gas lev- els and the acid–base balance are also important in the diagnosis and treatment of diseases that affect animals (Jones and Allison, 2007). Several metabolic and respi- ratory diseases affect the venous blood gas composition and acid–base values in animals (Hussein and Aamer, 2013). Moreover, evaluation of blood electrolytes is an important part of assessing the blood chemistry profile in cattle as changes in blood electrolytes concentrations can occur in different diseases (Constable et al, 2013).
As blood is the main carrier of toxins and other fermen- tation by-products in the body, identification and mon- itoring of blood gases and electrolytes is a valuable and essential means to efficiently and effectively detect the early onset of a disease (Médaille et al, 2006; Constable et al, 2013). However, inaccurate results for such para- meters could lead to misdiagnoses. It has been estimated that up to 70% of laboratory sample errors may occur before the sample is subjected for analysis (Zaninotto et al, 2012; Daves et al, 2015; Tendulkar et al, 2015;
Buoro et al, 2016). Factors ranging from the materials and chemicals used during collection and storage, the handling methods used during processing the blood (Tendulkar et al, 2015; Nnamdi et al, 2019), as well as the length of storage and temperature level, can directly influence the stability of blood parameters before sample analysis (Hedberg and Lehto, 2009; Buoro et al, 2016).
Management of blood samples, as well as the method of storage, can considerably affect the results of hemato- logical determinations (Tendulkar et al, 2015).
There are only limited investigations on the stability of blood parameters reported to date (Tendulkar et al, 2015) and only a few of these studies were based on veterinary blood samples. According to the International Council for Standardization in Hematology (ICSH), in order to obtain accurate hematological parameter results, blood specimens stored at 4°C must be tested within 24 h or up to a maximum 72 hours (Briggs et al, 2008; Briggs et al, 2014). But the testing situation in veterinary prac- tice can vary, especially in field sampling situations in which, oftentimes, a delay of sample arrival at a central diagnostic laboratory is expected and may be more than the ICSH recommended period. Also, the arrival of a
large number of field samples could defer the analysis due to the associated prolonged waiting time. Therefore, this study aimed to assess whether prolonged storage, up to 192 hours, at 4°C could influence the stability of bovine blood samples and to establish optimal time lim- its for measurement of CBC parameters, and determi- nation of blood gas and electrolyte (BGE) status indices that can serve as guidelines for veterinary practitioners and farmers, as well as laboratory technicians, and result in improved animal health monitoring and blood sample management practices.
MATERIALS AND METHODS
Study design
Blood samples were obtained from six healthy female Holstein-Friesian dairy cows (Bos taurus L.), ranging from three to five years of age. Blood samples were collected via venipuncture in the jugular vein during a routine animal health monitoring check-up at the Sun- chon National University experimental farm. K2 Ethylene- diaminetetraacetic acid (EDTA) (VacutainerⓇ, BD and Company) and Lithium Heparin tubes (VacutainerⓇ, BD and Company) were used for CBC and BGE analyses, respectively. After blood collection, sample tubes were immediately transferred to an insulated cooler box with ice and transported to the laboratory. Analysis of CBC and BGE parameters were performed on each sample immediately after arrival at the laboratory, with the in- terval not exceeding one hour. These measurements were marked as the initial observations (0H). Afterwards, the samples were stored in a refrigerator at 4°C and repeat- ed measures were obtained from each sample after 6 h, 12 h, 24 h, 48 h, 72 h, 120 h, and 192 h. Refrigerator temperature was monitored every 12 h daily to ensure there was no temperature fluctuation during the study period.
Analysis of complete blood count
Analysis of the CBC parameters was performed dur- ing the designated observation time using an IDEXX
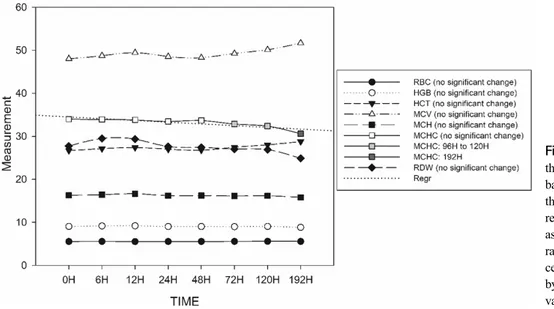
Fig. 1. Graphical presentation of the mean values of total RBC and basic CBC parameters from 0 h through the subsequent 192 h. A regression line is shown for MCHC as it was the only basic CBC pa- rameter with significant changes at certain times, which are indicated by a change of shade on the plotted values.
Procyte DxTM hematology analyzer (IDEXX Laborato- ries, Inc., USA). The CBC parameters measured were as follows: total red blood cell count parameters – eryth- rocyte count (RBC), hemoglobin count (HGB), hema- tocrit value (HCT), as well as basic CBC parameters – mean corpuscular volume (MCV), mean corpuscular he- moglobin (MCH), mean corpuscular hemoglobin concen- tration (MCHC), and red cell distribution width (RDW);
leukocyte count (WBC) and its extended differential counts includes neutrophil (NEU), eosinophil (EOS), ba- sophil (BASO), lymphocyte (LYM) and monocyte (MONO) counts; platelet profile parameters including platelet count (PLT), plateletcrit value (PCT), mean platelet volume (MPV), and platelet distribution width (PDW).
Blood gas and electrolyte analysis
The blood gas and electrolyte analyses were done us- ing IDEXX VetStatTM blood gas and electrolyte analyzer (IDEXX Laboratories, Inc., USA) during the designated observation periods. Indices for the determination of acid- base status in blood are as follows: pH, partial pressure of carbon dioxide (PCO2), base excess (BE), and total carbon dioxide (tCO2), partial pressure of oxygen (PO2), total hemoglobin (tHb), and oxygen saturation (SO2);
and parameters for electrolyte status were sodium (Na+), potassium (K+), bicarbonate (HCO3-), and chloride (Cl-) ions, as well as anion gap (AnGap).
Statistical analysis
Variation in the means of variables was computed us- ing ANOVA at the 5% level of significance. Post-hoc testing was used to determine the mean differences in variables between observation times by applying Duncan’s multiple range test using SAS 9.4 software (SAS Insti- tute Inc., USA). Data are presented as line graphs de- noted by including the plotted values along with the es- timated regression line for statistically significant varia- bles to elucidate the trend of the parameter changes over time.
RESULTS
RBC count and basic CBC parameters
The RBC count and the basic parameters for the CBC exhibited stability until the 192 h observation samples, except for the MCHC which, based on the computed mean differences, showed a statistically significant de- creasing trend after the 72 h observation as shown in Fig. 1 (and Supplemental Table 1).
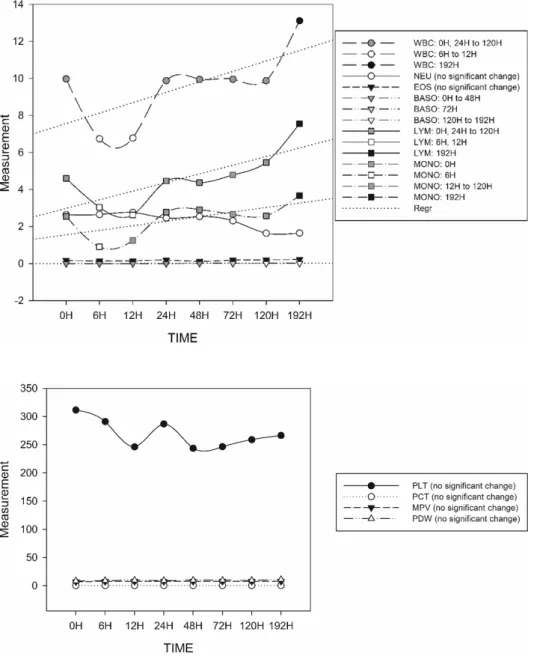
WBC and extended differentials parameters The WBC results and the extended leucocyte differ- ential counts are presented in Fig. 2 (and Supplemental
Fig. 3. Graphical presentation of mean platelet profile values show- ing the stability of measured pa- rameters and the absence of sig- nificant changes from 0H to 192 h.
Fig. 2. Graphical presentation of mean WBC and its extended dif- ferential parameter values from 0H to 192 h with regression lines shown for parameters with significant changes at certain times. Signifi- cant changes indicated by a change of shade of the plotted value.
Table 1). Both NEU and EOS counts remained stable for up to 192 h of storage, whereas the BASO count remain- ed stable for 48 h but started to significantly increase at the 72 h observation. Concurrently, the WBC, LYM, and MONO values showed statistically significant incon- sistent fluctuations throughout the observation period.
The inconsistencies observed in the WBC, LYM, and MONO values resulted in a significant decrease in their measurements in the 6 h analysis, but they returned to the initial measurement in the 24 h observation, then re- mained stable until the 120 h observation.
Platelet profile
The platelet profile parameters showed stability up to 192 h (Supplemental Table 1). The apparent trends ob- served in the PLT, MPV, PDW, and PCT values over time were insignificant throughout the observation peri- ods (Fig. 3).
Blood gases and electrolytes parameters
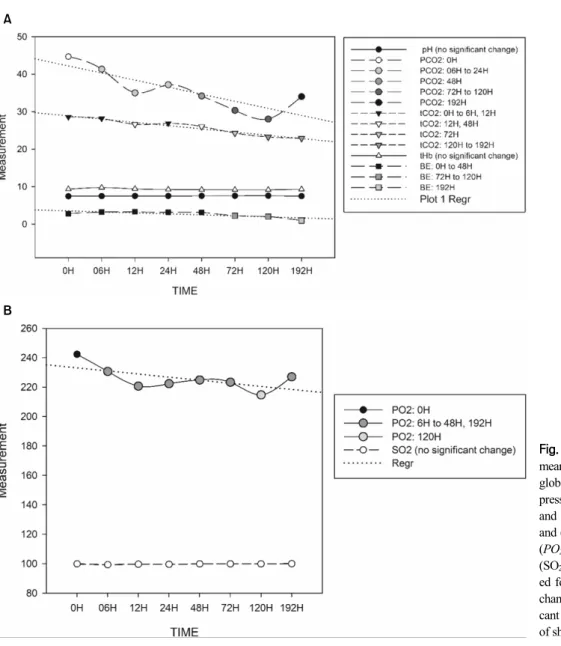
The blood gas indices measured from 0 h to 192 h are presented in Fig. 4A and 4B. Among the blood gas indices, the pH, tHb and SO2 levels remained stable
A
B
Fig. 4. Graphical presentation of mean values of (A) pH, total hemo- globin (tHb), base excess, partial pressure of carbon dioxide (PCO2), and total carbon dioxide (PO2), and (B) partial pressure of oxygen (PO2) and saturation of oxygen (SO2). Regression lines are includ- ed for parameters with significant changes at certain times. Signifi- cant changes indicated by a change of shade of the plotted value.
throughout the observation period. The tCO2 and PCO2
indices significantly declined in the 12 h and 6 h ob- servations, respectively. The PO2 also significantly de- clined in the 6 h observation. On the other hand, BE re- mained stable before decreasing significantly in the 72 h observation. Although the results of the 6 h observations showed that the levels of PO2 and PCO2 rapidly and significantly decreased, the pH level remained stable for 192 h.
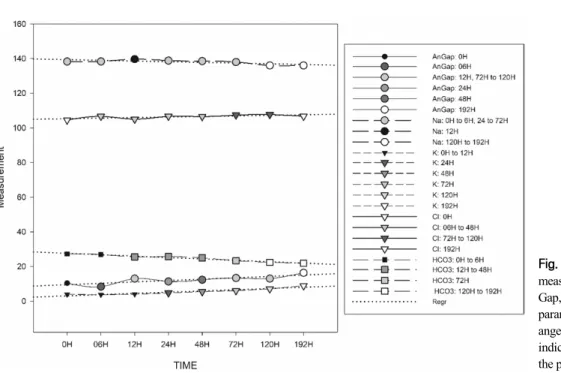
All parameters related to electrolyte status showed sig- nificant differences over time (Fig. 5). Intracellular anion HCO3- and extracellular cation Na+ displayed inconsist- ent decreasing trends throughout the observation period.
On the other hand, the extracellular anion Cl- showed a
significant inconsistent increase, while the intracellular cation K+ displayed significant increases in each period starting from the 24 h observation.
DISCUSSION
Complete blood count analysis
Red blood cells or erythrocytes are mainly responsible for carrying oxygen from the lungs to the cells of tis- sues and carry carbon dioxide from those cells back to the lungs. CBC measures usually assessed are total RBC, HCT, HGB, and RDW values. In addition, erythrocyte
Fig. 5. Graphical presentation of measured electrolyte indices: An- Gap, HCO3-, Na+, Cl-, and K+. All parameters display significant ch- anges at specific times, which are indicated by a change of shade of the plotted value.
indices including MCV, MCH, and MCHC are typically assessed as CBC basic parameters (Roland et al, 2014).
In this study, with the exception of MCHC which only remained stable up to 72 h, the RBC and other basic CBC parameters were stable for up to 196 h. Another study reported that human blood parameters, RBC, HGB, HCT, MCV, MCH, and MCHC remained stable for 48 h at 4°C (Gunawardena et al, 2017). Insignificant changes in CBC parameters were observed in a previous study when bovine blood samples were stored at 4°C until 72h (Abd Ellah et al, 2011). It has been reported that cattle blood has a long erythrocyte lifespan ranging from 130∼160 days under normal conditions (Roland et al, 2014). However, it is unclear whether the life span of erythrocytes within the normal physiological condition affects their stability ex vivo in long term refrigerated storage. In the present study, these blood parameters were observed over an extended period of time, and most showed stability for up to 192 h. Among the CBC pa- rameters, the MCHC level decreased after 72 h of stor- age in this study. One of the most commonly associated implications of a slightly decreased MCHC is strongly regenerative anemia, which can be distinguished as nor- mal (normochromic), decreased (hypochromic), or increased (hyperchromic) (Roland et al, 2014). The range of nor- mal reference values used by the IDEXX ProcyteⓇ he- matology analyzer for MCHC was 30.2∼33.5 g/dL for
bovines. Statistically, when the range of normal refer- ence value is narrow, a slight increment or decrement could imply significant changes in the value measured (Médaille et al, 2006).
White blood cells play an essential role in immune defense. A complete leucocyte count includes the num- ber of leukocytes, the relative differential blood counts, and the absolute differential blood count which includes neutrophil, lymphocytes, monocytes, eosinophils, and ba- sophils (Roland et al, 2014). The evaluation of all WBC parameters is referred to as a leukogram. In cattle, in- dications for a leukogram include diagnostic, general as- sessment, monitoring of a disease, or monitoring of thera- peutic action (Roland et al, 2014; Gunawardena et al, 2017). Among the leukocytes assessed in this study, NEU and EOS were stable until 192 h, while BASO, LYM, and MONO counts showed inconsistent fluctuations throughout the observation periods. These results are in agreement with a previous study in which they reported that the WBC count in human and veterinary samples undergo no significant changes when stored at 4°C for 5 days (Wu et al, 2017). Imeri et al found that storing a blood sample can prolong its stability when stored be- tween 4°C and 8°C (Imeri et al, 2008), and Butarello et al concluded that WBC counts are stable for up to 72 h when stored at 4°C (Buttarello, 2004). Gunawardena et al determined that differential WBC parameters remain-
ed stable for 48 h, except for the basophil count which increased in their 6 h observation when stored in a re- frigerator (Gunawardena et al, 2017). Differences in WBC differential counts can lead to clinical misinterpretations, especially when the results are close to the limits of the reference interval (Abd Ellah et al, 2011); therefore, es- tablishment of guidelines to determine how long the sta- bility of these parameters can be maintained would sup- port better management of bovine blood samples.
Platelets are anuclear cytoplasmic fragments of mega- karyocytes that function in the formation of the initial hemostatic plug of damaged vasculature and in main- taining vascular integrity (Jones and Allison, 2007; Roland et al, 2014). The most common tendencies observed in platelet profile evaluations are petechia and mucosal bleeding which can be assessed accurately from blood samples at 4 to 6 h after collection (Jones and Allison, 2007). In this study, platelet profiles were stable, al- though they did show insignificant increases and de- creases until 192 h of storage. This is because pro- longed exposure of samples to anticoagulants, especially EDTA, can cause an artifactual decrease in platelet count, which has been previously reported in cattle blood (Jones and Allison, 2007). This may also lead to a falsely ele- vated platelet count which can commonly occur because small RBCs can be misread as platelets by some auto- mated analyzers (Jones and Allison, 2007). Also, earlier studies on PLT counts have determined that sample stor- age can affect platelet volume due to clumping, but this can be remedied by intermittent mixing of samples to provide consistent results (Hussein and Aamer, 2013;
Tendulkar et al, 2015). Consequently, this mixing meth- od was practiced in all blood samples in this study prior to analysis. Although some of these concerns do not have significant relevance in this study due to the ex- hibited stability of the platelet profile parameters over a prolonged period, these also poses potential complica- tions on addressing platelet stability in the management of bovine blood samples.
Blood gases and electrolytes
Based on the results, even though the level of PCO2
and PO2 immediately decreased significantly after 6 h of
storage, the pH level remained stable for 192 h. The same finding was reported previously in cattle blood in which PCO2 and PO2 decreased significantly through time without affecting the pH and SO2 levels (Gokce et al, 2004). The pH level is considered to be the single most valuable factor in the evaluation of the acid–base status of an animal patient. Its determination depends on the level of concentration of oxygen and carbon dioxide in the blood. A decline in the PCO2 may be due to re- duced cellular activity ex vivo related to exposure to low temperatures (4°C), thereby reducing the glycolysis in erythrocytes (Gokce et al, 2004). On the other hand, PO2, which also decreased through time, may be af- fected by the consumption of oxygen in the aerobic me- tabolism of leukocytes (Gokce et al, 2004), particularly because leukocytes are responsible for most of the aero- bic metabolism occurring in blood (Hussein and Aamer, 2013). It was also reported that materials used (such as plastic syringes) and handling procedures (such as inter- mittent mixing and opening the tubes) could alter the blood gas level in blood samples before and during ana- lysis (Gokce et al, 2004). Such factors could be the rea- sons why the PO2 tended to decrease over time as the leucocyte count increased in this study. Additionally, the decrease in the BE and tCO2 did not affect the pH level of the samples at up to 192 h of storage.
The AnGap is a measure of the difference between the concentrations of commonly measured cations minus the concentrations of commonly measured anions and is commonly expressed as AnGap=(Na++K+)−(Cl-+HCO3-).
Some of the main pathophysiologic causes of an in- creased AnGap are metabolic acidosis (Gomez et al, 2015) and alkalemia (Dhondup and Qian, 2017), while a de- creased AnGap is usually due to hypoalbuminemia, be- cause of a decrease in albumin (Dhondup and Qian, 2017). In the present study, AnGap was automatically calculated using the above formula and was shown to increase with time in the blood stored at 4°C. An in- crease in AnGap is usually due to an increase in un- measured organic anions and is generally associated with decreased HCO3- concentration (Lee et al, 2006). HCO3- has a mutual role with Cl- in maintaining the electrical balance outside and within the cell. This combined role affects the concentration of these anions; for example,
when Cl- concentration outside the cell increases, HCO3- concentration inside the cell decreases (Wieth et al, 1982).
Also, K+ and Na+, as the main intracellular and ex- tracellular cations, respectively, act as major buffers in- side and outside of cells, serve to chemically neutralize the acid–base status, and maintain the osmotic pressure of cells in the body (Aronson and Giebisch, 2011). In this study, the K+ concentration tended to increase as storage time increased. This is because blood for use in electrolyte and blood gas tests was not allowed to coag- ulate due to the presence of heparin sodium; thus, the blood was stored in a liquid state over a prolonged peri- od, allowing K+ to leak out of the cells (Asirvatham et al, 2013). Another reason could be due to a drop in Na+ concentration, as was observed in this study, leading to a decrease in the osmotic pressure in the blood stored in the sample tubes, and/or due to the intermittent mixing of sample tubes before each analysis, which could lead to hemolysis allowing the K+ ions to spread to the plas- ma (Freedman and Hoffman, 1979).
In summary, this study was conducted in order to es- tablish recommendations for the management of veteri- nary field samples of blood, especially bovine blood.
These recommendations are needed because some cattle herds are located in remote areas, which can result in long field-to-laboratory delivery periods of samples that are being stored in insulated boxes with a limited sup- ply of ice coolant. In addition, occasionally, multiple samples collected from several farms may be sent in a single bulk batch for storage. Such an occurrence can result in long periods in the storage refrigerator, thus, reducing the freshness of the sample. Therefore, this study aimed to assess the influence of prolonged refrigeration at 4°C on hematological, blood gas, and blood electro- lyte parameters of cattle blood specimens. Hematological test results showed varying stability of CBC parameters.
Total RBC count and basic CBC parameters are stable for 192 h, but MCHC was only stable for 72 h. Platelet profile parameters are also stable for 192 h. Among the other CBC parameters, NEU and EOS remained stable for 192 h but the WBC extended differential parameters, BASO, LYM, and MONO produced inconsistent mea- surements. LYM and MONO showed statistically sig- nificant recovery of the initial measurement after being
stored for 12 and 24 h, respectively, and then remained stable for 120 h. Such RBC and WBC changes can be associated with the availability of blood gases in vitro because cellular metabolism of blood cells remains ac- tive post-collection and mainly depends on the remain- ing blood gases in the sample tube, which, in turn, is influenced by the level of temperature to which the samples are exposed. In addition, blood gas indices show- ed significant changes over storage time. PCO2, PO2, tCO2, and BE showed significant changes with a declin- ing trend during the course of the storage period. Al- though changes in these parameters were observed, it did not affect the stability of pH, which is one of the main parameters used to assess the acid–base status of animal blood. Moreover, measuring the electrolyte status in the blood showed that blood ion levels are unstable and tend to change after as little as 6 h. Also, changes occurring in the major electrolytes varied from ion to ion, depending on their cellular localization. This sug- gests the use of portable equipment to immediately test the blood samples when measuring the BGE to assess the acid-base and electrolyte status of animals in field situation. Although this study is limited only to small population size due to limited resources, this study is time bound requiring minimal time for analysis, there- fore small sample size would allow rapid measurement of all the samples within a short period of time in each of the designated observation time points, preventing the prolonged waiting for samples to be analyzed. However, bigger sample size, as well as inclusion of other breeds, is recommended in future studies for a more conclusive data analysis and interpretation.
In conclusion, this study established that cattle blood specimens for use in CBC analyses can be stored for 120 h (5 days) at 4°C when considering the leucocytes and the extended leucocyte differential count parameters, whereas, considering the highly unstable electrolyte pa- rameters, blood specimen for assessing blood gas and blood electrolyte status must be tested immediately or within 6 to 12 h. Handling, storage, and the urgency of testing the specimen must all be considered since hema- tological and biochemical aspects of blood can be easily affected by certain physicochemical factors. Small varia- tions in results for parameters that are very close to the
reference interval limits, especially parameters with a small range of reference values, can lead to erroneous inter- pretation.
ACKNOWLEDGEMENTS
This work was supported by Korea Institute of Plan- ning and Evaluation for Technology in Food, Agricul- ture, Forestry (IPET) Program, funded by Ministry of Agriculture, Food and Rural Affairs (MAFRA) (319015- 01-1-HD030).
REFERENCES
Abd Ellah MR, Abd-Elrahman RF, Ahmed HG, Khalaf HT, Mahmoud RR, Sayed SO, Mahmoud RM, Ali RM, Abd- Elmotagaly MF, Abd-Elhadi AN, Abd-Elhamid AM, Mahmoud AK, Abd-Elmegid AS. 2011. Effect of storage time and temperature on erythrocytes, platelets and leu- cocytes pictures of cattle and equine blood. J. Anim.
Vet. Adv. 10, 2768-2771. https://doi.org/10.3923/javaa.
2011.2768.2771
Anderson BH, Watson DL, Colditz IG. 1999. The effect of dex- amethasone on some immunological parameters in cattle.
Vet. Res. Commun. 23, 399-413. https://doi.org/10.1023/
A:1006365324335
Aronson PS, Giebisch G. 2011. Effects of pH on Potassium: New Explanations for Old Observations. J. Am. Soc. Nephrol.
22, 1981-1989. https://doi.org/10.1681/asn.2011040414 Asirvatham JR, Moses V, Bjornson L. 2013. Errors in potassium
measurement: A laboratory perspective for the clinician.
N. Am. J. Med. Sci. 5, 255-259. https://doi.org/10.4103/
1947-2714.110426
Briggs C, Carter J, Lee SH, Sandhaus L, Simon-Lopez R, Vives Corrons JL. 2008. ICSH Guideline for worldwide point- of-care testing in haematology with special reference to the complete blood count. Int. J. Lab. Hematol. 30, 105- 116. https://doi.org/10.1111/j.1751-553x.2008.01050.x Briggs C, Culp N, Davis B, D’Onofrio G, Zini G, Machin SJ.
2014. ICSH guidelines for the evaluation of blood cell analysers including those used for differential leucocyte and reticulocyte counting, International Journal of Labo- ratory Hematology. https://doi.org/10.1111/ijlh.12201 Buoro S, Mecca T, Seghezzi M, Manenti B, Cerutti L, Dominoni
P, Napolitano G, Resmini S, Crippa A, Ottomano C, Lippi G. 2016. Assessment of blood sample stability for complete blood count using the Sysmex XN-9000 and Mindray BC-6800 analyzers. Rev. Bras. Hematol. Hemoter.
38, 225-239. https://doi.org/10.1016/j.bjhh.2016.05.010
Buttarello M. 2004. Quality specification in haematology: The au- tomated blood cell count. Clin. Chim. Acta 346, 45-54.
https://doi.org/10.1016/j.cccn.2004.02.038
Constable P, Grünberg W, Staufenbiel R, Stämpfli HR. 2013.
Clinicopathologic variables associated with hypokalemia in lactating dairy cows with abomasal displacement or volvulus. J. Am. Vet. Med. Assoc. 242, 826-835. https://
doi.org/10.2460/javma.242.6.826
Daves M, Zagler EM, Cemin R, Gnech F, Joos A, Platzgummer S, Lippi G. 2015. Sample stability for complete blood cell count using the Sysmex XN haematological analyser.
Blood Transfus. 13, 576-582. https://doi.org/10.2450/2015.
0007-15
Dhondup T, Qian Q. 2017. Acid-Base and Electrolyte Disorders in Patients with and without Chronic Kidney Disease:
An Update. Kidney Dis. 3, 136-148. https://doi.org/10.
1159/000479968
Freedman JC, Hoffman JF. 1979. Ionic and osmotic equilibria of human red blood cells treated with nystatin. J. Gen. Phy- siol. 74, 157-185. https://doi.org/10.1085/jgp.74.2.157 Gokce G, Citil M, Gunes V, Atalan G. 2004. Effect of time delay
and storage temperature on blood gas and acid-base val- ues of bovine venous blood. Res. Vet. Sci. 76, 121-127.
https://doi.org/10.1016/j.rvsc.2003.08.009
Gomez DE, Biermann NM, Sanchez LC. 2015. Physicochemical Approach to Determine the Mechanism for Acid-Base Disorders in 793 Hospitalized Foals. J. Vet. Intern. Med.
29, 1395-1402. https://doi.org/10.1111/jvim.13590 Gunawardena D, Jayaweera S, Madhubhashini G, Lokumarakkala
DD, Senanayake SJ. 2017. Reliability of Parameters of Complete Blood Count With Different Storage Conditions.
J. Clin. Lab. Anal. 31, 1-6. https://doi.org/10.1002/jcla.22042 Hedberg P, Lehto T. 2009. Aging stability of complete blood
count and white blood cell differential parameters ana- lyzed by Abbott CELL-DYN Sapphire hematology ana- lyzer. Int. J. Lab. Hematol. 31, 87-96. https://doi.org/10.
1111/j.1751-553X.2007.01009.x
Hussein HA, Aamer AA. 2013. Influence of different storage times and temperatures on blood gas and acid-base balance in ovine venous blood. Open Vet. J. 3, 1-7.
Imeri F, Herklotz R, Risch L, Arbetsleitner C, Zerlauth M, Risch GM, Huber AR. 2008. Stability of hematological analy- tes depends on the hematology analyser used: A stability study with Bayer Advia 120, Beckman Coulter LH 750 and Sysmex XE 2100. Clin. Chim. Acta 397, 68-71. https://
doi.org/10.1016/j.cca.2008.07.018
Jones ML, Allison RW. 2007. Evaluation of the Ruminant Com- plete Blood Cell Count. Vet. Clin. North Am. - Food Anim.
Pract. 23, 377-402. https://doi.org/10.1016/j.cvfa.2007.07.
002
Lee S, Kang KP, Kang SK. 2006. Clinical usefulness of the se- rum anion gap. Electrolyte Blood Press. 4, 44-46. https://
doi.org/10.5049/EBP.2006.4.1.44
Margallo SF, Jia B. 2018. Stability of complete rabbit blood count parameters in under various storage times and temper-
atures. J. Vet. Sci. Technol. 09, 7579. https://doi.org/10.
4172/2157-7579-c1-037
Médaille C, Briend-Marchal A, Braun JP. 2006. Stability of se- lected hematology variables in canine blood kept at room temperature in EDTA for 24 and 48 hours. Vet.
Clin. Pathol. 35, 18-23. https://doi.org/10.1111/j.1939-165X.
2006.tb00083.x
Nnamdi OH, Ijeoma UR, Okaforx NT. 2019. Stability of hemato- logical parameters of canine blood samples stored with citrate phosphate dextrose adenine-1 anticoagulated plas- tic vacutainers. Vet. World 12, 449-453. https://doi.org/
10.14202/vetworld.2019.449-453
Radkowska I, Herbut E. 2014. Hematological and biochemical blood parameters in dairy cows depending on the man- agement system. Anim. Sci. Pap. Reports 32, 317-325.
Roland L, Drillich M, Iwersen M. 2014. Hematology as a diag- nostic tool in bovine medicine. J. Vet. Diagnostic Investig.
26, 592-598. https://doi.org/10.1177/1040638714546490 Sattar A, Mirza RH. 2009. Haematological parameters in exotic
cows during gestation and lactation under subtropical con-
ditions. Pak. Vet. J. 29, 129-132.
Tendulkar A, Jain P, Gujral S, Tambe M, Kenjale R, Ganesh B.
2015. Stability of Selected Hematological Parameters in Stored Blood Samples. J. Cell Sci. Ther. 06. https://do- i.org/10.4172/2157-7013.1000220
Wieth JO, Andersen OS, Brahm J, Bjerrum PJ, Borders CL. 1982.
Chloride--bicarbonate exchange in red blood cells: phys- iology of transport and chemical modification of binding sites. Philos. Trans. R. Soc. Lond. B. Biol. Sci. 299, 383- 399. https://doi.org/10.1098/rstb.1982.0139
Wu DW, Li YM, Wang F. 2017. How Long can we Store Blood Samples: A Systematic Review and Meta-Analysis.
EBioMedicine 24, 277-285. https://doi.org/10.1016/j.ebiom.
2017.09.024
Zaninotto M, Tasinato A, Padoan A, Vecchiato G, Pinato A, Sciacovelli L, Plebani M. 2012. Effects of sample trans- portation on commonly requested laboratory tests. Clin.
Chem. Lab. Med. 50, 1755-1760. https://doi.org/10.1515/
cclm-2012-0150