Abstract
Current bridge design codes do not clearly specify the girder distribution factors for con- tinuous bridges. The objective of the paper is to validate the use of code-specified girder dis- tribution factors for the continuous steel girder bridges, and to provide a basis for recom- mended girder distribution factors (GDF) for interior girders, suitable for evaluation of exist- ing continuous steel girder bridges. This paper presents the procedure and results of 3-di- mensional finite element analysis that were performed on five of continuous steel girder bridges to verify girder distribution factors. The analysis results showed that the live load moment distribution at the negative moment region is very similar to those at the positive moment region in continuous steel girder bridges. It was also found that the GDF's based on the strain values are similar to those based on the deflection. GDF's based on the deflection show marginally better distribution. The analysis results confirmed that the code specified GDF's for continuous steel girder birdges are very conservative.
요 지
현재의 교량설계기준에서는 연속거더교량에 대한 활하중 분배계수 규정에 대해 명확한 언급이 되어있지 않다. 따라서 이 논문의 목적은 단순교에 사용되는 시방서 규정 활하중 분배계수가 연속거더교에도 적용이 가능한지를 유한요소해석에 의해 검증하는 것이다. 연속거더교에 대한 활하중 분배의 영향을 검증하기 위해 5개의 공용중인 연속교에 대한 유한요소해석을 실행하였으며 그 결과 연속교에서 정모멘트 구역과 부모멘트 구역에서 활하중의 분배 형태는 매우 비슷하다는 결론을 내릴 수 있었다. 또한 처짐값의 비교에서 얻어진 활 하중의 분배와 변형율에 기본한 활하중의 분배 양상의 차이가 거의 없는 것으로 나타났다. 해석 결과 현재 사용되고 있는 설계기준의 활하중 분배에 대한 규정은 연속거더교에 대해 매우 보수적이라고 판단된다.
Keywords : Live-Load Distribution, Continuous Girder Bridges, Finite Element Analysis 핵심 용어 : 활하중 분배, 연속거더교, 유한요소해석
강거더 연속교의 횡방향 활하중분배계수 검증
Girder Distribution Factors for Continuous Steel Girder Bridges
엄 준 식*
Eom, Jun-Sik
1)
* 정회원, 상지대학교 건설시스템공학과 전임강사, 공학박사
2)
E-mail : [email protected] 033-730-0478
•본 논문에 대한 토의를 2005년 9월 30일까지 학회로 보내 주시면 2006년 1월호에 토론결과를 게재하겠습니다.
1. Introduction
A considerable number of bridges show signs of deterioration. In particular, there is a severe corrosion on many steel bridges. Therefore, there is a need for accurate and inexpensive methods for diagnostics, particularly, ver- ification of load distribution.
Load test is an increasingly important topic in the effort to deal with the deteriorating infrastructure. However, the load test is not always feasible due to high traffic volume, inaccessibility. In this situation, finite ele- ment analysis can be a valuable alternative to accurately verify the actual load carrying ca- pacity of existing bridges.
The objective of this study is to validate the code specified girder distribution factors (GDF) for in-service continuous steel girder bridges by 3-D finite element analysis.
Nowak et al. (1999) carried out load tests on five simply supported bridges to verify the code specified GDF's. An extensive ex- perimental and analytical study by Eom and Nowak (2001) confirmed that for the simply supported girder bridges, the GDF's specified by the AASHTO Standards (2002) and AASHTO LRFD (2004) are often too conservative.
However, the GDF's for the continuous girder bridges were not considered in the previous study. Knowledge of the accurate GDF's is needed to determine the actual value of live load (design truck load) for bridge girders.
Continuous bridges can have different girder distribution characteristics.
However, current bridge design codes such as AASHTO Standards (2002) and AASHTO LRFD (2004) do not clearly specify the girder distribution factors for continuous bridges.
Korean Standard Highway Bridge Codes (1996, 2005) use the same GDF formulas as AASHTO formulas. The GDF formula specified in the AASHTO Standards (2002) was originally pro- posed by Newmark (1948) based on lab tests, and later developed by Sanders and Elleby (1970) by modeling bridges as orthotropic plates, and in these studies, continuous sup- port conditions were not considered.
Therefore, this study aims to verify the girder distribution factors for continuous steel girder bridges. To accomplish this, finite ele- ment analysis was carried out on five of in-service highway bridges. The girder dis- tribution factors are calculated both at pos- itive moment region and negative moment region. The results are compared to the speci- fied values in AASHTO Standards (2002) and AASHTO LRFD (2004).
2. Girder Distribution Factors for Continuous Bridges Specified in the Codes
For the bending moment in interior girders, the AASHTO Standards (2002) and the Korean Highway Bridge Specifications (2005) specify GDF's as follows. For steel girder bridges and prestressed concrete girder bridges, with mul- tiple lanes loaded,
GDF = S
1.65 (1)
where S= girder spacing (m).
In AASHTO Standards (2002) and the Korean
Standard Highway Bridge Specifications (2005),
there is no distinction between the girder dis-
tribution factors for positive moment region
and negative moment region.
The girder distribution factors specified in the AASHTO LRFD code (2004) and the Standard Specifications of Korean Highway Bridges, Supplements (1996) specify the GDF as a function of girder spacing, span length, stiffness parameters, and bridge skewness.
For the bending moment in interior girders with multiple lane loaded, GDF is:
⎟ ⎟
⎠
⎞
⎜ ⎜
⎝
⎛
⎟⎟ ⎠
⎜⎜ ⎞
⎝
⎟ ⎛
⎠
⎜ ⎞
⎝
⎟ ⎛
⎠
⎜ ⎞
⎝ + ⎛
=
1 . 0 3 0.2 0.6
075 2900 . 0
s g
Lt K L S GDF S
(2)
for
θ< 30 °
where S=girder spacing (mm); L =span length (mm); K
g= n ( I + Ae
2g) , t
s=thickness of concrete slab (mm); n =modular ratio for the girder and slab materials; I =moment of inertia of the girder ( mm
4); A =cross section area of the girder ( mm
2); e
g=distance be- tween the centers of gravity of the girder and the slab (mm); and θ =skew angle in degrees.
The AASHTO LRFD (2004) formulas were developed based on a NCHRP Project 12-26 by Zokaie (1991). However, the correction factors for continuity have been deleted in AASHTO LRFD formulas.
In the AASSHTO LRFD (2004) GDF for- mulas for continuous bridges, for the positive moment, the span length, L, is the actual span length, and for the negative moment, the span length is the average of two adjacent spans.
3. Bridge Selections
This study is focused on existing continuous
steel girder bridges. These structures con- stitute about 11% of all steel girder bridges in Michigan, the United States. In the bridge selection process, the consideration was fo- cused on that the results of the analysis can reflect the majority of steel continuous girder bridges. Therefore, the selection of bridges was based on the following criteria:
․Structural type and material; steel con- tinuous girder bridges.
․Skewness; bridges with skew angle of more than 30 degrees were excluded.
․Year of Construction; bridges built more than 20 years were considered to repre- sent the majority of continuous steel bridge population
․Number of Lanes; two-lane bridges were selected.
․Traffic volume and accessibility; field test- ing can be a very effective means to verify the results of finite element analysis.
Therefore, the field testing was planned after the analysis is finished. By this rea- son, the bridges that can be tested after- ward were considered. Very busy bridges were not considered because of the ex- pected difficulties with traffic control.
Also, the bridges with easy accessibility for instrumentation were selected for the analysis.
Finally, five bridges were selected for the analytical study. The detailed descriptions of the selected bridges are shown in Table 1.
4. Procedures used in Finite Element Analysis
For the purpose of finite element analysis,
the geometry of the bridge superstructure can
be idealized in many different ways.
Table 1 Selected Bridges
Bridge No. of Spans
No. of Lanes
Total Bridge Length (m)
Individual Span Length (m)
No. of Girders
Girder Spacing(m)
Year Constructed
Skew Angle
Bridge A 3 2 104.2 36.0+30.2+38.1 7 2.18 1982 1
Bridge B 3 2 113.2 42.7+34.4+36.0 7 2.11 1983 17
Bridge C 2 2 65.8 32.9+32.9 4 2.59 1967 0
Bridge D 3 2 106.5 38.9+28.8+38.9 6 2.54 1980 19
Bridge E 4 2 138.9 36.9+32.5+32.5+36.9 5 2.69 1979 7
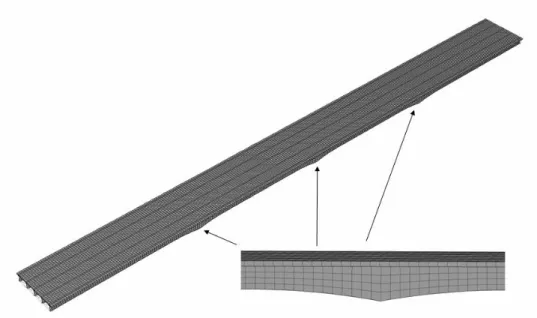
Fig. 1 Typical FEM Modeling Scheme
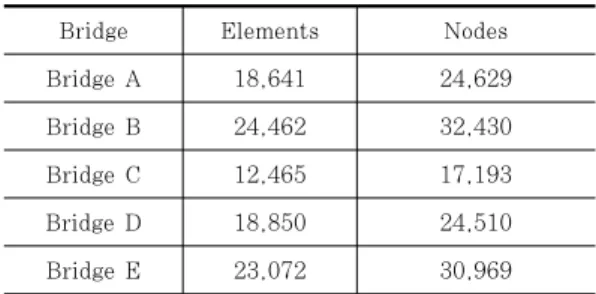
Table 2 Total No. of Elements and Nodes used in the FE Models
Bridge Elements Nodes
Bridge A 18,641 24,629
Bridge B 24,462 32,430
Bridge C 12,465 17,193
Bridge D 18,850 24,510
Bridge E 23,072 30,969
For this study, a three-dimensional finite el- ement method was applied to investigate the structural behavior of the considered bridges.
The concrete slab is modeled using isotropic, eight node solid elements, with three degrees of freedom at each node. The girder flanges and web are modeled using three-dimensional, quadrilateral, four node shell elements with six degrees of freedom at each node, as used in the study of Tarhini and Frederic (1992).
The typical modeling scheme is shown in Fig. 1.
The structural effects of the secondary members such as sidewalk and parapet, are also taken into account in the FE analysis models. An example of a FEM mesh for a bridge with five girders spaced at 2.69m is shown in Fig. 2.
The analysis was performed using the com- mercially available ABAQUS finite element program. Material and other structural pa- rameters are based on the AASHTO Guide Specifications for Strength Evaluation of Existing Steel and Concrete Bridges (1994), as well as the collected information about the bridge supplemented with engineering judgment.
The generated models for all bridges used very fine meshes. The number of elements and nodes used for each model is shown in Table 2.
5. Loadings in the Fe Models
In Michigan, the United States, the max-
imum mid-span moment in medium span
bridges is caused by 11-axle trucks, with
gross vehicle weight (GVW) up to 730 kN de-
pending the axle configuration. The vehicles used
Fig. 2 An Example of FEM Mesh used in the Analysis
Fig. 3 Typical Side-View of Trucks used in the Analysis
in the analysis were fully loaded, three-unit, 11-axle trucks. A typical side-view of a truck used in the tests is shown in Fig. 3. Analysis was performed under side-by-side truck load- ing condition.
6. Girder Distribution Factor Calculation from Analysis Results
Girder Distribution Factors (GDF) are cal- culated from the maximum static strains ob- tained from the static loading at each girder
at the selected cross section along the length of the bridge. The maximum negative bend- ing moment occurs right over the piers.
However, the strain concentration right over the supports prevents from accurate strain calculation. Therefore, strain values were re- corded at 30cm apart from the center of the supports.
Ghosn et al. (1986) assumed that GDF for a girder was equal to the ratio of the static strain at that girder to the sum of static strains for all the girders.
Stallings and Yoo (1993) used the weighted strains to account for different section moduli of the girders. Accordingly, GDF for the i-th girder, GDF
i, can be derived as follows:
∑ ∑
∑
∑
= = = ==
=
=
=
kj j j
i i k
j j j
i i
k
j j j
i i k
j j i i
w w
S S S S
ES ES M GDF M
1 1 1
1
ε ε ε ε ε
ε
λ λ
(3)
where M
i=bending moment at the i-th gird- er; E=modulus of elasticity; S
i=section mod- ulus of the i-th girder; S
ℓ=typical interior section modulus; ε
i=maximum bottom-flange static strain at the I-th girder; w
i=ratio of the section modulus of the ith girder to that of a typical interior girder; and k=number of girders.
7. Results of Fe Analysis
For each bridge, the collected strain and de- flection data obtained from the 3-D finite ele- ment analysis served as a basis for the calcu- lation of the girder distribution factors. Analysis was performed for five steel continuous girder bridges that represent the majority of Michigan steel continuous bridge populations.
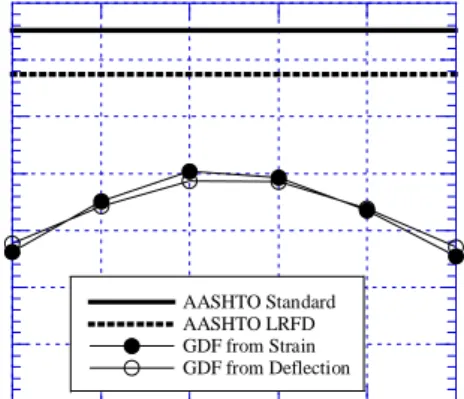
The girder distribution factors for the positive moment region, calculated from the strains and the deflections under full lane loading are shown in the Figs. 4 to 8. They are compared with code-specified values. As can be seen in the Figs. 4 to 8, for typical two lane steel girder bridges, the code-specified GDF's are conservative. Particularly, GDF's specified in the AASHTO Standards (2002) is very conservative. In some cases, the GDF from the analysis is only about 60 percent of the value specified in AASHTO Standards (2004).
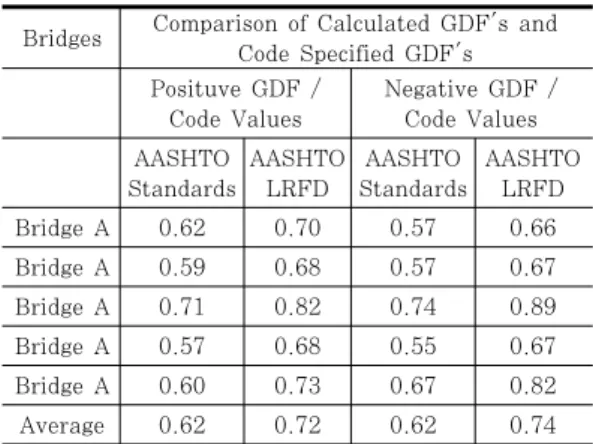
In the Table 3, the ratios for each bridge are shown. For tested bridges, the ratios range from 0.57 to 0.71 for positive GDF values, and from 0.55 to 0.74 for negative GDF values. It indicates, for tested bridges, that there are at least 30 percent of safety margin from the live load calculation by using AASHTO Standards (2002).
The GDF's specified in the AASHTO LRFD (2004) are less conservative than those of AASHTO Standards (2002). Still, AASHTO LRFD (2004) GDF's have, without exception, plenty of safety margin, as shown in the Table 3.
Figs. 4 to 8 indicate, in all bridges, that GDF's obtained from deflection data are a lit- tle less than those obtained from strain data.
However, the differences are minimal. In all cases, the differences are less than 5 percent, as shown in the Table 4.
0 0.1 0.2 0.3 0.4 0.5 0.6 0.7
1 2 3 4 5 6
AASHTO Standard AASHTO LRFD GDF from Strain GDF from Deflection
Girder Distribution Factor
Girder Number
Fig. 4 Positve GDF at Midspan (Bridge A)
0 0.1 0.2 0.3 0.4 0.5 0.6 0.7
1 2 3 4 5 6 7
AASHTO Standard AASHTO LRFD GDF from Strain GDF from Deflection
Girder Distribution Factor
Girder Number
Fig. 5 Positve GDF at Midspan (Bridge B)
Table 3 Ratio of Calculated GDF Vs. Code GDF Bridges Comparison of Calculated GDF's and
Code Specified GDF's Posituve GDF /
Code Values
Negative GDF / Code Values AASHTO
Standards
AASHTO LRFD
AASHTO Standards
AASHTO LRFD
Bridge A 0.62 0.70 0.57 0.66
Bridge A 0.59 0.68 0.57 0.67
Bridge A 0.71 0.82 0.74 0.89
Bridge A 0.57 0.68 0.55 0.67
Bridge A 0.60 0.73 0.67 0.82
Average 0.62 0.72 0.62 0.74
Table 4 Ratio of GDF based on Strain Vs. Deflection, and Positive Strains Vs. Negative Strains Bridges Comparison of Calculated GDF's (Ratios)
GDF from Positive Strain / GDF from
Deflection
GDF from Positive Strain / GDF from Negative Strain
Bridge A 1.05 1.08
Bridge A 1.04 1.04
Bridge A 1.01 0.96
Bridge A 1.03 1.05
Bridge A 1.04 0.92
Average 1.03 1.01
0 0.1 0.2 0.3 0.4 0.5 0.6 0.7 0.8
1 2 3 4
AASHTO Standard AASHTO LRFD GDF from Strain GDF from Deflection
Girder Distribution Factor
Girder Number
Fig. 6 Positve GDF at Midspan (Bridge C)
0 0.1 0.2 0.3 0.4 0.5 0.6 0.7 0.8
1 2 3 4 5 6
AASHTO Standard AASHTO LRFD GDF from Strain GDF from Deflection
Girder Distribution Factor
Girder Number
Fig. 7 Positve GDF at Midspan (Bridge D)
0 0.2 0.4 0.6 0.8 1
1 2 3 4 5
AASHTO Standard AASHTO LRFD GDF from Strain GDF from Deflection
Girder Distribution Factor
Girder Number
Fig. 8 Positve GDF at Midspan (Bridge E)
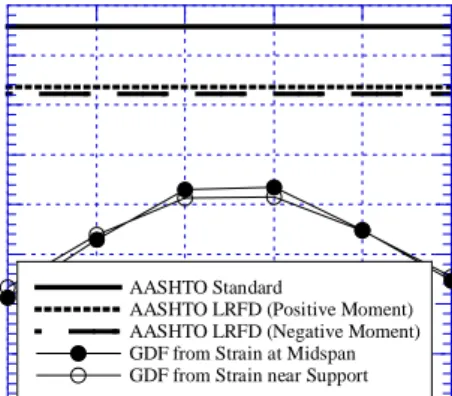
In the Figs. 9 to 13, the GDF's obtained from strains at both positive moment regions and negative regions are presented and com- pared with code specified values. The results indicate that the girder distribution at the negative moment region can be different from those at positive moment region. For 3 bridges(Figs. 9, 10 and 12), there is a better load distribution at the midspan, but others have better distribution at negative moment region. However, the differences are very small.
For all bridges, the differences in the GDF
values are documented in Table 4. In all
cases, it is confirmed that the GDF's specified in
AASHTO Standards (2002) are conservative,
0 0.1 0.2 0.3 0.4 0.5 0.6 0.7
1 2 3 4 5 6
AASHTO Standard
AASHTO LRFD (Positive Moment) AASHTO LRFD (Negative Moment) GDF from Strain at Midspan GDF from Strain near Support
Girder Distribution Factor
Girder Number
Fig. 9 Positve GDF vs. Negative GDF (Bridge A)
0 0.1 0.2 0.3 0.4 0.5 0.6 0.7
1 2 3 4 5 6 7
AASHTO Standard
AASHTO LRFD (Positive Moment) AASHTO LRFD (Negative Moment) GDF from Strain at Midspan GDF from Strain near Support
Girder Distribution Factor
Girder Number
Fig. 10 Positve GDF vs. Negative GDF (Bridge B)
0 0.1 0.2 0.3 0.4 0.5 0.6 0.7 0.8
1 2 3 4
AASHTO Standard
AASHTO LRFD (Positive Moment) AASHTO LRFD (Negative Moment) GDF from Strain at Midspan GDF from Strain near Support
Girder Distribution Factor
Girder Number
Fig. 11 Positve GDF vs. Negative GDF (Bridge C)
0 0.1 0.2 0.3 0.4 0.5 0.6 0.7 0.8
1 2 3 4 5 6
AASHTO Standard
AASHTO LRFD (Positive Moment) AASHTO LRFD (Negative Moment) GDF from Strain at Midspan GDF from Strain near Support
Girder Distribution Factor
Girder Number
Fig. 12 Positve GDF vs. Negative GDF (Bridge D)
0 0.2 0.4 0.6 0.8 1
1 2 3 4 5
AASHTO Standard
AASHTO LRFD (Positive Moment) AASHTO LRFD (Negative Moment) GDF from Strain at Midspan GDF from Strain near Support
Girder Distribution Factor
Girder Number
Fig. 13 Positve GDF vs. Negative GDF (Bridge E)