1)
* Member, Research Fellow, Dept. of Civil and Env.
Eng., Univ. of Michigan, Ann Arbor,
** Professor, Dept. of Civil and Env. Eng., Univ. of Michigan, Ann Arbor,
*** Member, Associate Professor, Dept. of Civil Eng., Sangji Univ.,
2)
E-mail :[email protected] 011-365-0520
•본 논문에 대한 토의를 2003년 6월 30일까지 학회로 보내 주시면 2003년 10월호에 토론결과를 게재하겠습니다.
Abstract
The objective of this work is to verify the Code specified girder distribution factors for short and medium span bridges. To accomplish this objective, field tests were carried out on seventeen simply supported highway bridges. This paper presents the procedure and results of field tests that were performed to verify girder distribution factors. Finite Element analyses previously performed at the University of Michigan indicated that in most cases currently used girder distribution factors specified in AASHTO Codes are too conservative. However, these studies also showed that for short spans and short girder spacings, the girder distribution factors can be too permissive. Therefore, this paper focused on experimental evaluation of girder distribution factors for short and medium span steel girder bridges. The results were compared with the distribution factors specified by AASHTO Standard (2000) and AASHTO LRFD Code (1998). It has been found that the measured girder distribution factors are lower than AASHTO values in most cases, and sometimes the code specified values are overly conservative. The research work involved formulation of the testing procedure, selection of structure, installation of equipment, measurements, and interpretation of the results.
Keywords : bridges, girder distribution, diagnostic tests, live load
단∙중경간 강형교 거더의 횡분배 모델
Girder Distribution Model for Existing Short and Medium Span Steel Girder Bridges
엄 준 식* Andrzej S. Nowak** 노 병 철***
Eom, Jun-Sik Andrzej S. Nowak Lho, Byeong-Cheol
1. Introduction
A rational bridge management requires a good knowledge of the actual loads, load distribution, load effects and structural condition (load carrying capacity). An important part of the rating equation concerns the distribution of the live load to the main load-carrying members of the bridge, and to the individual components of a multi-component member. Typically, to simplify the design and rating procedures,
load distribution to main supporting members is based on the AASHTO Specifications (1994, 1998, 2000) in United States.
Therefore, knowledge of a realistic girder distribution factor (GDF) is essential for a rational evaluation of existing structures. Finite element analyses (Nowak, 1991) previously performed at the University of Michigan indicated that the girder distribution factors (GDF) specified in AASHTO Specifications (1994, 1998, 2000) are not accurate for some groups of bridges.
In particular, the analysis (Nowak, 1991) showed that GDFs are overly conservative for long spans and larger girder spacing, while they are too permissive for short spans and small girder spacing. Similar results were obtained by Zokaie et al (1991). Values proposed by Zokaie et al (1991) were adopted as a basis for GDFs in the AASHTO LRFD Code (1998). Overestimation of GDFs can have serious economic consequences, as deficient bridges must be repaired or rehabilitated. In turn, underestimation of GDFs can compromise the safety of bridges.
Therefore, the objective of this work is to verify the Code specified girder distribution factors for short and medium span bridges. To
accomplish this objective, field tests were carried out on seventeen simply supported highway bridges (Nowak et al, 1998, 1999, 2000).
The research work involved formulation of the testing procedure, selection of structure, installation of equipment, measurements, and interpretation of the results. The work was based on experience gained in the previous study. Equipment included the data acquisition systems available at the University of Michigan.
Strains were measured for each bridge. For selected bridges, deflections were also measured.
2. Girder Distribution Factors Specified in AASHTO Codes
According to the AASHTO Standard Specifications (2000), for each interior girder, the bending moment due to live load is calculated by multiplying the lane moment and girder distribution factor (GDF). In the AASHTO Standard Specifications (2000), for steel and prestressed concrete girder bridges with a concrete deck, GDF is:
for one lane bridges,
13 . 2 GDF = S
(1)
and for multi lane bridges,
67 . 1 GDF = S
(2)
where S = girder spacing (m). Note that,
in the AASHTO Standard Specifications
(2000), GDFs are specified for a wheel line
load.
Therefore, GDFs in Eq. (1) and (2) should be multiplied by 0.5 to make it applicable to a full truck. For bridges with four or more girders, the AASHTO LRFD Specification (1998) specifies the GDF as a function of girder spacing, span length, stiffness parameters, and bridge skewness. For moment in interior girders with less than 30° of skew angle, the GDF is as follows:
for single lane loading,
+
=
0.1 3 0.3 0.4
0.06 4300
s g
Lt K L S GDF S
(3)
for multi-lane loading,
+
=
0.1 3 0.2 0.6
0.075 2900
s g
Lt K L S GDF S
(4)
where S = girder spacing (mm); L = span length (mm); K
g= n( I + Ae
2g);t
s= depth of concrete slab (mm); n = modular ratio between girder and slab materials; I = moment of inertia of the girder (mm
4); A = area of the girder (mm
2); e
g= distance between the center of gravity of the girder and slab (mm).
3. Selected Bridges for Tests
This study is focused on steel girder bridges with simply supported spans from 10 to 45 m.
These structures constitute vast majority of bridges in United States. It was observed that many steel girder bridges are considered deficient and in need of repair or replacement due to insufficient live load carrying capacity.
A considerable number of short span steel girder bridges can be saved by evaluation using a more accurate value of GDFs. In this study, seventeen bridges are selected for the verification of the GDF's .
The selection of bridges for load tests was based of the following criteria:
• Structural type and material; steel girder bridges
• Span length; spans between 10 m and 45 m.
• Number of lanes; two lane bridges were considered.
• Skewness; Bridges with skew angle of more than 30 degrees were excluded.
• Accessibility; some structures could not be considered because of difficult access for testing equipment, in particular due to deep water or excessive height.
Bridges over major highways were also excluded due to difficult traffic control during instrumentation and testing.
• Traffic volume; very busy bridges were not considered because of the expected difficulties with traffic control. Therefore, only bridges with an average daily traffic of less than 13,000 were selected.
More than a hundred bridges were inspected to verify their feasibility for load testing.
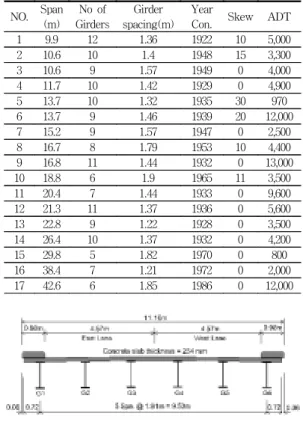
Finally, seventeen bridges were selected for
this study as listed in Table 1. A typical
cross section of selected bridges is shown in
Fig. 1. All selected bridges are located around
south Michigan, where inclement weather
causes extensive corrosion of concrete deck
and steel members in highway bridges. Bridges
1 through 6 were designed as noncomposite section,
and all others were designed as composite.
4. Instrumentation
Demountable strain transducers were installed on the bottom flanges of all girders at midspan for all girders using C clamps. Fig. 2 shows the principal construction of standard strain transducers. Strain transducers were connected to a data acquisition system. This system is controlled by an external PC notebook computer, and acquired data are processed and directly saved in the PCs hard drive.
The data acquisition system used in the tests was manufactured by National Instruments, Co.
and consists of four slot chassis, one data acquisition module and two multiplexers. Each multiplexer can handle up to 32 channels of input data.
For strain measurements, a sampling rate of 300 per second was used for calculation of dynamic effects. This is equivalent to 11.4 samples per meter at a truck speed of 95 km/h.
The real time responses of all transducers were displayed on the monitor during all stages of testing, thereby ensuring the safety of bridge load test.
5. Live Load used in the Tests
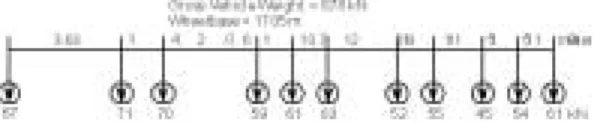
In Michigan, U.S., the maximum mid-span moment in medium span bridges is caused by 11-axle trucks, with gross vehicle weight (GVW) up to 730 kN depending on axle configuration. This is almost twice the allowable legal load in other states. Most states in U.S.
allow a maximum GVW of 356 kN with up to 5 axles per vehicle. The vehicles used in these tests were fully loaded 11-axle trucks, with a length from front to rear axle of up to 18 m.
A typical axle configuration of test trucks is shown in Fig. 3.
Strain data necessary to calculate girder distribution were taken from the bottom-flanges of girders at midspan. Strain data were obtained under passes of 11-axle trucks with known weight and axle configuration. Strain data obtained from side-by-side truck tests were used to calculate load distribution factors. Superposition of strain data from each truck provided the verification of the obtained data and confirmed the linear-elastic behavior
Fig. 1 Example of a Typical Cross Section of Selected BridgesTable 1 Selected Bridges
NO. Span (m)
No of Girders
Girder spacing(m)
Year
Con. Skew ADT
1 9.9 12 1.36 1922 10 5,000
2 10.6 10 1.4 1948 15 3,300
3 10.6 9 1.57 1949 0 4,000
4 11.7 10 1.42 1929 0 4,900
5 13.7 10 1.32 1935 30 970
6 13.7 9 1.46 1939 20 12,000
7 15.2 9 1.57 1947 0 2,500
8 16.7 8 1.79 1953 10 4,400
9 16.8 11 1.44 1932 0 13,000
10 18.8 6 1.9 1965 11 3,500
11 20.4 7 1.44 1933 0 9,600
12 21.3 11 1.37 1936 0 5,600
13 22.8 9 1.22 1928 0 3,500
14 26.4 10 1.37 1932 0 4,200
15 29.8 5 1.82 1970 0 800
16 38.4 7 1.21 1972 0 2,000
17 42.6 6 1.85 1986 0 12,000
Fig. 2 Typical Shape of Strain Transducers
of the bridge. In addition to static loading at predetermined positions, trucks were driven over the bridge at crawling speed and at regular speed to obtain the dynamic effect on the bridge. For some bridges, the locations causing maximum bending moment were analytically calculated before the tests and trucks were statically placed at the analytical maximum bending position. However, the strains obtained from crawling speed tests were always greater than those from the analytical maximum bending position, due to various structural effects not considered in the analysis.
Therefore, all other bridges were tested under crawling speed to simulate static loads.
The following load combinations were considered:
a truck close to the curb, and center of lane for each lane, and two trucks in both lanes with physically closest possible distance from each other relative to the centerline to simulate the worst loading condition. These loadings were repeated at regular speed.
6. Calculation of Girder Distribution Factors From Test Results
Collected strain data from the crawling speed and regular speed tests were filtered with a low-pass digital filter to remove the dynamic components and to obtain an equivalent static strain (Nassif, 1995).
Girder Distribution Factors (GDF) are calculated from the filtered static strain obtained from the crawling speed at each girder at the same
section along the length of the bridge. Ghosn et al. (1986) assumed that GDF was equal to the ratio of the static strain at the girder to the sum of all the static strains. Stallings and Yoo (1993) used weighted strains to account for the different section moduli of the girders. Accordingly, GDF for ith girder GDF
ican be derived as follows:
∑
∑
∑
∑
= = = ==
=
=
= k
j j j
i i k
j j j i i k
j j j i i k
j j i i
w w
S S S S
ES ES M GDF M
1 1
1 1
ε ε ε ε
ε ε
λ λ
(5)
where,
M
i; bending moment at the ith girder E ; modulus of elasticity
S
i; section modulus of the ith girder S
λ; typical interior section modulus
εi
; maximum bottom-flange static strain at the ith girder
w
i; ratio of the section modulus of the ith girder to that of a typical interior girder
k ; number of girders
When all girders have the same section modulus (that is, when weight factors, w
i,
are equal to one for all girders), Eq. (5) is equivalent to that of Ghosn et al. (1986).
Because of edge stiffening effect due to curbs and barrier walls, the section modulus in exterior girders is slightly greater than that of interior girders. In other words, the weight factors, w
i, for exterior girders are greater than one.
Fig. 3 Typical Example of Axle Configuration of Test Truck
Therefore, from Eq. (5), the assumption of the weight factors, w
i, equal to one will cause slightly overestimated girder distribution factors in interior girders and underestimated girder distribution factors in exterior girders. In this study, the weight factors, w
i, are assumed to be one.
7. Results
For each tested bridge, the test trucks were driven at crawling speed to simulate static loads and at regular speed to obtain dynamic effect on the bridge. For each bridge, the collected strain data served as a basis for the development of girder distribution factors.
Measured GDFs are compared with the values calculated according to the current design codes.
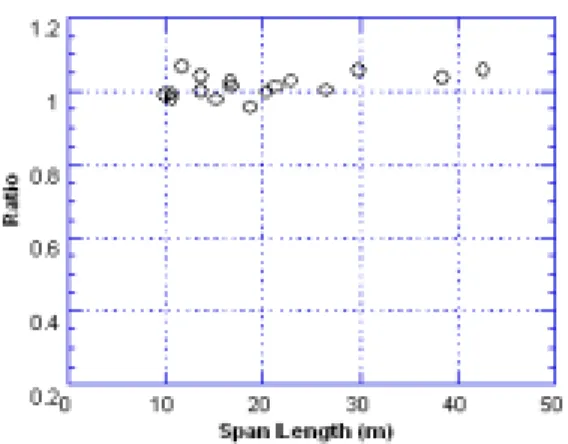
To verify the linearity of the bridge response to truck loads, the strains from single truck runs in two adjacent lanes were superimposed, and compared with strains obtained for two trucks side-by-side. The ratios of the maximum superimposed strain and the maximum strain for two trucks are plotted in Fig. 4 for the considered bridges.
The ratios are all very close to unity, and this is a good indication of linearity of the bridge behavior.
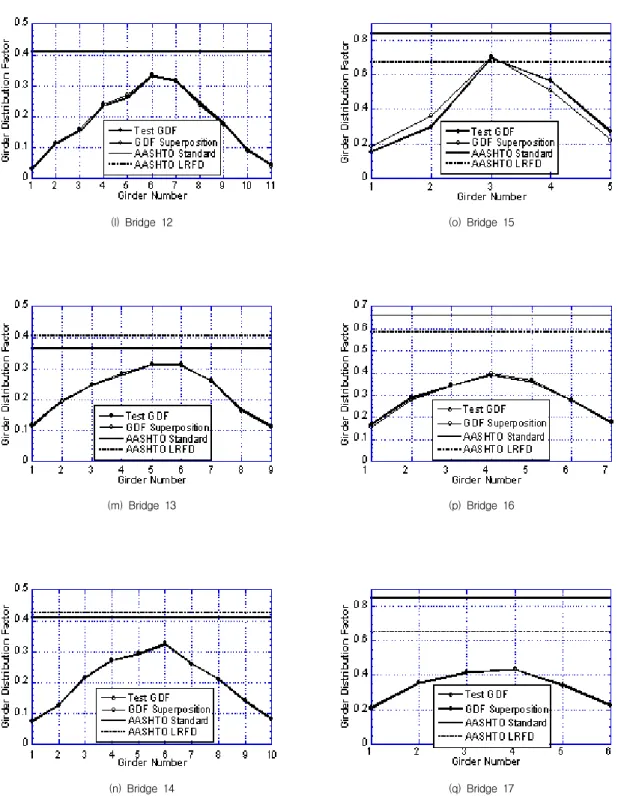
Fig. 5 presents GDF's obtained from strain values due to side-by-side loading. For two trucks side-by-side loading, the superposition of one lane loading results is also shown in the figures. Superposition of GDF values for a single truck in one lane and a single truck in the other lane are also shown in the figures, and compared with the results obtained for two trucks side-by-side, as the verification of the linear-elastic behavior of the bridge. The superposition of GDFs due to a single lane loading also produces almost the same results as strain due to two trucks side-by-side.
The recorded strains in the girders are considerably lower than the values predicted by preliminary analytical evaluation using code specified procedures (1994, 1998, 2000).
This is an indication that the bridges have better load sharing characteristics, and in turn, confirms an extra safety reserve.
For comparison, GDFs are also calculated according to AASHTO Standard (2000) and AASHTO LRFD (1998), and shown in the figures with test results. In most cases, code specified values are conservative.
Fig. 6 shows the ratio of GDF values obtained from the tests and code specified values, for AASHTO Standard (2000), and Fig. 7 for AASHTO LRFD (1998) for all seventeen tested bridges. Also shown in the figures are linear fit of the GDF values. The test GDFs shown in Fig. 6 and 7 are the maximum values from different truck positions. In the figure, the ratios of GDFs are plotted versus span length, and versus girder spacing.
Fig. 4 Ratio of Test Strain / Superposition Strain Versus Span Length
A large degree of variation was observed, even for bridges with similar structural parameters.
In summary, Fig. 6 and 7 confirm that for the short span girder bridges, AASHTO Standard (2000) specified GDF values and AASHTO LRFD (1998) are not excessively permissive. AASHTO LRFD (1998) provides GDFs that are closer to the measured values.
However, for longer span bridges with larger girder spacing, AASHTO Standard (2000) GDF values become excessively conservative, in some cases less than 60 percent of the measured values, while AASHTO LRFD (1998) maintains a level of consistent conservatism. The discrepancy
between the code-specified and test values indicates that the actual bridge condition are different from what is assumed in the code.
(a) Bridge 1
(b) Bridge 2
(d) Bridge 4 (c) Bridge 3
(e) Bridge 5
(f) Bridge 6
(g) Bridge 7
(h) Bridge 8
(i) Bridge 9
(j) Bridge 10
(k) Bridge 11
(l) Bridge 12
(m) Bridge 13
(n) Bridge 14
(o) Bridge 15
(p) Bridge 16
(q) Bridge 17
Fig. 5 Girder Distribution Factors (GDF) under Side-by-Side Loading
The mean value, standard deviation, and coefficient of variation of GDFs for tested bridges are calculated and shown in Table 2.
As expected, AASHTO Standard (2000) GDFs have the highest variation. The AASHTO LRFD GDFs (1998) also have high level of variation even though the formulas are very complicated when compared to the AASHTO Standard (2000).
In Table 2, it is also shown that the code specified GDF values are very conservative.
When the code values are compared with test, test results is less than 80 percent of what codes specifies. For one bridge, it was observed that the measured GDF is even less than 55
percent of what is specified in AASHTO Standard (2000).
8. Conclusions
The field measurements showed that the actual (measured) girder distribution factors are in most cases smaller than those specified
Fig. 6 Ratio, Test / AASHTO Standard GDF (2000), withlinear interpolation
Fig. 7 Ratio, Test / AASHTO LRFD GDF (1998), with linear interpolation
Table 2 Mean Values and Coefficient of Variations for the Ratios of GDF from Tests to Code Specified Values
GDF Ratio Mean Value Coefficient of Variation Test / AASHTO
Standard 0.79 0.152
Test / AASHTO
LRFD 0.78 0.142