* Coressponding Author: [email protected]
+ 이 논문은 2020학년도 조선대학교 학술연구비의 지원을 받 아 연구되었음.
Manuscript received January 05, 2021 / revised February 01, 2021 / accepted February 02, 2021
1) 조선대학교 경상대학 경영학부
1. Introduction
Closed-loop supply chain (CLSC) model is generally represented as a multi-stage network with various facilities at forward logistics (FL)
폐쇄루프공급망모델에서 역물류 활동 강화:
혼합유전알고리즘 접근법
+
(Reinforcing Reverse Logistics Activities in Closed-loop Supply Chain Model: Hybrid Genetic Algorithm Approach)
윤 영 수
1)*1) (YoungSu Yun)요 약 본 연구에서는 폐쇄루프공급망 (Closed-loop supply chain: CLSC) 모델에서 역물류 (Reverse logistics: RL) 활동을 강화하기 위한 방법론을 개발한다. 이를 위해 RL 활동 중에서 주로 고려되는 설비 중의 하나인 회복센터(Recovery center: RC)의 활동을 강화한다. RC에서의 강화된 활동에 따라 고객으 로부터 회수되는 사용 후 제품은 검사 및 회복과정을 거쳐 전방향물류 (Forward logistics: FL)에서 부 품 혹은 제품으로 재사용된다. 강화된 RC 활동을 가진 CLSC 모델의 운영과정을 효율적으로 표현하기 위한 수리모델이 제시되며. 혼합유전알고리즘 (Hybrid genetic algorithm: HGA) 접근법을 이용해 제안된 수리모델이 이행된다. 수치실험에서는 두 개의 상이한 형태의 CLSC 모델이 제시되며, 본 연구에서 제안 된 HGA 접근법과 기존의 연구에서 제안된 몇몇 접근법들의 수행도가 비교분석되었다. 비교분석결과 HGA가 기존의 접근법들 보다 더 우수한 수행도를 보여주었다. 또한 RC 활동의 검사 및 회복과정을 거친 부품 및 제품의 비율을 다양하게 조절함으로서 강화된 RC 활동을 가진 CLSC 모델의 유용성을 증명했다.
핵심주제어: 폐쇄루프공급망 모델, 역물류, 회복센터, 혼합유전알고리즘
Abstract In this paper, a methodology for reinforcing reverse logistics (RL) activities in a closed-loop supply chain (CLSC) model is proposed. For the methodology, the activities of the recovery center (RC) which can be considered as one of the facilities in the RL are reinforced. By the reinforced activities in the RC, the recovered parts and products after checking and recovering processes of the returned product from customer can be reused in the forward logistics (FL) of the CLSC model. A mathematical formulation is suggested for representing the CLSC model with reinforced RL activities, and implemented using a hybrid genetic algorithm (HGA) approach. In numerical experiment, two different scales of the CLSC model are presented and the performance of the HGA approach is compared with those of some conventional approaches. The experimental results show that the former outperforms the latter in most of performance measures. The robustness of the CLSC model is also proved by regulating various rates of the recovered parts and products in the RC.
Keywords: closed-loop supply chain model, reverse logistics, recovery center, hybrid genetic algorithm approach
and reverse logistics (RL). The main function of the FL is to produce product and then distribute it to customer via supplier, manufacturer, distribution center, and retailer, while, in the RL, the returned product from customer is either recovered for reuse or disposed for waste disposal. Of the activities in the RL, recovering activities such as reuse and recycling have focused on many literatures (Wang and Hsu, 2010; Paksoy et al., 2011;
Soleimani and Kannan, 2015; Chen et al., 2015;
2019; Talaei et al., 2016; Yun et al., 2017; Yun, 2018, 2020).
The CLSC model by Soleimani and Kannan (2015) considered supplier, manufacturer, warehouse, distributor, and retailer (=
customer) in the FL and collection-disassembly center, redistribution center, disposal center, and second customer in the RL. Recycling activity at the collection-disassembly center and remanufacturing activity at the manufacturer via redistribution center are enhanced for the RL. First product (= new product) produced through the FL flow is sold at retailer (= customer), while, second product (= remanufactured product) is resold at second customer. With the consideration of these sale activities, the total profit represented as objective function is maximized. A hybrid genetic algorithm (HGA) approach which combines genetic algorithm (GA) with particle swarm optimization (PSO) is suggested for implanting the CLSC model. In numerical experiments, the performance of the suggested HGA approach is compared with those of some conventional meta-heuristics approaches.
However, they do not consider various situations that the rates of recycling part and remanufacturing product can be changed.
Chen et al. (2015) suggested a CLSC model with supplier, manufacturer, warehouse, retailer and customer in the FL and collection center, recycling center and waste disposal center in the RL. The collected product from customer is changed into good-quality used product and
bad-quality one after cleaning and classifying processes at the recycling center. The good-quality used product is sent to the manufacturer, while the bad-quality one is changed into recycled raw material and unrecycled one after smashing and disassembling processes at the recycling center and then the former is sent to the manufacturer and the latter to the waste disposal center. The activities in the RL using good-quality used product and recycled raw material can increase the total profit. A genetic algorithm (GA) approach is suggested to implement the CLSC model. Large-scaled CLSC models are presented in numerical experiment to compare the performance of the GA with that of Lingo.
Similar to Soleimani and Kannan (2015), they also do not consider various situations that the rates of good-quality and bad-quality used products and those of recycled and unrecycled raw materials can be changed, though various rates in transportation costs between each stage are considered.
Chen et al. (2019) suggested a CLSC model for tire industry in Korea. In the suggested CLSC model, remanufacturing center in the RL performs remanufacturing and recycling activities using the returned tire from customer. The remanufactured tire and recycled parts at the remanufacturing center are resold at domestic market and overseas market, respectively. By this resale activity, the total profit (= total revenue – total cost) is increased. The suggested CLSC model is implemented using a HGA approach with genetic algorithm (GA) and Tabu search. In numerical experiment, the performance of the HGA approach is compared with those of various conventional HGA approaches.
However, the suggested CLSC model is only for tire industry in Korea. For instance, recycled part is usually used at the domestic market, not at the overseas one. Therefore, the application field of the suggested CLSC model
is limited.
Wang and Hsu (2010), Paksoy et al. (2011) and Talaei et al. (2016) showed similar CLSC models as shown in Chen et al. (2019).
However, their studies do not also taken into conideration various situations with the change of the rates at the RL activities.
As mentioned above, most of the conventional literatures (Wang and Hsu, 2010;
Paksoy et al., 2011; Soleimani and Kannan, 2015; Talaei et al., 2016; Chen et al., 2015;
2019) have a limitation in reinforcing the various activities of the RL. By enhancing the activities, the efficiency of implementing the CLSC model can also be improved.
In this paper, we propose a CLSC model for reinforcing the RL activities. Especially, the activities of recovery center (RC) which can be considered as one of the facilities in the RL are reinforced. Various situations that the rates of recovered parts and products after checking and recovering processes at the RC can be changed are considered. By reinforcing the RL activities, economic benefits such as the minimization of total cost or the maximization of total revenue resulting from the construction and operation of the proposed CLSC model can be achieved.
Section 2 shows a conceptual network flow of the proposed CLSC model and it is represented by mathematical formulation in Section 3. For effectively solving the proposed CLSC model, a HGA approach combined GA with revised Cuckoo search (rCS) is suggested in Section 4. The performance of the HGA approach is compare with those of some conventional competing approaches in numerical experiments using two different scales of the proposed CLSC model. Various situations with the change of the rates in the RL activities are also tested in Section 5.
Finally, some conclusions and future research directions are suggested in Section 6.
2. Proposed CLSC Model
The following assumptions are considered to implement the proposed CLSC model. They have been usually mentioned in some literatures (Chen et al., 2019; Yun et al. 2017;
2020).
· A single type product is considered.
· The numbers of facilities considered at each stage of part suppler (PS), product manufacturer (PM), distribution center (DC), retailer (RT), first customer (FC), second customer (SC), recovery center (RC) and disposal center (DP) are fixed and known beforehand.
· Only one facility is opened at each stage of the PS, PM, DC, RT, and RC, whereas, all facilities available at the FC, SC and DP are always open.
· The operation costs of the facilities considered at each stage of the PS, PM, DC, RT, and RC are all constant, different from each other in value, and known beforehand.
· The unit handling costs at the facilities considered at each stage of the PS, PM, DC, RT, and RC are all constant, different from each other in value, and known beforehand.
· The unit transportation costs among the PS, PM, DC, RT, RC, FC, SC and DP are different from each other in value and known beforehand.
· The quality of recovered part at the RC is equal to that of new part at the PS.
Therefore, there is no problem in producing new product at the PM.
· The quality of recovered product at the RC is not equal to that of new product at the PM, which means that new product is sold at the FC with an original price and the recovered product is sold at the SC with a discounted price (in our case, 80% of original price).
· The incoming and outgoing transportation amounts at each facility are equal to the handling amounts at the same facility.
· The proposed CLSC model is considered to be in a steady-state situation.
A conceptual structure of the proposed CLSC model is shown in Fig. 1.
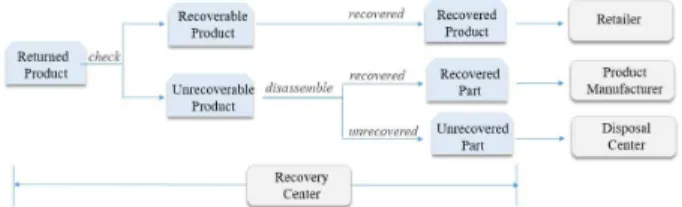
In Fig. 1, the PM receives new part from the PS and recovered one from the RC. Using the new and recovered parts, the PM produces new product and then sent it to the RT through the DC. The RT also receives the recovered product from the RC. The new product and recovered one at the RT are sold at the FC and SC, respectively. The returned products from the FC and SC are collected at the RC. At the RC, the returned products are checked and then classified into recoverable and unrecoverable products. After recovering process (ex., remanufacturing and refurbishment), the quality and function of the recoverable product is recovered and then the recovered product is resold at the SC through the RT.
The unrecoverable product is disassembled and then classified into recovered and unrecovered parts according to its re-using possibility. The recovered part is sent to the PM to be reused and the unrecovered part is sent to the DP to be disposed. The various activities at the RC is summarized in Fig. 2.
3. Mathematical Formulation
With the assumptions mentioned-above, a mathematical formulation for the proposed CLSC model is represented. First, indices,
parameters, and decision variables are defined as follows:
· Indices and Sets
p
: index of PS, ∈
,P
: set of PSsm
: index of PM, ∈
,M
: set of PMsd
: index of DC, ∈
,D
: set of DCsr
: index of RT, ∈
,R
: set of RTsc
: index of FC, ∈
,C
: set of FCss
: index of SC, ∈
,S
: set of SCse
: index of RC, ∈
,E
: set of RCsi
: index of DP, ∈
,I
: set of DPs· Parameters
c
p: thep
th capacity of PSc
m: them
th capacity of PMc
d: thed
th capacity of DCc
r: ther
th capacity of RTc
c: thec
th capacity of FCc
s: thes
th capacity of SCc
e: thee
th capacity of RCc
i: thei
th capacity of DPf
p: thep
th fixed cost at PSf
m: them
th fixed cost at PMf
d: thed
th fixed cost at DCf
r: ther
th fixed cost at RTf
e: thee
th fixed cost at RCh
p: thep
th unit handling cost at PSh
m: them
th unit handling cost at PMh
d: thed
th unit handling cost at DCh
r: ther
th unit handling cost at RTh
e: thee
th unit handling cost at RCt
pm: the unit transportation cost from PSp
to PMm
t
md: the unit transportation cost from PMm
to DCd
t
dr: the unit transportation cost from DCd
to RTr
Fig. 2 Various Activities at the RC
Fig. 1 A Conceptual Network Flow of the Proposed CLSC Model
t
rc: the unit transportation cost from RTr
to FCc
t
rs: the unit transportation cost from RTr
to SCs
t
ce: the unit transportation cost from FCc
to RCe
t
se: the unit transportation cost from SCs
to RCe
t
er: the unit transportation cost from RCe
to RTr
t
em: the unit transportation cost from RCe
to PMm
t
ei: the unit transportation cost from RCe
to DPI
s
pm: the unit selling revenue of new part from PSp
to PMm
s
em: the unit selling revenue of recovered part from RCe
to PMm
s
rc: the unit selling revenue of new product from RTr
to FCc
s
rs: the unit selling revenue of recovered product from RCe
to SCs
through RTr n
e: cost by using new technologyt
at RCe q
pm: the quantity transported from PSp
toPM
m
q
md: the quantity transported from PMm
to DCd
q
dr: the quantity transported from DCd
to RTr
q
rc: the quantity transported from RTr
to FCc
q
rs: the quantity transported from RTr
to SCs
q
ce: the quantity transported from FCc
to RCe
q
se: the quantity transported from SCs
to RCe
q
er: the quantity transported from RCe
to RTr
q
em: the quantity transported from RCe
to PMm
q
ei: the quantity transported from RCe
to DPi
· Decision variables
x
p: takes the value 1 if PSp
is opened and0 otherwise
x
m: takes the value 1 if PMm
is opened and 0 otherwisex
d: takes the value 1 if DCd
is opened and 0 otherwisex
r: takes the value 1 if RTr
is opened and 0 otherwisex
e: takes the value 1 if RCe
is opened and 0 otherwiseThe objective function is to maximize the total profit (
TP
) which consists of total revenue (TR
) and total cost (TC
). TheTR
is the sum of the following profits:i) the selling revenue of the new part transported from the PS to the PM (=
s
pmq
pm),ii) that of the recovered part from the RC to the PM (=
s
emq
em),iii) that of the new product from the RT to the FC (=
s
rcq
rc), andiv) that of the recovered product from the RC to SC through RT (=
s
rsq
rs).The
TC
consists of the following costs:i) the sum of total fixed cost (
TF
), ii) that of total handling cost (TH
),iii) that of total transportation cost (
TT
), and iv) the cost (NT
) by using new technology.The
TP
,TR
, andTC
are formulated as shown in Equations (1) to (6).maximize TP
=TR – TC
(1)TC = TF + TH + TT + NT
(2)
∑ ∑ ∑ ∑ ∑ (3)
∑ ∑ ∑∑ ∑ (4)
∑∑ ∑∑ ∑∑ ∑∑
∑∑ ∑∑
∑∑ ∑∑
∑∑ ∑∑ (5)
(6)The objective function should be optimized with respect to the following constraints.
∑ ≤ , ∀∈
(7)∑ ≤ , ∀∈
(8)∑ ≤ , ∀∈
(9)∑ ≤ , ∀∈
(10)∑ ≤ , ∀∈
(11)∑ ≤ ,∀∈
(12)∑ ≤ , ∀∈
(13)∑ ≤ ,∀∈
(14)∑ ≤ , ∀∈
(15)∑ ≤ , ∀∈
(16)∑ (17)
∑ (18)
∑ (19)
∑ (20)
∑ (21)
∈ ∀∈
(22)∈∀∈
(23)∈ ∀∈
(24)∈ ∀∈
(25)∈ ∀∈
(26) ≥ ∀∈
∀∈
∀∈
∀∈
∀∈
∀∈
∀∈
∀∈
(27) Equation (7) indicates that the amount transported from the PS to the PM is less than or equal to the capacity of the PM.Similar to Equation (7), Equations (8) to (16) means the limitation amount transported from a current stage to the next one. Equations (17) to (21) represent that only one facility should be opened at each stage of the PS, PM, DC, RT, and RC. Equations (22) to (26) impose that each decision variable should take the values of 0 or 1. Equation (27) represents the non-negativity.
4. HGA Approach
As already known, most of complicated multi-stage network problems including the proposed CLSC model are NP-complete (Gen and Cheng, 2000; Savaskan et al., 2004; Gen et al., 2018). Metaheuristics approaches such as GA, CS, Tabu search (TS), ant colony optimization, and variable neighborhood search have been adapted to solve complicated multi-stage network problems (Gen and Cheng, 1997; Min et al., 2006; Yun et al., 2012). However, unfortunately, existing single-based metaheuristics approaches have a difficulty to solve them efficiently (Yun, 2006; Gen and Cheng, 2010;
Yun et al., 2013). To cope with this weakness, various hybrid-based metaheuristics approaches have been developed (Kanagaraj et al., 2013;
Yun et al., 2013; 2020).
Most of the existing hybrid-based metaheuristics approaches uses both a single-based metaheuristics approach for global search ability and that for local search one. By using global and local search abilities in hybrid-based metaheuristics approaches, the search ability to locate global optimal solution can be reinforced. Xinyu and Liang (2016) developed a HGA approach which combines GA for global search with TS for local search. However, there exists some limitations in solving complicated multi-stage network problems. First, the search time to locate global optimal solution is time-consuming, since all individuals resulting from GA loop are adapted to produce TS list and this takes a heavy burden of computation time. Second, the possibility to locate global optimal solution can be reduced because the TS list using randomly generated initial population is adapted to GA loop.
The hybrid approach developed by Kanagaraj et al. (2013) uses the GA for global search and the CS for local search. However, there is a weakness in applying CS, that is, only one solution among all ones obtained after GA loop is adapted to be improved by using Lévy flight scheme. Therefore, the search speed in applying CS loop can be
quicker, whereas the search quality to locate global optimal solution can be deteriorated.
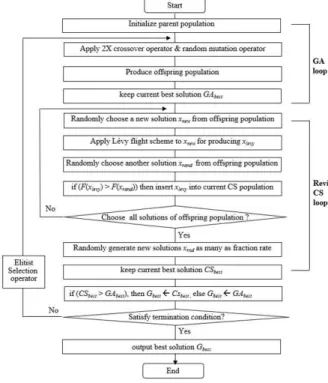
In this paper, we propose a HGA approach combing GA with rCS, called pro-HGA approach. The pro-HGA approach is an improved version of the HGA approach by Kanagaraj et al. (2013). For this purpose, all solutions obtained after GA loop are adapted to Lévy flight scheme, rather than only one solution does. By adapting all solutions, the possibility to locate global optimal solution can be reinforced. The detailed implementation scheme of the pro-HGA approach is shown in Fig. 3
5. Numerical Experiment
In numerical experiment, the mathematical formulation of the proposed CLSC model suggested in Section 3 is implemented using
two scales as presented in Table 1. Each scale shown in Table 1 is to see the changes of performance in the pro-HGA approach when the scale is increased.
To compare the performance of the pro-HGA approach, two conventional meta-heuristics approaches (GA by Gen and Cheng, 2000, HGA by Kanagaraj et al., 2013) are chosen in conventional literatures. All approaches were programmed using MATLAB and run under the same computational environment (IBM compatible PC 1.3 GHz processor-Intel core I5-1600 CPU, 4GB RAM, and OS-X EI).
The parameter settings for the GA, HGA, and pro-HGA approaches, and the measures of performance to compare the performance of each approach are shown in Tables 2 and 3, respectively. In Table 2, experimental results were obtained over 10 independent trials in order to eliminate the randomness in the implementation of each approach.
Experimental results using two different scales in Table 1 are shown in Table 4. We assumed that the rates of the amount transported from RC to RT, PM and DP are Table 1 CLSC Model with Two Different Scales
Fig. 3 Flow Chart of the pro-HGA Approach
Parameter Value
Total number of generations 500
population size 20
crossover rate 0.5
mutation rate 0.3
Table 2 Parameter Setting
Measure Discription
Best solution Best solution in all trials Average solution Values averaged over alltrials Average iteration Number of iterations
averaged over all trials Average time CPU time averaged over
all trials
Table 3 Performance Measures
equal to each other.
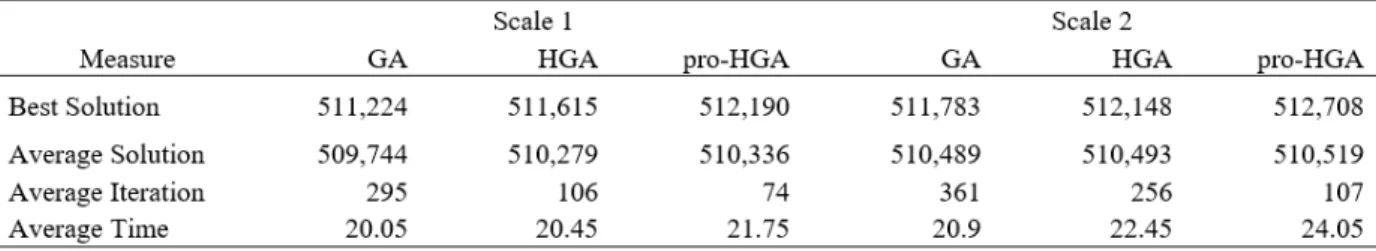
In the scale 1 of Table 4, the performance of the pro-HGA approach is about 0.2% (= 1 - 511,224/512,190) and 0.1% (= 1 - 511,615/512,190) efficient when compared with those of the GA and HGA approaches in terms of the best solution, respectively. Similar situation is also shown in terms of the average solution. However, in terms of the average iteration, the pro-HGA approach shows to be significantly better performance than the GA and HGA approaches, that is, the former has about 75% (=1 - 74/296) and 99%
(= 1 – 74/106) lower average iteration number than the GA and HGA approaches, respectively.
In terms of the average time, there is no significantly difference in all approaches. In the scale 2 of Table 4, the pro-HGA approach has slightly better performance in terms of the best solution than the GA and HGA approaches. The performance of the former is also superior to the latter in terms of the average solution. In terms of the average iteration, the pro-HGA approach has about 71% and 99% lower average iteration number than the GA and HGA approaches, respectively. However, the former shows to be slower search speed than the latter in terms of the average time. The experimental results using the scales 1 and 2 in Table 4 shows that the pro-HGA approach outperforms the
GA and HGA approaches in terms of the best solution, average solution, and average iterations except for average time.
Table 4 showed the computation results under fixed setting values in the network flows of Fig. 1. However, this situation can be changed. For instance, the amount of the recovered product sent from the RC to RT can be changed, and that of the recovered part from the RC to PM can be also changed.
Therefore, it is needed to examine the changes of total cost, total revenue and total profit in the mathematical formulation of the CLSC model suggested in Section 3 under the change of the amounts of the recovered product, recovered and unrecovered parts from the RC to RT, PM and DP.
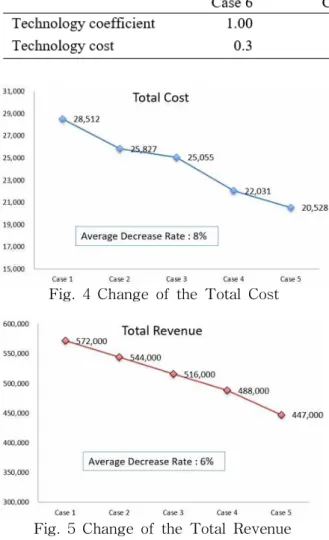
Table 5 shows the various rates of the amounts sent from the RC to RT, PM and DP. For the rates, we assume that the selling price of the recovered product sent from the RC to RT and that of the recovered part from the RC to PM are respectively 70% of that of the new product from the DC to RT and that of the new part from the PS to PM. The changes of the total cost and total revenue using the various rates shown in Table 5 are shown in Figs. 4 and 5 when using the pro-HGA approach.
In Fig. 4, it can be seen that the total cost is gradually decreased from the Case 1 to 5.
Since the amounts sent from the RC to RT Table 4 Experimental Results using Two Different Scales
Table 5 Various Rates of the Amounts sent from the RC to RT, PM and DP
and from RC to PM are gradually increased as shown in Table 5, the amounts sent from the DC to RT and from the PS to PM are gradually decreased, which means that the amount of the new part sent from the PS to PM and that of the new product sent from the DC to RT are decreased and this affects the decrease of the total cost. Similar situation is also shown in Fig. 5. The total revenue is gradually decreased form the Case 1 to 5. The average decrease rates in the total cost and total revenue are respectively 8% and 6% as shown in Figs. 4 and 5, which means that increasing the amounts of the recovered product and part is more efficient in a view of the total revenue than in a view of the total cost.
In mathematical formulation of Section 3, the cost by using new technology is fixed
(Özceylan, et al., 2017). Therefore, it is need to examine the influence on the total profit when the technology cost is changed. Table 6 shows the various changes of the costs. In Table 6, we assume the situation that the technology cost and the technology coefficient are gradually increased by 10% and 5% from Case 6 to 10, respectively. The increase of the technology coefficient means the increase of the selling prices of recovered product and part along with the increase of the technology cost. Fig. 6 shows the changes of the total profit by the changes of technology coefficient and cost in Table 6.
In Fig. 6, it can be seen that the total profit gradually increases and the average increase rate is 1%, which indicates that the increase of technology coefficient influences on the increase of the total revenue and it is more efficient when compared with the increase of the total cost by the increase of technology cost.
6. Conclusion
In this paper, we have proposed a methodology for reinforcing the RL activities in the CLSC model. For the methodology, the two activities at the RC have been considered.
Table 6 Changes of the Cost by using New Technology
Fig. 4 Change of the Total Cost
Fig. 5 Change of the Total Revenue
Fig. 6 Changes of the total profit
First, the recovered product at the RC is sent to the RT and then resold at the SC.
Secondly, the recovered part at the RC is sent to the PM and then reused for producing new product. The CLSC model including the additional two activities at the RC has been represented using mathematical formulation and the pro-HGA approach has been implemented for solving the mathematical formulation. In numerical experiment, two different scales of the CLSC model have been used for comparing the performance of the pro-HGA approach with those of two conventional competing ones. The experimental results have shown that the pro-HGA approach outperforms the others in terms of the best solution, average solution and average iteration, except for average time. Additionally, two sensitivity analyses have been down.
First, the changes of the total cost and total revenue have been examined under various changes of the amounts sent from the RC to RT, PM and DP. These various changes have not been considered in most of the conventional literatures (Wang and Hsu, 2010;
Paksoy et al., 2011; Soleimani and Kannan, 2015; Talaei et al., 2016; Chen et al., 2015;
2019). The experimental result has shown that increasing the amounts of the recovered product and part is more effective in a view of the total revenue than in a view of the total cost.
Secondly, since the cost by using new technology is fixed (Özceylan, et al., 2017), the changes of the total profit have been examined according to the changes of the costs by using new technology. The experimental result has shown that the increase of the total revenue by the increase of technology coefficient is more efficient than the increase of the total cost by the increase of technology cost.
For our future study, larger scales of the CLSC model and various hybrid meta-heuristics approaches will be used for comparing the performance of the pro-HGA
approach.
Acknowledgement
This study is a revised and extended version of the paper titled “An analysis of reverse logistics activities in closed-loop supply chain” which was presented at the
Summer Conference of Korea Society of Industrial Information Systems
, Jeju, Korea, 2020.References
Chen, X., Chuluunsukh, A., Yun, Y. S., and Gen, M. (2019). Optimization of closed-loop supply chain model using hybrid genetic algorithm approach for tire industry in Korea, Xu, J., Cooke, F. L., Gen, M. and Ahmed, S. E. (Eds.),
Proceedings of the Twelfth International Conference on Management Science and Engineering Management
, Springer, pp. 1593-1612.Chen, Y. T., Chan, F. T. S., and Chung, S. H.
(2015). An integrated closed-loop supply chain model with location and allocation problem and product recycling decisions,
International Journal of Production Research,
53, 3120-3140.Gen, M., and Cheng, R. (1997).
Genetic algorithms and engineering design,
John Wiley & Son, New York, NY, USA.Gen, M., and Cheng, R. (2000).
Genetic algorithms and engineering optimization,
John-Wiley & Sons, New York, NY, USA Gen, M., Lin, L., Yun, Y. S., and Inoue, H.(2018). Recent advances in hybrid priority-based genetic algorithms for logistics and SCM network design,
Computers and Industrial Engineering,
115, 394-412.Kanagaraj, G., Ponnambalam, S. G., and Jawahar, N. (2013). A hybrid cuckoo search and genetic algorithm for reliability-
redundancy allocation problems,
Computers and Industrial Engineering
, 66, 1115-1125.Min, H., Ko, C. S., and Ko, H. J. (2006). The spatial and temporal consolidation of returned products in a closed-loop supply chain network,
Computers and Industrial Engineering,
51, 309-320.Özceylan, E., Demirel, N., Çetinkaya, C., and Demirel, E. (2017). A closed-loop supply chain network design for automotive industry in Turkey,
Computers and Industrial Engineering
, 113, 729-745.Paksoy, T., Bektaş, T., and Özceylan, E.
(2011). Operational and environmental performance measures in a multiproduct closed-loop supply chain,
Transportation Research Part E,
47, 532–546.Savaskan, R. C., Bhattacharya, S., and Van Wassenhove, L. V. (2004). Closed-loop supply chain models with product remanufacturing,
Management Science,
50, 239-252.Soleimani, H., and Kannan, G. (2015). A hybrid particle swarm optimization and genetic algorithm for closed-loop supply chain network design in large-scale networks,
Applied Mathematical Modelling
, 39(14), 3990-4012.Talaei, M., Moghaddam, B. F., Pishvaee, M.
S., Bozorgi-Amiri, A., and Gholamnejad, S.
A. (2016). A robust fuzzy optimization model for carbon-efficient closed-loop supply chain network design problem: A numerical illustration in electronics industry,
J ournal of Cleaner Production,
113, 662-673.Wang, H. F., and Hsu, H. W. (2010). A closed-loop logistic model with a spanning tree based genetic algorithm,
Computers and Operations Research
, 37(2), 376-389.Xinyu, L., and Liang, G. (2016). An effective hybrid genetic algorithm and Tabu search for flexible job shop scheduling problem,
International J ournal of Production Economics,
174, 93-110.Yun, Y. S. (2006). Hybrid genetic algorithm with adaptive local search scheme,
Computers and Industrial Engineering,
51, 128-141.Yun, Y. S. (2018). Supply chain network design considering environmental factor and transportation types,
Journal of the Korea Industrial Information Systems Research
, 23(5), 33-41.Yun, Y. S. (2020). Sustainable closed-loop supply chain model for mobile phone:
Hybrid genetic algorithm approach,
Journal of the Korea Industrial Information Systems Research
, 25(2), 115-127.Yun, Y. S., Gen, M., and Hwang, R. K. (2012).
Adaptive genetic algorithm to multi-stage reverse logistics network design for product resale,
Information: An International Interdisciplinary Journal
, 15, 6117-6138.Yun, Y. S., Chuluunsukh, A., Gen, M. (2020).
Sustainable closed-loop supply chain design problem: a hybrid genetic algorithm approach,
Mathematics
, 8(1), 84, doi.org/10.3390/math8010084Yun, Y. S., Chuluunsukh, A., and Xing, C.
(2017). Adaptive hybrid genetic algorithm approach for optimizing closed-loop supply chain model,
Journal of the Korea Industrial Information Systems Research
, 22(2), 79-90.Yun, Y. S., Chung, H. S., and Moon, C. U.
(2013). Hybrid genetic algorithm approach for precedence-constrained sequencing problem,
Computers and Industrial Engineering,
65, 137–147.윤 영 수 (YoungSu, Yun)
∙종신회원
∙대구대학교 산업공학과 학사
∙건국대학교 산업공학과 석사, 박사
∙ Waseda University 정보생산 시스템연구과 박사
∙현재: 조선대학교 경영학부 교수
∙관심분야: 물류/SCM, 유전알고리즘, 생산최적화