in Sciences and Humanities:
Based on Bibliometric Data from Korea Citation Index *
과학 및 인문학 분야 출판 패턴의 비교 분석 : 한국학술지인용색인의 서지 데이터를 기반으로
Kiduk Yang
**<목 차>
Ⅰ. Introduction
Ⅱ. Related Research
Ⅲ. Methodology
Ⅳ. Results
Ⅴ. Concluding Remarks
ABSTRACT
In order to ascertain disciplinary differences in publication patterns that can help improve assessment of research performance in Korea, we analyzed the bibliometric data of six disciplines from Korea Citation Index. Results showed differences in research size, competitiveness, productivity, impact, and collaboration among disciplines. Disciplines in science were the largest in terms of author and institution followed by humanities and social science, but humanities produced the most publications per author, followed by social science and science disciplines. Sociology publications received most citation per paper but humanities received most citations per author, which was greatly influenced by the number of co-authors per paper. Distribution of author counts per paper varied widely across disciplines. Humanities were dominated by single-author publications, whereas the majority of publications in sciences were co-authored. The study also highlighted differences in citation lag time and illustrated differences in distribution and impact of core authors and institutions across disciplines.
Keywords: Comparative analysis, Bibliometrics, Publication Pptterns, Science, Social science, Humanities, KCI
초 록
본 연구는 한국의 연구업적평가 개선에 도움이 될 수 있도록 학문분야별 출판 패턴의 차이를 조사하기 위해 한국학술 지인용색인에서 수집한 6개 분야(문헌정보학, 사회학, 생물학, 역사학, 철학, 컴퓨터공학)의 서지데이터를 분석했다.
그 결과에 따르면 상기 6개 학문분야는 규모, 경쟁률, 생산성, 영향력 및 공동연구 관점에서 차이를 드러내었다. 우선, 저자수와 기관수 측면에서 연구 규모는 과학분야가 가장 컸으며, 인문학, 사회과학 순이었고, 저자별 출판율에서는 인문학분야가 가장 높았으며, 사회과학, 과학 순이었다. 또한 “사회학”의 경우, 논문 편당 인용수가 가장 높았으나, 인문학분야의 경우, 저자당 인용수가 가장 높은 것으로 나타나 이는 논문 편당 공동저자 수의 영향으로 보인다. 이처럼 본 연구는 논문 편당 저자수 분포에서도 학문분야별 차이를 발견할 수 있었는데, 인문학분야는 주로 단독 저자의 논문인 반면, 과학분야의 경우 대부분 공동 저술된 논문들이었다. 또한 본 연구는 학문분야별 인용시간의 차이와 핵심저자 및 기관의 분포, 이에 따른 영향의 차이도 제시하였다.
키워드: 비교 분석, 계량서지학, 출판 패턴, 과학, 사회 과학, 인문학, 한국학술지인용색인
*
**
This research was supported by Kyungpook National University Bokhyeon Research Fund, 2016.
Professor, Department of Library and Information Science, Kyungpook National University([email protected])
∙논문접수: 2019년 8월 19일 ∙최초심사: 2019년 8월 29일 ∙게재확정: 2019년 9월 17일
∙한국도서관․정보학회지 50(3), 23-47, 2019. [http://dx.doi.org/10.16981/kliss.50.201909.23]
Ⅰ . Introduction
Academic disciplines fall under the broad categories of humanities and sciences, where sciences includes subcategories such as natural science, social science, formal science and applied science.
Disciplines differ from one another not only in what they study but also in how the research is conducted. Natural science disciplines, for instance, typically employ empirical and quantitative methods to study the physical world, whereas social science disciplines often use statistical approach to analyze human behavior and society. Academic disciplines in humanities, on the other hand, investigate various aspects of human culture in a mostly non-empirical and qualitative fashion.
Higher education institutions, however, evaluate the research output in a mostly uniform manner without accounting for differences in publication behavior that can result from differing characteristics of disciplines. In fact, most universities in Korea assess faculty research performance by applying simplistic evaluation standards based on the number and venue of publications, where publication venues are grouped into international and domestic journal indexes like Science Citation Index, Social Science Citation Index, and Korea Citation Index (Lee and Yang 2015; 2017). Prior research has found different publication patterns among disciplines (Chung 1995; Glanzel and Schoepflin 1999; Hicks 2004; Hammarfeld 2016; Knievel and Kellsey 2005; Schaffer 2004) but few studies to date have analyzed the bibliometric data from comprehensive lists of journals in humanities and sciences to compare publication patterns of disciplines. Proper understanding of publication pattern differences across academic disciplines is prerequisite to adapting the current research evaluation standards to be more appropriate for each discipline.
In the hope of promoting such understanding, we undertook a two-part study that analyzes the publication patterns of six academic disciplines in domestic and international journals. The aim of the study is twofold: to discover how publication patterns differ across disciplines in Korea, and to ascertain if domestic publication patterns are comparable to those found in international journals. For the sake of consistency, we chose two disciplines from each of Clarivate Analytics’
Science Citation Index, Social Science Citation Index, and Arts and Humanities Citation Index for international data, and the same six disciplines from Korea Citation Index (KCI) for domestic data.
This paper presents the first part of the study that analyzes the bibliometric data of six
disciplines from KCI, which are biology and computer science from science category, history and
philosophy from humanities, and sociology and library and information science from social sciences. The rest of the paper is organized as follows: related research is summarized next, followed by the presentation of research methodology, analysis of results, and concluding remarks that consider implications of findings.
Ⅱ . Related Research
1. Comparative analysis of publication patterns
Scholars have argued that different research evaluation approaches should be applied to accommodate the differences in publication patterns across disciplines. Based on reviews of bibliometric studies of social sciences and humanities, Hicks (2004) concluded that bibliometric analysis of SSCI data would produce more suitable outcome to disciplines whose publication patterns are similar to science (e.g., psychology) than those that differ (e.g., sociology). In a study that examined bibliometric methods of research evaluation, Nederhof (2006) suggested that research assessment methods used in science needed to be extended for social sciences and humanities. Hammarfeld (2016) explored bibliometric methods of evaluating humanities research and concluded that lower density (i.e., less articles per topic) and slower speed of publications as well as older age of cited sources in humanities necessitate unconventional methods of research evaluation. In a similar vein, Toledo (2018), who reviewed research assessment methods in humanities and social sciences, also advocated different research evaluation approach for humanities and social science whose research take much longer to publish and be cited.
Many studies examining citation patterns found differences in citation time across disciplines.
Glanzel and Schoepflin’s (1999) study of SCI and SSCI journals found political science, business, and library and information science articles citing more recent articles than those in history and archaeology. Others reported similar findings of different citation time for disciplines: over 10 years for literature (Budd 1986; Heinzkill 1980; Thompson 2002), 10 years for economics (Robinson and Poston 2004) and sociology (Broadus 1971), and 5 years for library and information science (Chung 1995).
Huang and Chang (2008), on surveying literature to study how characteristics of research
output can affect bibliometric analysis, highlighted the prevalence of journal articles in science and diversity of publication type in humanities and social science. They also pointed out study findings that reported journal articles to be the most cited source in science while books were cited more in humanities and some social science disciplines (Chung 1995; Glanzel and Schoepflin 1999; Knievel and Kellsey 2005; Schaffer 2004). Recent studies concur with the importance of books and book chapters in humanities (Ochsner et al. 2017; Tanner 2016).
2. Research assessment in Korea
There is not an abundance of literature that compare publication patterns of disciplines in Korea. Many studies apply bibliometric analysis to investigate publication patterns of specific disciplines,
1)while others explore methods for evaluating research performance (Lee 2006; Lee and Chung 2014; Lee and Yang 2011; Yang, Lee and Choi 2015; Yoon and Kim 2005) or examine the research evaluation standards practiced in Korean universities (Kim, Yun and Rah 2012; Lee and Yang 2015; 2017; Lee, Yang and Kim 2019). Studies that examine research evaluation standards in Korea found the assessment metric to be unaccommodating to disciplinary differences, insensitive to citations, and unfavorable to collaboration.
The few domestic studies that investigated disciplinary differences arrived at conclusions similar to the international studies discussed earlier. Chung and Choi (2011) suggested a more fine-grained evaluation metric to better evaluate research quality as well as to accommodate broader research output types in humanities and social sciences. Hwang and Kim (2014), who compared journal articles in humanities with electrical engineering using network analysis, found more diverse and emerging topics in engineering. Min et. al (2006) analyzed research output of science and engineering fields and found different levels of productivity differed across disciplines. A later study by Kim and Seol (2015) also found big differences in productivity across disciplines in science and engineering. Yang, Lee and Choi (2016) analyzed publication and citation patterns across subject areas in library and information science and found differences in publishing and citing behaviors among sub-disciplines.
1) A comprehensive list of library and information science literature in Korea that analyze publication pattern is reviewed in the study by Yang and Lee (2012).
Ⅲ . Methodology
1. Data Collection
In keeping with the twofold aim of the study, which is to compare publication patterns of domestic and international research as well as those of humanities and sciences disciplines, we chose Clarivate Analytics’ Science Citation Index, Social Science Citation Index, and Arts and Humanities Citation Index for international data and equivalent subject categories in Korea Citation Index (KCI) for domestic data.
2)Two disciplines from each of science, social science, and humanities subject categories were then picked as representative samples, after which comprehensive lists of indexed journals in those six disciplines were identified by querying the KCI journal search interface.
Sample disciplines, chosen to be representative of the categories but sufficiently different within the same category, were biology and computer science for the science category, history and philosophy for humanities, and sociology and library and information science (LIS) for social science. For each of the journals in the sample, we collected bibliographic data of articles published between 2002 and 2018,
3)which amounted to be 109,464 articles with 406,291 citations published in 216 KCI indexed journals as of June 2019.
2. Data Processing
Since co-authors, Korean keywords, and foreign language keywords fields of KCI data are multi-valued fields, they had to be parsed to extract individual values in order to compute statistics by author and keyword. The co-authors field not only listed the names of all the authors for a paper but also included their affiliation, so institution information had to be extracted for each author after splitting the field into individual authors.
2) KCI does not have separate indexes for subject categories but offers a journal search interface (https://www.kci.go.kr/
kciportal/ci/clasSearch/ciSereClasList.kci) with 8 subject categories – humanities; social science; natural science; engineering;
medicine and pharmacy; marine, agriculture, fishery; arts and kinesiology – that classify 3,547 indexed journals in its database.
3) The study period of 2002 to 2018 was arrived at by adding two year for indexing lag to the 15-year target span.
Extraction of institution name from author fields is a non-trivial task since it sometimes contains extraneous information such as subsidiary affiliation (e.g., school/college, department) and location (city, state, country) in various formats. With KCI data, the problem is exacerbated because the default delimiter that separates values in multi-valued fields, which is a comma, is not always observed and affiliation information and author names sometimes contain commas (e.g., “John Doe (UCLA) Gildong Hong (Seoul University)”, “Doe, John (Department of Biology, UCLA, Los Angeles, USA), Hong Gildong (Seoul University, Korea)”). Korean keywords and foreign language keywords fields also suffer from erroneous delimiters as well as sometimes consisting of full sentences rather than keywords (e.g., “keyword1. keyword2”, “A Study of the Propaganda Policy of the United States Information Service in Korea during the Korean War”).
In addition, Korean keywords field is often composed of English keywords while foreign language keywords field is left blank. We spent a considerable time and effort to resolve the parse and extract problems caused by erroneous data via iterative heuristic algorithms, discussion of which is beyond the scope of this paper, but we suspect data problems still exist, especially in extraction of institution names and keywords.
After extracting author and institution names, we applied normalization steps to conflate the names to their canonical form. We extended name normalization methods from a prior study (Shin and Yang 2017) that involved acronym identification and name variation conflation by feeding in new data and refining the heuristic iteratively. For author name normalization, we applied two new steps to deal with anglicization of Korean names. The first step employs a simple heuristic based on detection of capitalization, hyphen, and comma to transform anglicized Korean names to a canonical form (e.g., “Hong, Gildong”, “Hong Gil-dong”, “Hong GilDong”
⇒ “Gildong Hong”). The second step, whose task is to match the anglicized Korean name to the name in Korean (e.g., “Hong, Gildong”, “Hong Gil-dong”, “Hong GilDong” ⇒ 홍길동), utilizes a name mapping table that matches anglicized Korean names to Korean names and a name character mapping table that maps a letter of Korean names to its anglicized version (e.g., 홍 ⇒ Hong) . The name-mapping table was developed by querying Google Translate with Korean names, extracting potential mappings based on frequency and a list of known Korean last names,
4)and manually validating the mappings. The name character-mapping table was developed by
4) https://en.wikipedia.org/wiki/List_of_Korean_given_names
parsing the name-mapping table entries and manually validating the most frequent character mappings.
3. Data Analysis
In addition to the common measures of publication count for productivity and citation count for impact, the study examined citation count per publication to assess the average impact and number of authors per paper to gauge the degree of collaboration. The average citation count is an important measure in comparing the research impact across disciplines since the size difference among disciplines (e.g., number of authors) can unduly influence the raw citation count.
Collaboration expressed in terms of number of co-authors per paper is another important measure because university research evaluation standards in Korea that uniformly penalize co-authored papers (Lee and Yang 2015; 2019) can be disadvantageous to disciplines that tend to collaborate more than those that do not.
Along with the base unit of analysis, which is publication, the study examined the data at author and institution levels to explore how core groups of authors and institutions influence the research output across disciplines. In consideration of data problems with keywords, we opted for simplistic identification of significant keywords based on frequencies rather than a full-scale clustering and visualization.
Ⅳ . Results
1. Sizes of Disciplines
The size of a discipline, expressed in terms of numbers of authors and institutions, is an important variable to consider when analyzing research outputs of multiple disciplines. The discipline size may be regarded as a measure of popularity on the one hand, while on the other hand it can be used as a normalization factor to estimate the relative productivity and impact of multiple disciplines.
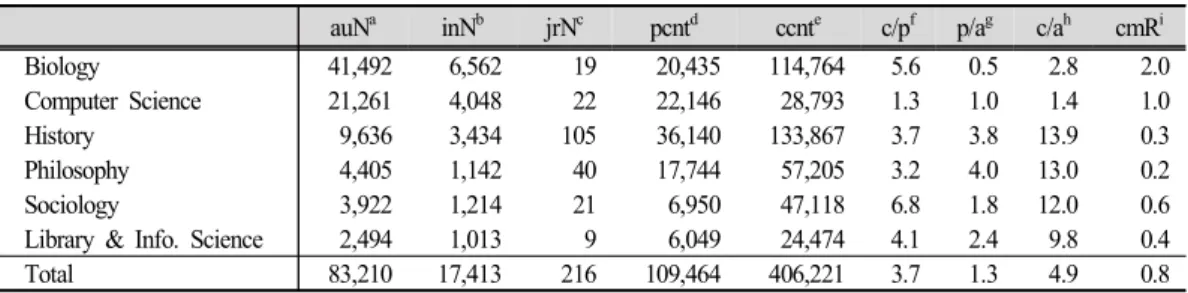
Table 1, which lists the six disciplines in the order of author numbers, shows science
disciplines to be the largest in terms of author and institution, followed by humanities and social sciences. Journal count (jrN) does not seem to be a good indicator for size as the author to journal ratio of biology (41,492/19) is over 20 times that of history (9,636/105). This does suggest that authors in biology must compete much harder than authors in history to publish. In fact, the cmR column, which shows the average number of authors for a published article, indicates that authors in biology face almost 7 times as many competitors as authors in history and 10 times as many as those in philosophy. Overall, science disciplines are shown to be the most competitive, followed by social sciences and humanities.
Article to journal ratio of biology (20,435/19) is a little over three times that of history (36,140/105), which implies that biology journals publish more articles more frequently than history journals. Sociology, on the other hand, has the lowest article to journal ratio, which is in direct contrast to its third highest cmR. This highlights sociology to be a relatively challenging discipline since authors encounter more competition with less frequent opportunities for manuscript submission.
Numbers of publications (pcnt) do not correspond to discipline sizes. History, the third largest by author and institution counts, has the most publications, which suggests history to be the most productive discipline. The large number of journals in history can be viewed as another evidence of the discipline’s prolific publication pattern. History also has the most number of citation counts (ccnt), but biology and sociology show large number of citations in proportion to their publication counts. Average citation counts per publication (c/p) clearly illustrates this point. Sociology with 6.8 citations per paper has the highest average citations, followed by biology with 5.6 average citations. In other words, sociology and biology articles get cited almost twice as much as other disciplines on average. Considering biology has over 10 times as many authors as sociology, we surmise sociology authors to be the most frequent citers of all six disciplines.
Average number of citations per author (c/a), which shows 12 for sociology and 2.8 for
biology, supports this interpretation to a degree. The fact that history and philosophy show higher
citation counts per author than sociology can be explained by the fact that there are much higher
rates of co-authored articles in sociology than history or philosophy since co-authored papers
increase the denominator when averaging over authors. Low numbers of publications per author
(p/a) for biology and computer science, both of which have the highest rate of co-authored papers,
demonstrate this effect of co-authorship. We should note at this point that publication patterns
of computer science shown in Table 1 might not tell the whole story. We suspect many computer science authors publish in international journals and KCI data alone will likely result in the underestimation of overall productivity and impact of the discipline.
<Tab. 1> Size Comparison of Six Disciplines
auN
ainN
bjrN
cpcnt
dccnt
ec/p
fp/a
gc/a
hcmR
iBiology 41,492 6,562 19 20,435 114,764 5.6 0.5 2.8 2.0
Computer Science 21,261 4,048 22 22,146 28,793 1.3 1.0 1.4 1.0
History 9,636 3,434 105 36,140 133,867 3.7 3.8 13.9 0.3
Philosophy 4,405 1,142 40 17,744 57,205 3.2 4.0 13.0 0.2
Sociology 3,922 1,214 21 6,950 47,118 6.8 1.8 12.0 0.6
Library & Info. Science 2,494 1,013 9 6,049 24,474 4.1 2.4 9.8 0.4
Total 83,210 17,413 216 109,464 406,221 3.7 1.3 4.9 0.8
a
auN: Number of authors
binN: Number of institutions
cjrN: Number of journals
d
pcnt: Publication count
eccnt: Citation count
fc/p: Average citation count per publication (ccnt/pcnt)
g
p/a: Average publication count per author (pcnt/auN)
hc/a: Average citation count per author (ccnt/auN)
i
cmR: Competition rate (auN/pcnt)
2. Co-authorships
Figure 1 plots the frequencies of author counts (i.e., number of co-authors for a paper) by year for each discipline. Science disciplines show high and steadily increasing rates of co-authorships while humanities disciplines are dominated by single-author papers with only a fraction of co-authored papers over the years. Single-author papers are still the majority in social science disciplines but collaboration is on the increase in recent years. Library and information science especially show the trend of 2-author papers catching up with single-author papers (Lee and Yang 2015; 2019). Another interesting trend is in biology where most papers are authored by six or more people in comparison to 2-author papers that is most prevalent in other disciplines.
Figure 2, which shows percentages of author count frequencies in each discipline, clearly
demonstrate the overall differences in co-authorship across disciplines. We also plotted average
citation count per paper by author count in Figure 3 through 5 to see the impact of
co-authorships. In biology, more authors garner more citations. Computer science show more or
less even numbers of citations across author counts but it could be an artifact of incomplete data
as aforementioned. Even in sole authorship dominated history and philosophy, co-authored papers
tend to amass more citations (Figure 4). A similar pattern can be observed in sociology, though
the co-authorship effect is more muted in library and information science.
<Fig. 1> Author Count by Year
<Fig. 2> Author Count Percentages by Discipline
<Fig. 3> Citations by aucnt: Biology & CS
<Fig. 4> Citations by aucnt: History & Philosophy
<Fig. 5> Citations by aucnt: LIS & Sociology
3. Publications by Year
To observe publication trends over time, we plotted publication and citation counts along with
average citation counts per publication by year (Figure 6). Research productivity as approximated
by publication volume exhibits an increasing trend in all disciplines with the biggest rate of
increase in computer science as shown by its slope. This likely reflects the astronomical
advancements in computer-driven technology in recent years. History, also showing a high rate of increase in productivity, thus highlighting it as a highly active discipline with growing importance.
<Fig. 6> Publication and Citation Count Comparisons of Disciplines
Citations, on the other hand, drops off after some time in all disciplines. Prior research (Yang,
Lee, & Choi, 2015, 2016) reported a significant lag in KCI’s indexing time with a 5 to 6 year
lag in citation counts for library and information science (LIS) data collected in 2013. This
finding still holds true for LIS in the current study (upper right chart in Figure 6). Citation lag
appears to be more severe for other disciplines with citations counts dropping off as early as 2007
for philosophy. The change of LIS citation drop-off from 2007 in 2013 KCI data collection to
2013 in 2019 data confirms the existence of citation lag, which apparently varies across disciplines. We suspect much of citation drop-off in Figure 6 is due to publications not having received their full citations but also believe KCI’s lagging behind in indexing article references to contribute to the problem. Two lessons to be learned here are that citation drop-off in later years is due to citation lag and not decreasing impact of research and citation lag can vary widely among disciplines.
The shape of citations per article graphs (bottom chart in Figure 6) closely resembles those of citation counts. The magnitude, on the other hand, follows the overall average impact observed earlier (Table 1). Sociology publications receive the most citations and computer science the least.
What the plots by year reveals is the effect of citation lag differences, which is masked in overall numbers. History with a longer citation lag shows a lower overall citation count per article than LIS today. Once missing citations are indexed at later years, however, its average citation count may exceed that of LIS.
4. Author-level Analysis
What we are interested in exploring in this section is how productivity and impact is distributed across authors. As with many observable phenomena in the physical world, both productivity and impact of authors conform to the Bradford’s law. Pareto distributions in Figures 7 and 8 reflect the Bradford’s law of research, where a small number of “core” authors are highly productive and impactful while the majority of authors neither publish a lot nor get cited highly.
Table 2 and 3 further illustrate this phenomenon. First and second columns of Table 2 show that 95% of authors in biology published seven or less articles with the aggregated output amounting to only 66% of the total publication count. Philosophy has highest numbers with 18 or less articles with 71%. At 99% level, the number of articles per author vary from 19 for biology and 30 for LIS with 87% and 91% respectively. Last three columns of Table 2 show the “core” author productivity. Top 1% of authors produce 9% (biology) to 17% (LIS) of total publications. For top 5%, the numbers go up to 29% for philosophy at the low end and 43%
for LIS at the high end. In other words, top 5% of authors produce nearly the half of total journal
papers in LIS and about a third in other disciplines. The marked difference in top author output
for LIS highlights the heightened significance of core authors for the discipline.
Author citation counts exhibit similar patterns (Table 3). Aggregated citations of top 1%
authors range from 15% (biology, philosophy) to 20% (LIS) while top 5% of authors receive from 39% (biology) to 51% (LIS) of total citations in their disciplines. 12% spread in citations and 14% spread in publications of top 5% authors signify variations in impact and productivity of core author groups among disciplines.
<Fig. 7> Distribution of Publication Count per Author
<Fig. 8> Distribution of Citation Count per Author
<Tab. 2> Publication Count Distributions of Authors
pc@95%
atpc@95%
bpc@99% tpc@99% top1%
ctop2% top5%
Biology 7 66% 19 87% 13% 20% 34%
Computer Science 10 67% 22 86% 14% 20% 33%
History 17 67% 29 89% 11% 16% 33%
Philosophy 18 71% 30 91% 9% 15% 29%
Library & Info. Science 17 57% 43 83% 17% 25% 43%
Sociology 8 65% 19 89% 11% 14% 35%
a
Maximum publication count for (bottom) 95% of authors
bTotal publication count percentage of (bottom) 95% of authors
cTotal publication count percentage of top 1% of authors
<Tab. 3> Citation Count Distributions of Authors
cc@95%
atcc@95%
bcc@99% tcc@99% top1%
ctop2% top5%
Biology 55 61% 133 85% 15% 23% 39%
Computer Science 16 57% 37 81% 19% 28% 43%
History 73 55% 162 83% 17% 26% 45%
Philosophy 67 58% 144 85% 15% 24% 42%
Library & Info. Science 70 49% 196 80% 20% 30% 51%
Sociology 81 52% 212 82% 18% 29% 48%
a
Maximum citation count for (bottom) 95% of authors
bTotal citation count percentage of (bottom) 95% of authors
cTotal citation count percentage of top 1% of authors
5. Institution-level Analysis
Productivity and impact distributions of institutions follow the same patterns observed at the author-level. The skew is extreme due to the heightened magnitude of frequencies generated from aggregating at the institution level, but Figures 9 and 10 show Pareto distributions that reflect the Bradford’s law. Intensified skewness of institution-level distributions is highlighted in Tables 4 and 5. 95% of institutions produce only 18% (computer science) to 29% (sociology) of publications while top 1% of institutions generate 36% (LIS) to 55% (history). For citations, 95%
of institutions receive from 13% (history) to 22% (sociology) of the total while top 1% of institutions garner 41% (philosophy) to 61% (history).
At the author level, top LIS authors outperformed other disciplines in productivity and impact.
At the institution level, however, core institutions in history and computer science lead in
productivity and impact. This suggests that top-performing LIS researchers are more evenly
distributed among institutions while top history and computer science departments in Korean
universities employ a concentration of high-performing researchers.
<Fig. 9> Distribution of Publication Count per Institution
<Fig. 10> Distribution of Citation Count per Institution
<Tab. 4> Publication Count Distribution of Institutions
pc@95%
atpc@95%
bpc@99% tpc@99% top1%
ctop2% top5%
Biology 30 24% 255 48% 52% 64% 76%
Computer Science 33 18% 338 48% 52% 67% 82%
History 23 19% 220 45% 55% 68% 81%
Philosophy 67 23% 395 62% 38% 57% 77%
Library & Info. Science 28 26% 231 64% 36% 55% 75%
Sociology 23 29% 140 60% 40% 54% 71%
a
Maximum publication count for (bottom) 95% of institutions
b
Total publication count percentage of (bottom) 95% of institutions
c
Total publication count percentage of top 1% of institutions
<Tab. 5> Citation Count Distribution of Institutions
cc@95%
atcc@95%
bcc@99% tcc@99% top1%
ctop2% top5%
Biology 223 21% 1494 45% 55% 66% 79%
Computer Science 49 17% 433 47% 53% 68% 83%
History 76 13% 909 39% 61% 74% 87%
Philosophy 206 20% 1168 59% 41% 59% 80%
Library & Info. Science 108 21% 893 60% 40% 59% 79%
Sociology 192 22% 896 55% 45% 59% 78%
a
Maximum citation count for (bottom) 95% of institutions
bTotal citation count percentage of (bottom) 95% of institutions
cTotal citation count percentage of top 1% of institutions
6. Keywords
Keywords fields in KCI database were inundated with data problems (see data processing subsection of Methodology) that we were not yet able to resolve fully. Consequently, we opted for simplistic identification of significant keywords based on frequencies rather than a full-scale clustering and visualization that may lead to misleading results from data error and noise. Since high frequency data items are resistant to partial data problems, we focused on identifying most popular and influential keywords with high publication or citation counts that can describe the important research areas of disciplines.
To identify top keywords, we sorted and ranked keywords by the number of articles they appear in to generate the publication ranking and by the sum of citations those articles receive to generate the citation ranking, after which we selected keywords with publication rank or citation rank less than or equal to 100. Top keywords, most frequently used or cited, comprised 139 in biology, 131 in computer science, 120 in history, 126 in philosophy, 126 in LIS, and 147 in sociology. Table 6 lists top 10 and bottom 5 significant keywords by publication and citation counts for each discipline and Figures 11a and 11b display keyword token clusters sorted by citation counts.
Bold-faced keywords in Table 6 denote those that are in top 10 by both publication and citation counts (i.e., popular and influential). Some intuitive examples of popular and influential keywords are apoptosis, Escherichia coli (i.e. E. coli) and taxonomy for biology; Internet of Things (i.e., IoT), smartphone and cloud computing for computer science; Baekje, Koguryo, Silla, Joseon, Japan and China for history; Kant, Nietzsche, and Confucianism for philosophy;
public/school/academic library, information and information literacy for library and information
science; and globalization, social capital and gender for sociology.
<Tab. 6> Significant Keywords by Publication and Citation Counts: Top 10 and Bottom 5
Publication Count Citation Count
Top 10 Bottom 5 Top 10 Bottom 5
Biology Korea taxonomy apoptosis morphology new species new record rice gene expression phylogeny escherichia coli
drug resistance viability resuscitation culturability argonaute
apoptosis virulence
reactive oxygen species rice microrna
Korea taxonomy escherichia coli oxidative stress arabidopsis
lepidoptera unrecorded species key new records coleoptera
Computer
Science Internet of Things WSN
asecurity smartphone authentication cloud computing ontology machine learning clustering RFID
opinion mining USN
bsmart learning cyber physical systems UTAUT
cSNS smartphone Internet of Things WSN
acloud computing security RFID privacy big data ontology
low power scheduling web service manet
dmultimedia
History Korea Japan Baekje Koguryo China Silla history Joseon national nationalism
theory Mongol national history Iksan
king Mu
Korea Japan Koguryo Baekje Silla history China Joseon king nationalism
community ritual modern Russia revolution
Philosophy Kant Confucianism Heidegger mind Nietzsche nature Hegel body Husserl life
children cultural capital adolescents multicultural family subjective well being
Kant Confucianism Heidegger Husserl mind happiness Nietzsche emotion Zhu Xi body
religion time reality metaphysics experience
Library &
Info.
Science
public library school library library archives
information literacy academic library university library metadata information national
centrality measures centrality analysis weighted networks language network analysis LDA
epublic library library school library network analysis archives research trends information literacy information academic library university library
knowledge management national library of Korea DDC Japan
cataloging
Sociology Korea gender globalization social capital democracy modernity civil society Japan Confucianism inequality
adjustment immigrant woman feminization migration happiness index international comparison
Korea depression social capital cultural capital globalization multiculturalism happiness life satisfaction gender trust
North Korea peace politics Taiwan India
a
WSN: Wireless Sensor Network
b USN: Ubiquitous Sensor Network
c UTAUT: Unified Theory of Acceptance and Use of Technology d manet: a type of ad hoc network
e LDA: Latent Dirichlet Allocation
Bottom 5 keywords in Table 6 represent highly influential topics that are not exceedingly common (publication count column) or topics studied by numerous authors whose works are not most highly cited (citation count column). Instances of such keywords are: “Argonaute” with publication rank (prank) of 4036 and citation rank (crank) of 98 and “Coleoptera” with prank of 24 and crank of 3677 in biology; “subjective wellbeing” with prank of 4464 and crank of 91 and “metaphysics” with prank of 90 and crank of 246 in philosophy; and “happiness index”
with prank of 1708 and crank of 75 and “India” with prank of 97 and crank of 741 in sociology.
Significant keywords were visualized using Keyword Clarity
5), which is a free web-based tool for visualizing semantic keyword clusters using Reingold and Tilford’s (1981) tree layout algorithm. Since Keyword Clarity groups keywords based on their word ordering and frequency to generate a visualization of keyword token clusters, our intention of its use was to provide a simple visual overview of semantically related keywords. Figures 11a and 11b show computer science and LIS keywords to be most compact while biology and philosophy are most spread out.
Interpreting the density as a reflection of topic diversity, we infer key research topics in computer science and LIS are more tightly knit while biology and philosophy key topics are more diverse.
Ⅴ . Concluding Remarks
Despite distinct characteristics of academic disciplines that produce different publication patterns, research output is typically evaluated in a uniform manner that can lead to misleading assessments of research performance. Research evaluation standards practiced in Korean universities exacerbate the problem by applying metrics that favor quantity and penalize collaboration to all disciplines. For disciplines that require collaborative research or value quality over quantity of research, such metrics are likely to generate unfair assessment outcomes.
In order to ascertain disciplinary differences in publication patterns that can help improve assessment of research performance in Korea, we analyzed the bibliometric data of six disciplines from Korea Citation Index. Results showed differences in research size, competitiveness, productivity, impact, and collaboration among disciplines. Disciplines in science were the largest in terms of author and institution followed by humanities and social science, but social science
5) https://keywordclarity.io/
were found to be more competitive than humanities due to larger numbers of publication venues available in humanities.
Discipline size, however, did not correspond to productivity reflected in the number of journal articles or impact manifested in the number of citations they received. Though discipline size influenced the total publication counts for disciplines, humanities produced the most publications per author, followed by social science and science disciplines. Overall citation counts corresponded to overall publication counts but average citations per paper showed sociology publications to be most highly cited, closely followed by biology. On the other hand, humanities received the most citations per author, followed by social sciences and sciences. Per author counts were greatly influenced by number of co-authors per paper, which varied widely across disciplines. Humanities were dominated by single-author publications, whereas the majority of publications in sciences were co-authored.
Computer Science showed the most rapid increase in productivity, followed by history, which reflect the rapid advances in computer-based technology and growing importance of Korean history respectively. In addition, results also showed humanities to take longer to be fully cited than sciences, thus highlighting major variations in citation lag time. The study also revealed even distribution of core authors among institutions in library and information science in contrast to concentrations of core authors in core institutions in history and computer science, thereby illustrating the differences in distribution and impact of core authors and institutions across disciplines.
The study findings by no means paint a comprehensive picture of differences in research output
among disciplines. By focusing on bibliometric analysis of journal article data, which is the main
staple of research performance assessment, the study demonstrated how publication patterns differ
across disciplines. The findings of the study therefore should assist those who seek adaptation
of current research evaluation standards to accommodate disciplinary differences. The follow-up
study that will examine Web of Science data in a similar fashion would further inform researchers
to better understand publication pattern differences not only among disciplines but also between
domestic and international research.
Biology Computer Science History
<Fig. 11a> Significant Keyword Clusters: Biology, Computer Science, History
Philosophy Library & Information Science Sociology
<Fig. 11b> Significant Keyword Clusters: Philosophy, Library & Information Science, Sociology
References
김기형, 설성수. 2015. 이공계 분야별 연구생산성 분석. 한국기술혁신학회지, 18(1): 98-125.
김왕준, 윤홍주, 나민주. 2012. 국립대학 교수업적평가 관련규정 비교분석. 한국교원교육학회, 29(1): 143-165.
신다예, 양기덕. 2017. 국내 학술논문의 동명이인 저자명 식별을 위한 방법. 한국비블리아학 회지, 28(4): 301-319.
양기덕, 이종욱, 최원찬. 2015. “Looking Beyond the Numbers: Bibliometric Approach to Analysis of LIS Research in Korea.” 한국문헌정보학회지, 49(4): 241-264.
이재윤. 2006. 연구성과 측정을 위한 h-지수의 개량에 관한 연구. 정보관리학회지, 23(3): 167-186.
이재윤, 정은경. 2014. 저자동시인용분석을 위한 복수저자 기여도 산정 방식의 비교 분석. 정 보관리학회지, 31(2): 57-77.
이종욱, 양기덕. 2011. 교수연구업적 평가법의 계량적 분석: 국내 문헌정보학과 교수연구업적 을 중심으로. 정보관리학회지, 50(2): 191-214.
이혜경, 양기덕. 2015. 국내대학의 학술논문 공동연구 기여도 산정 기준 비교 분석. 한국도서 관정보학회지, 46(4): 191-205.
이혜경, 양기덕. 2017. 국내대학의 학술논문 연구업적평가기준 비교 분석. 한국도서관정보학 회지, 48(2): 295-322.
이혜경, 양기덕, 김선욱. 2019. 국내 문헌정보학 분야의 공동연구 동향 분석한국도서관정보학 회지, 48(2): 295-322.
정연경, 최윤경. 2011. 인문.사회과학 분야 교수의 연구업적물 평가에 관한 연구. 정보관리연 구, 42(3): 211-233.
황유나, 김규태. 2014. 네트워크 분석을 이용한 국내외 대학의 학문분야 비교 분석. 비교교육 연구, 24(3): 227-244.
Broadus, R.N. 1971. “The literature of the social sciences: A survey of citation studies.”
International Social Science Journal, 13(2): 236-243.
Budd, J. 1986. “Characteristics of written scholarship in American literature: A citation study.”
Library & Information Science Research, 8: 189-211.
Chung, Y. K. 1995. “Characteristics of references in international classification systems literature.”
The Library Quarterly, 65(2): 200-215.
Chung, Y. K. and Choi, Y. K. 2011. “A study on faculty evaluation of research achievements in humanities and social sciences.” Journal of Information management, 42(3): 211-233.
Glanzel, W. and Schoepflin, U. 1999. “A bibliometric study of reference literature in the sciences
and social sciences.” Information Processing and Management, 35(3): 31-44.
Hammarfelt, B. 2016. Beyond coverage: Toward a bibliometrics for the humanities. In Research assessment in the humanities (pp. 115-131). Springer, Cham.
Heinzkill, R. 1980. “Characteristics of references in selected scholarly English literary journals.”
Library Quarterly, 50(3): 352-365.
Hicks, D. 2004. The four literatures of social science. In Handbook of quantitative science and technology research (pp. 473-496). Springer, Dordrecht.
Huang, M. H. and Chang, Y. W. 2008. “Characteristics of research output in social sciences and humanities: From a research evaluation perspective.” Journal of the American Society for
Information Science and Technology, 59(11): 1819-1828.
Hwang, Y. N. and Kim, G. T. 2014. “Comparative study on main research area of national and international universities using network analysis.” Korean Journal of Comparative
Education, 24(3): 227-244.
Kim, K. H. and Seol, S. S. 2015. “An Analysis of Research Productivity by Fields in Science and Engineering.” Journal of Korea Technology Innovation Society, 18(1): 98-125.
Kim, W. J., Yun, H. J. and Rah, M. J. 2012. “A comparative analysis of faculty evaluation systems of national universities in Korea.” The Journal of Korean Teacher Education, 29(1): 143-165.
Knievel, J. E. and Kellsey, C. 2005. “Citation analysis for collection development: A comparative study of eight humanities fields.” The Library Quarterly, 75(2): 142-168.
Lee, H. and Yang, K. 2015. “Comparative analysis of Korean universities’ Co-author credit allocation standards on journal publications.” Journal of Korean Library and Information
Science Society, 46(4): 191-205.
Lee, H. K. and Yang, K. 2017. “Comparative analysis of Korean universities’ journal publication research performance evaluation standards.” Journal of the Korean Library and
information Society, 48(2): 295-322.
Lee, H. K., Yang, K. and Kim, S. W. 2019. “Analysis of collaborative research trends in library and information science in Korea.” Journal of the Korean Library and information
Society, 48(2): 295-322.
Lee, J. W. and Yang, K. 2011. “A bibliometric analysis of faculty research performance assessment methods.” Journal of the Korean Society for information Management, 50(2): 191-214.
Lee, J. Y. 2006. “Some improvements on h-index: Measuring research outputs by citations.”
Journal of the Korean Society for information Management, 23(3): 167-186.
Lee, J. Y. and Chung, E. 2014. “A comparative analysis on multiple authorship counting for
author co-citation analysis.” Journal of the Korean Society for information Management, 31(2): 57-77.
Min, T. S., Kim, S. Y., Park, S. H. and Han, I. K. 2006. “A Comparison Study on Characteristics of Research Output in Life Sciences and Other Sciences Through Analysis of KOSEF´
s Database.” Journal of animal science and technology, 48(1): 131-136.
Nederhof, A. J. 2006. “Bibliometric monitoring of research performance in the social sciences and the humanities: A review.” Scientometrics, 66(1): 81-100.
Ochsner, M., Hug, S. and Galleron, I. 2017. “The future of research assessment in the humanities:
bottom-up assessment procedures.” Palgrave Communications, 3, 17020.
Reingold, E. M. and Tilford, J. S. 1981. “Tidier drawings of trees.” IEEE Transactions on
software Engineering, 2, 223-228.
Robinson, W.C. and Poston, P.E. 2004. “Literature use by U.S. economists published in 1999: An exploratory study.” Behavioral and Social Science Libraries, 22(2): 53-65.
Schaffer, T. 2004. “Psychology citations revisited: Behavioral research in the age of electronic resources.” Journal of Academic Librarianship, 30(5): 354-360.
Shin, D. and Yang, K. 2017. “A Method for Same Author Name Disambiguation in Domestic Academic Papers.” Journal of Korean Biblia Society for Library and Information Science, 28(4): 301-319.
Tanner, S. 2016. An analysis of the Arts and Humanities submitted research outputs to REF 2014
with a focus on academic books. <https://academicbookfuture.files.wordpress.com/2016/11
/abof_academic-books-ref2014-report_simon-tanner.pdf> [cited 2019.04.19].Thompson, J.W. 2002. “The death of the scholarly monograph in the humanities? Citation patterns in literary scholarship.” Libri, 52, 121-136.
Toledo, E. G. 2018. “Research assessment in Humanities and Social Sciences in review.” Revista
española de Documentación Científica, 41(3): 1-14.
Yang, K. and Lee, J. 2012. “Analysis of publication patterns in Korean library and information science research.” Scientometrics, 93(2): 233-251.
Yang, K., Lee, J. and Choi, W. 2015. “Looking Beyond the Numbers: Bibliometric Approach to Analysis of LIS Research in Korea.” Journal of the Korean Society for Library and
Information Science, 49(4): 241-264.
Yang, K., Lee, J. and Choi, W. 2016. “Publication and citation patterns of Korean LIS research by subject areas.” Malaysian Journal of Library & Information Science, 21(2): 67-81.
Yoon, H. Y. and Kim, S. Y. 2005. “An analysis on correlations between journal impact factor and research performance evaluation weight.” Journal of Information Management, 36(3): 1-25.