DOI: 10.5532/KJAFM.2013.15.4.298
ⓒ Author(s) 2013. CC Attribution 3.0 License.
방풍망 설치 과수원의 강풍피해 저감효과의 기상학적 분석
심교문·김민석·김용석·정명표·황 해·김석철*
국립농업과학원
(2013년 10월 21일 접수; 2013년 11월 11일 수정; 2013년 12월 20일 수락)
Meteorological Analysis of Installation Effects of a Windbreak Net on Reducing Wind Speed at An Apple Orchard
Kyo-Moon Shim, Min-Seok Kim, Yong-Seok Kim, Myung-Pyo Jung, Hae Hwang and Seok-Cheal Kim*
National Academy of Agricultural Science, RDA, Suwon, Korea
(Received October 21, 2013; Revised November 11, 2013; Accepted December 20, 2013)
ABSTRACT
In this study, the installation effects of a windbreak net on reducing wind speed were examined using meteorological observation data. Three automatic weather systems (AWS) were installed at the inside of the windbreak net of an apple orchard along the distance, and one AWS was located at the outside.
They were set up on Oct. 25th, 2012 at the apple orchard of Geochang County, and meteorological data, which were observed at four stations for about 1 year from October 26, 2012 through October 21, 2013, were used for this study. Meteorological variables include air temperature & relative humidity at a height of 1.5 meter, and wind speed & wind direction at a height of 2 meter and 4 meter.
These variables were measured and recorded every 60 seconds. The preliminary results of this study was as follows: (1) Daily mean temperature at the inside of the windbreak net was lower than that of the outside by 0.1 through 0.2oC. (2) Daily mean relative humidity at the inside of the windbreak net was higher than that of the outside by 0.7 through 1.7%. (3) As compared to the outside, northerly daily maximum wind speed of the inside of the windbreak net at a height of 2 and 4 meter was reduced by 0.7~1.5 ms−1 (30.4~65.2%) and 0.3~0.7 ms−1 (10.3~24.1%), respectively.
Key words : Apple orchard, Temperature, Relative humidity, Windbreak net, Wind speed
I. 서 론
태풍 ‘루사’(2002년), ‘매미’(2003년)에 의한 대규모 의 강풍피해가 발생한 후, 농작물과 농업시설의 강풍 피해를 줄이기 위한 방풍시설의 설치가 과수 재배지와 시설 재배지를 중심으로 증가하는 추세에 있다. 일정 풍속 이상의 바람이 과수원에 불 때, 성숙기 과실에 풍하중이 부가되어 낙과율이 증가하며, 시설하우스의
경우에는 양력으로 서까래가 뽑히는 시설피해가 발생 한다(Yum et al., 2011). 최근에는 태풍 ‘곤파스’
(2010. 9.1~2)의 내습(순간최대풍속 41.4m/s)으로, 비 닐하우스 721ha, 인삼재배시설 748ha 및 과수원 5,182ha의 피해가 발생했고(기상청, 2010), 2012년에 는 8~9월에 태풍 ‘볼라벤’, ‘덴빈’, ‘산바’가 내습하 여, 비닐하우스 1,776ha, 사과를 비롯한 농작물 315,781ha의 막대한 피해가 발생했다는 보고가 있다
* Corresponding Author : Seok-Cheal Kim ([email protected])
(기상청, 2013).
방풍망과 방풍림에 관련된 연구로는 방풍림 주위의 유동분포에 관한 연구(Green, 1992), 방풍시설의 설치 효과 및 최적 파이프 규격에 관한 연구(Yum et al., 2007), 풍동시험을 통한 방풍망의 풍속저감 효과에 관 한 연구(Yum et al., 2011) 등이 있다. 하지만, 국내 에서는 방풍망 선택과 설치시에 참고로 활용되는 기초 연구가 주로 수행되어서, 방풍시설의 풍속저감 효과뿐 만 아니라, 방풍시설이 작물의 생육환경에 미치는 영 향까지도 고려한 종합적인 현장 연구는 다소 미흡한 실정이다.
방풍망, 방풍림 등 여러 방풍시설은 긍정적인 효과 뿐만 아니라, 부정적인 측면도 있다고 알려져 있다.
긍정적인 효과에는 조풍해, 풍식해, 푄풍해, 강풍해 등 풍해 방지 효과와 온도 상승, 습도 상승, 증발산 감소, 토양수분 증가 등 작물기상환경의 개선 효과 등이 있 지만, 부정적인 측면으로는 그늘, 유휴지, 병해충 서식 처, 잡초의 번식, 양·수분의 경합, 작업능률의 저하, 약풍역에서의 야간 저온화, 설치 및 유지비용, 노동력 투입 등이 있다(김광식, 1983). 따라서, 방풍시설의 설 치가 농작물의 미치는 직·간접적인 영향을 종합적으 로 평가할 필요가 있다.
본 연구에서는 방풍망을 설치한 사과원 내부의 풍속 저감 효과뿐만 아니라, 사과의 생육에 영향을 주는 온 도, 습도 등 군락미기상 환경의 변화 특성도 함께 분 석하기 위해서, 2012년 태풍 ‘산바’의 내습 후인 10 월 25일에 경남 거창의 방풍망이 설치된 사과원의 주 변에 간이 자동기상관측장비를 설치하였고, 2013년 10 월 21일까지 약 1년에 걸쳐 수집된 기상자료를 분석 한 중간 연구결과를 보고하고자 한다.
II. 재료 및 방법
2.1. 연구대상 지역의 개요
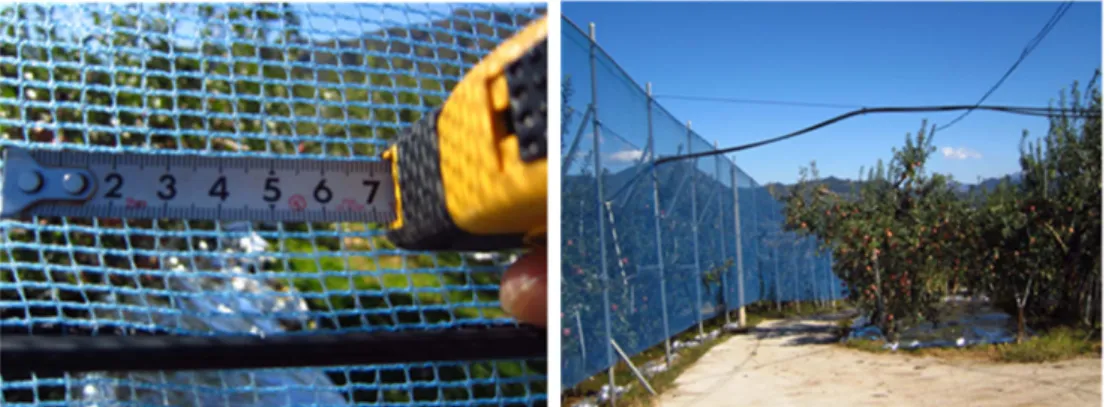
연구대상 지역은 경상남도 거창군 거창읍 가지리 794-5번지(35°42'46"N, 127°54'09"E)의 방풍망 설치 사과원이다(Fig. 1). 사과원의 면적은 약 18,150m2이 고, 이중 ‘후지’ 품종이 65%, ‘홍로’ 등 기타 품종 이 35% 차지하고 있다. 연구대상 사과원의 2012년 사과생산량은 72톤으로 단위면적(ha)당 생산량은 39.7 톤 이었다. 사과나무의 수령은 15~30년 범위이고, 수 고는 약 5m이며, 사과나무 재식거리는 평균적으로 4.5×2.5m이다. 연구대상 사과원은 2002년 태풍
‘루사’와 ‘매미’에 의한 강풍피해 발생 이후부터 사과 원 주변에 방풍망을 설치하였는데, 2012년 10월 현 재에는 총 설치 거리가 약 740m에 이른다. 방풍시 설의 높이는 5m이고, 방풍망 규격은 3×6mm로 조사 되었다(Fig. 2).
Fig. 1. Locations of 4 automated weather stations (AWS) installed at an apple orchard of Geochang County. WBN means windbreak net.
Fig. 2. View of windbreak net installed at an apple orchard of Geochang County.
2.2. 방풍시설 주변의 기상 관측
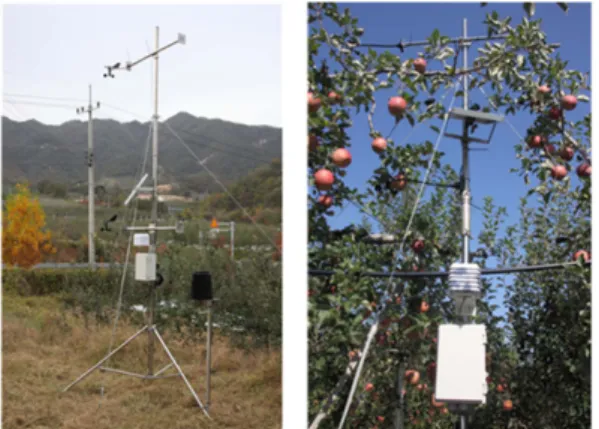
방풍시설에 따른 사과원 내부의 기상학적 변화를 분 석하기 위해서, 2012년 10월 25일에 방풍망 외부 1 개 지점[방풍망 외부 3m(A지점)]과 방풍망 내부 3개 지점[방풍망 인접(B지점), 방풍망 내부 10m(C지점), 방풍망 내부 20m(D지점)]에 온·습도, 풍향·속 센서 로 구성된 간이 자동기상관측시스템을 구축하고, 방풍 망 내·외부의 기상환경을 관측하였다. 기상자료의 관 측 및 관측 자료의 저장간격은 60초이고, 방풍망 외부 1지점(A지점)과 방풍망 내부 1지점(D지점)의 기상관측 자료는 CDMA 모뎀을 통한 TCP/IP 방식으로 매 10 분마다 웹서버로 전송되었다(http://weather.stacorp.
co.kr/index.asp). 나머지 방풍망 내부 2지점(B, C지점)의 관측 자료는 2~4주 간격으로 현장 방문을 통해 직접 수집하였다. 풍향과 풍속센서는 2m와 4m의 2개 높이 에 설치하였고, 온도와 습도센서는 지상 1.5m 높이에 설치하여 관측하였다(Fig. 3).
III. 결과 및 고찰
3.1. 방풍망 설치 사과원 주변의 온도 특성
방풍망 내부의 3개 조사지점들(B~D)의 분석기간 동 안(2012. 10. 26~2013. 10. 21)의 일평균기온의 평균 은 11.3~11.4oC 범위로 같은 기간의 방풍망 외부 조 사지점(A지점)의 일평균기온의 평균(11.5oC)보다 0.1~0.2oC 낮은 것으로 분석되었다. 반면에, 방풍망 내 부의 3개 조사지점들의 일최고기온 및 일최저기온의 평균은 각각 18.6~19.1oC 및 5.6~5.9oC 범위로 방풍
망 외부 조사지점의 일최고기온의 평균(19.0oC) 및 일 최저기온의 평균(5.7oC)보다 낮거나 조금 높은 것으로 조사되었다(Table 1). 문헌에 따르면(김광식, 1983), 방풍시설 내부는 온도상승과 약풍역에서의 야간 저온 효과를 나타낸다고 하였는데, 본 연구에서는 방풍망 설치로 방풍망 내부의 일평균기온은 조금 낮아졌지만, 일최고 및 최저기온은 뚜렷한 차이를 발견할 수가 없 었다. 따라서 태풍 등 강풍이 발생했을 때와 서리가 발생했을 때의 사례연구를 통한 추가적인 정밀 분석이 필요하다.
3.2. 방풍망 설치 사과원 주변의 습도 특성
방풍망 내부 3개 조사지점들의 분석기간 동안(2012.
10. 26~2013. 10. 21)의 일평균습도의 평균은 74.7~
75.7% 범위로 같은 기간의 방풍망 외부 조사지점의 일평균습도의 평균(74.0%)보다 0.7~1.7% 높은 것으로 조사되었다. 또한, 방풍망 내부 3개 조사지점들의 일최 소습도의 평균도 45.3~46.0% 범위로 방풍망 외부 조 사지점의 일최소습도의 평균인 44.3%보다 1.0~1.7%
높은 것으로 분석되었다(Table 2). 그리고 방풍망 내 부의 3개 조사지점들에 대해서, 분석기간 동안에 상대 습도가 100%인 시간들의 합은 총 948.6~1092.3시간 범위로 방풍망 외부 조사지점의 606.0시간보다 342.6~486.3시간 더 긴 것으로 조사되었다. 따라서, 방풍망을 설치할 경우에는 사과원 내부의 습도를 다소 높이는 효과가 있는 것으로 판단되며, 이는 사과원의 Fig. 3. View of automated weather station installed at the
outside (left fig., A station) and inside (right fig., D station) of windbreak net.
Table 1. Temperature around the outside and inside of windbreak net at an apple orchard (2012. 10. 26~2013. 10. 21)
Temperature (oC)
Outside (A)
Inside (B) (C) (D) Mean 11.5 11.4 11.4 11.3 Maximum 19.0 18.6 19.1 18.7 Minimum 5.7 5.9 5.6 5.6
Table 2. Relative humidity around the outside and inside of windbreak net at an apple orchard (2012. 10. 26~2013. 10. 21)
Relative humidity (%)
Outside (A)
Inside (B) (C) (D) Mean 74.0 75.6 75.7 74.7 Maximum 94.9 95.7 95.8 95.5 Minimum 44.3 46.0 45.3 45.9
병 발생을 증가시키는 원인으로 작용할 것이다.
3.3. 방풍망 설치 사과원 주변의 바람 특성
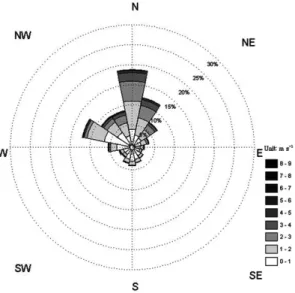
방풍망 외부 지점의 4m 높이에서 관측된 기상자료 중에서 풍속이 0.4ms−1 이상의 풍향자료들을 선택하여 4개 방위(북풍, 동풍, 남풍, 서풍)로 구분하여 빈도분석 을 하였을 때, 북풍계열(315~45°)이 47.2%로 가장 빈도가 높았고, 다음으로 서풍계열(225~315°)이 26.6%이었으며, 남풍계열(135~225°)과 동풍계열 (45~135°)의 바람은 각각 14.0%, 12.2%로 빈도가 상 대적으로 낮았다(Fig. 4).
3.3.1. 북풍계열 바람의 풍속 특성
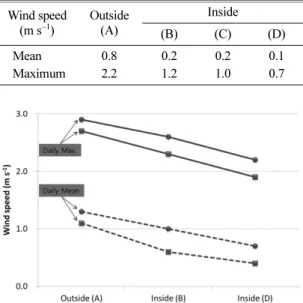
방풍망 내부 2개 조사지점들(B, D)의 4m 높이에 서, 북풍계열 바람의 일평균풍속의 평균은 0.7~1.0ms−1 범위로, 방풍망 외부 조사지점(A)의 일평균풍속의 평 균(1.3ms−1)보다 0.3~0.6ms−1 감속된 것으로 조사되 었다. 또한, 같은 높이(4 m)에서 관측된 방풍망 내부 2개 조사지점들의 일최대풍속의 평균도 2.2~2.6ms−1 범위로 방풍망 외부 조사지점의 일최대풍속의 평균인 2.9ms−1보다 0.3~0.7ms−1 감속된 것으로 분석되었다 (Table 3).
2m 높이에서 관측된 방풍망 내부 3개 조사지점(B, C, D)의 북풍계열 바람은 일평균풍속의 평균이 0.2~0.5ms−1 범위로, 방풍망 외부 조사지점의 일평균풍
속(0.9ms−1)보다 0.4~0.7ms−1 감속된 것으로 조사되었 고, 같은 높이(2m)에서 관측된 방풍망 내부 3개 조사 지점의 일최대풍속의 평균도 0.8~1.6ms−1범위로 방풍 망 외부 조사지점의 일최대풍속의 평균인 2.3ms−1보다 0.7~1.5ms−1감속된 것으로 분석되었다(Table 4).
3.3.2. 서풍계열 바람의 풍속 특성
방풍망 내부 2개 조사지점들의 4m 높이에서, 서풍 계열 바람의 일평균풍속의 평균은 0.4~0.6ms−1 범위 로, 방풍망 외부 조사지점의 일평균풍속의 평균 (1.1ms−1)보다 0.5~0.7ms−1 감속된 것으로 조사되었다 . 또한, 같은 높이(4m)에서 관측된 방풍망 내부 2개 조사지점들의 일최대풍속의 평균도 1.9~2.3ms−1 범위 로 방풍망 외부 조사지점의 일최대풍속의 평균인 2.7ms−1보다 0.4~0.8ms−1 감속된 것으로 분석되었다 (Table 5).
2m 높이에서 관측된 방풍망 내부 3개 조사지점(B, C, D)의 서풍계열 바람은 일평균풍속의 평균이 0.1~0.2ms−1범위로, 방풍망 외부 조사지점(A)의 평균 Fig. 4. Wind frequency and wind speed by direction at the
outside (A station) of windbreak net.
Table 3. Northerly wind speed around the outside and inside of windbreak net at a height of 4 meter of an apple orchard (2012. 10. 26~2013. 10. 21)
Wind speed (m s−1)
Outside (A)
Inside (B) (D)
Mean 1.3 1.0 0.7
Maximum 2.9 2.6 2.2
Table 4. Northerly wind speed around the outside and inside of windbreak net at a height of 2 meter of an apple orchard (2012. 10. 26~2013. 10. 21)
Wind speed (m s-1)
Outside (A)
Inside (B) (C) (D)
Mean 0.9 0.5 0.3 0.2
Maximum 2.3 1.6 1.3 0.8
Table 5. Westerly wind speed around the outside and inside of windbreak net at a height of 4 meter of an apple orchard (2012. 10. 26~2013. 10. 21)
Wind speed (m s−1)
Outside (A)
Inside
(B) (D)
Mean 1.1 0.6 0.4
Maximum 2.7 2.3 1.9
풍속(0.8ms−1)보다 0.6~0.7ms−1 감속된 것으로 조사되 었고, 같은 높이(2m)에서 관측된 방풍망 내부 3개 조 사지점의 일최대풍속의 평균도 0.7~1.2ms−1 범위로 방 풍망 외부 조사지점(A)의 일최대풍속의 평균인 2.2 ms−1보다 1.0~1.5ms−1 감속된 것으로 분석되었다 (Table 6).
4m와 2m 높이에서 관측된 북풍과 서풍계열의 바람 은 방풍망으로부터 사과원 내부로 멀리 떨어질수록 풍
속 저감 효과가 큰 것으로 분석되었다(Fig 5, 6). 풍 향에 따른 감풍정도는 북풍계열보다 서풍계열의 바람 이 불때 더 큰 것으로 조사되었는데, 이는 방풍망으로 부터 각 조사지점까지의 바람의 이동거리가 서풍계열 의 바람일때 더 길었고, 이에 따라 사과원 군락층에 의한 감풍효과가 서풍계열의 바람에서 더 크게 나타났 기 때문으로 추정되었다.
3.4. 추가 연구의 필요성
본 연구에 활용한 약 1년간의 기상 분석자료에는 태풍, 돌풍 등 강풍 현상이 포함되지 못해서(연구기간 동안에 강풍현상이 나타나지 않았음), 방풍망 설치 사 과원의 강풍에 따른 풍속저감 효과를 구명하기에는 부 족하다. 따라서 강풍 현상이 발생했을때의 사례분석이 추가적으로 요구된다. 또한, 방풍망 설치 사과원 군락 층의 온도와 습도의 변화도 주·야간으로 구분하거나 풍속에 따라 구분하여 추가적인 정밀 분석이 필요하며, 방풍망으로부터 거리에 따른 감풍효과를 구명할 때에 는 사과원 군락층에 의한 영향도 함께 밝혀내야 할 것이다.
적 요
본 연구는 방풍망이 설치된 사과원 주변에 자동기상 관측장비를 설치하고, 이로부터 수집한 온·습도와 풍 속 등 기상 관측자료를 분석하여, 방풍망을 설치한 사 과원 내부의 풍속저감 효과와 군락미기상의 변화 등의 기상학적 특성을 평가하고자 수행하였다. 2012년 10월 26일부터 2013년 10월 21일까지 약 1년간 수집한 기 상자료를 토대로 분석한 결과는 다음과 같다. (1) 방 풍망 내부의 일평균기온은 외부보다 0.1~0.2oC 낮았고, (2) 방풍망 내부의 일평균습도는 외부보다 0.7~1.7%
범위로 높았으며, (3) 북풍계열 바람의 방풍망 내부의 일최대풍속은 외부보다 2m와 4m의 높이에서 각각 0.7~1.5ms−1(30.4~65.2%)와 0.3~0.7ms−1(10.3~24.1%) 범 위로 감풍되는 것으로 조사되었다.
감사의 글
본 연구는 농촌진흥청 국립농업과학원 농업과학기술 연구개발사업(과제번호:PJ00852202)의 지원에 의해 이 루어진 것임
Table 6. Westerly wind speed around the outside and inside of windbreak net at a height of 2 meter of an apple orchard (2012. 10. 26~2013. 10. 21)
Wind speed (m s−1)
Outside (A)
Inside (B) (C) (D)
Mean 0.8 0.2 0.2 0.1
Maximum 2.2 1.2 1.0 0.7
Fig. 5. Changes of the wind speed at the outside and inside of windbreak net with a height of 4 meter of an apple orchard. Circle and rectangle mean northerly and westerly wind speed, respectively.
Fig. 6. Changes of the wind speed at the outside and inside of windbreak net with a height of 2 meter of an apple orchard. Circle and rectangle mean northerly and westerly wind speed, respectively.
REFERENCES
Green, S. R., 1992: Modeling turbulent air flow in a stand of widely-spaced trees. The PHOENICS Journal of Computational Fluid Dynamics and its applications 5(1), 294-307.
Yum, S. H., S. H. Kang, S. H. Kim, S. B. Lee and M. Y.
Kim, 2011: Effects of an anti-wind net on wind velocity reduction by a wind tunnel test and CFD. Journal of
Biosystems Engineering 36(5), 355-360. (in Korean with English abstract)
Yum, S. H., K. J. Kwon, S. H. Sung and Y. D. Choi, 2007:
The installation effect and optimal pipe sizes of an anti- wind net by computational analysis. Journal of Biosystems Engineering 32(6), 430-439. (in Korean with English abstract)
기상청, 2010: 2010 이상기후 특별보고서. 114pp.
기상청, 2013: 2012년 이상기후 보고서. 148pp.
김광식, 1983: 증보 농업기상학. 향문사, 367pp.