856
Copyright © 2016 The Korean Society of Fisheries and Aquatic Science pISSN:0374-8111, eISSN:2287-8815
서 론
수산생물의분포및현존량을평가하기위해서는어구
,
잠수 및카메라,
음향방법을이용하고있다.
어구조사는종명확성 은알수있지만많은조사정점을수행하기위해서는비용과시 간이소요되며,
잠수및카메라조사는해수의탁도의영향을받 아깊은수심과시야가좋지못하는곳에서는조사가어렵다.
음 향은짧은시간에넓은해역의전수층의정보를취득할수있어 수산생물의자원분포를평가하기유용하다(Kang et al., 2008;
Hwang et al., 2004; Lee et al., 2015).
음향을이용하여수산생물의분포및현존량을추정하는기 법에는에코계수법
(echo counting)
과에코적분법(echo inte-
gration)
이있다.
에코계수법은수산생물이다른생물과분리된개체로존재할때계측이가능하고
,
탐지된에코를하나하나 계수하는방법이다.
일반적으로이방법은수산생물이한개체 로존재하는것이아니라군을이루거나다른생물과혼재되어 있는곳에서는적용하기어렵다.
에코적분법은중첩되는수산 생물의신호를받아적분하여현존량을계산하는것으로집단을이루고있는어류및동물플랑크톤의수산생물에적용되었 다
(Simmonds and MacLennan, 2005).
우리나라에서도음향을이용하여해양에서서식하는수산생 물을계측하기위해서는대부분에코적분법을이용하고있다
.
하지만,
에코적분법을적용하기위해서는대상생물의종식별 이필요하다.
모든대상종을식별하기위해서는다중주파수가 필요하나(Hone and Jeck, 1999),
일반적으로어류와동물플랑 크톤은2
주파수차이방법을이용하면어류와동물플랑크톤은 구분이가능하다(Miyashita et al., 1997; Kang, 2002; Kloser et al., 2002; McKelvey and Wilson, 2006; Kim et al., 2013; Lee et al., 2014).
하지만,
국내연안조사시에선박의현측에고정 장치를이용한센서설치할때음향장비설치안정성및전원공급문제등으로인하여단일주파수를사용한다
(Lee et al.,
2012; Hwang et al., 2015).
단일주파수를이용하여어류를식 별하기위해서는역치값(threshold modification)
조정방법을 사용하고, Kang et al. (2012)
는시간변량역치방법을이용하 여어류와동물플랑크톤을구분할수있는방법을제시하였다.
본연구에서는우리나라에서사용하는음향자료분석방법음향산란층의 식별을 위한 에코그램 분석 방법의 비교
최석관·윤은아
1*·한인우
1·오우석
1국립수산과학원 원양자원과, 1전남대학교 수산과학과
Comparison of Echogram Analysis Methods for Evaluating the Sound-scattering Layer
Seok-Gwan Choi, Eun-A Yoon
1
*, Inwoo Han1
and Wooseok Oh1
Distant Water Fisheries Resources Research Division, National Institute of Fisheries Science, Busan 46083, Korea
1
Department of Fisheries Science, Chonnam National University, Yeosu 59626, Korea
This study compared the density of fish determined using three different echogram methods: the frequency-differ- ence, time variable, and threshold modification methods. An acoustic survey was conducted off the coast of Jeju Island after sunset. Data at 38 and 120 kHz frequencies were collected using a commercial fishing vessel. As a refer- ence point, the value of ∆MVBS
120-38kHzthat distinguished fish from zooplankton using the 38 and 120 kHz frequen- cies was set at < 2 dB. The estimated density of fish along the survey line was 0.1-30.4, 0.1-64.3, and 0.1-51.7 m
2/ nmi
2using the frequency difference, time variable threshold, and threshold modification methods, respectively. The results of this study constitute basic research for estimating fish densities.
Key words: Acoustic survey, Frequency difference method, Time variable threshold method, Threshold modification method
This is an Open Access article distributed under the terms of the Creative Commons Attribution Non-Commercial Licens (http://creativecommons.org/licenses/by-nc/3.0/) which permits unrestricted non-commercial use, distribution, and reproduction in any medium, provided the original work is properly cited.
http://dx.doi.org/10.5657/KFAS.2016.0856 Korean J Fish Aquat Sci 49(6) 856-861, December 2016
Received 15 November 2016; Revised 21 November 2016; Accepted 21 November 2016
*Corresponding author: Tel: +82. 61. 659. 7126 Fax: +82. 61. 659. 7129
E-mail address: [email protected]
음향산란층의 식별을 위한 에코그램 분석 방법 비교
857
가운데주파수
38
과120 kHz
의2
주파수를이용한주파수차이 방법,
단일주파수를이용한시간변량역치방법,
역치조정방 법으로추출한어류의밀도를비교하고자하였다.
재료 및 방법
음향 자료 수집
본조사는야간시기우리나라제주도연안해역에서상업어 선을이용하여음향자료를획득하였다
.
음향시스템은과학어 군탐지기split beam
방식의주파수38 kHz
와120 kHz
를사용하였고
(EK60, Simrad),
조사선박의현측에고정장치를이용하여수심
1 m
에고정하였다.
주파수38
과120 kHz
음향자료 는핑간격을1 ping/s,
펄스길이를0.512 ms
로설정하였고,
선속을
6-7
노트로유지하면서DGPS
수신기로부터위치정보를수신하여과학어군탐지기의시스템에입력하며수집하였다
. 음향 자료 분석
수집된 음향자료는 음향처리 소프트웨어
(Echoview V 4.7,
Myriax)
를이용하여분석하였다.
본조사해역의최대수심이150 m
이상으로,
깊은수심과어선을이용한음향조사시의안정되지못한환경적요인으로음향자료내잡음이포함되었다
.
먼저,
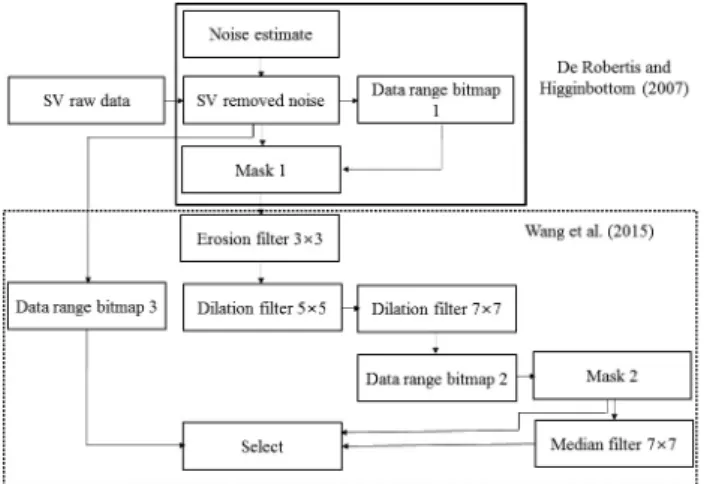
잡음을제거하기위하여De Robertis and Higginbottom (2007)
와Wang et al. (2015)
의방법을사용하였다.
잡음을제 거하는흐름도와에코그램의처리과정을Fig. 1
에나타내었다.
배경잡음을제거하기위하여TVT (Time varied threshold)
를 이용하는데이것은인위적으로배경잡음을만들어raw data
에 서인위적으로만든잡음을가감한다.
이와같은처리후에도잡 음은존재하기때문에다음으로data range bitmap
의기능을이 용하여대상에코의최소체적산란강도(Volume Backscatter- ing Strength, SV)
보다작고,
최대SV
보다큰잡음을소거한후mask
를작성한다(De Robertis and Higginbottom, 2007).
여기 서, data range bitmap
의범위에설정되는값은생물은참값으 로설정되고,
그외의값은거짓으로취급한다.
위의과정을거 친후에도남아있는잡음은erosion filter 3×3
기능을사용하였 고, erosion filter
기능은주변의셀자료가운데최소값으로변경되는것으로잡음의주변셀들의값이
–999 dB
이므로잡음이사라진다
.
이기능으로남아있는잡음은제거되지만에코가 약해지고,
원래존재하는빈공간으로에코의형태가손상될수 있다. dilation filter
기능은주변의셀자료가운데최대값으로 변경되는것으로셀의범위를5×5
와7×7
을연속적으로사용 하여에코의빈공간을채운다.
그후에dilation filter 7×7
기능 이적용된에코그램에data range bitmap
기능으로대상에코의SV
범위를설정하여mask
를생성한다.
마지막으로주변의셀자료가운데중간값으로변경되는기능을하는
median 7×7
을이용한후
select
연산자를이용하여이전의mask
와median 7×7
에서선택된에코와잡음이제거된SV
에코그램에서대상에코의범위를설정한
data range bitmap
을생성한후,
선택하 여잡음이완전히제거되어대상에코의에코를취득할수있다(Wang et al., 2015).
Fig. 1
의 방법으로 잡음 제거한 후 주파수 차이방법(fre-
quency difference method),
시간변량역치방법(time variable threshold method),
역치 조정 방법(threshold modification
method)
인3
가지방법을이용하여어류의분포밀도를파악하였다
. 3
가지방법모두기본적으로해수면부근과해저면및그 밖의배경잡음을필터처리하였다.
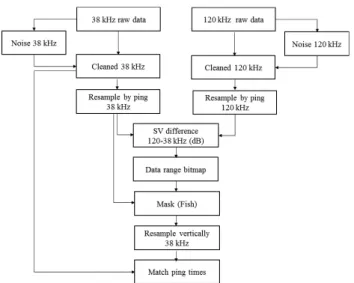
첫번째방법인주파수차이방법은
38 kHz
와120 kHz
의두주파수평균체적후방산란강도
(Mean Volume Backscattering Strength, MVBS)
의차이를 나타내는것이다.
본연구에서는주파수차이를알아보기위한 셀의크기가로×
세로를5 ping×1 m
로나누었다.
대상생물의 주파수차이가명확해지면그값의범위를설정하여data range bitmap
을만들어이범위에설정된에코와주파수38 kHz
의셀 크기와매치되는에코그램을mask
로만들고,
이것을다시핑간격으로나누어노이즈가제거된
38 kHz
에코그램과일치되는에코그램을대상생물의에코그램으로간주한다
.
위의방법 으로처리하게되면대상생물의에코만을추출하여대상생물 을명확히식별할수있다(Fig. 2).
두번째방법인시간변량역치방법은단일주파수를이용하 여어류와동물플랑크톤을식별할수있다
(Kang, 2012).
이방 법은dilation filter 7×7
기능을이용하여선택하고자하는에 코의크기를증폭시켜대상생물로판단되는에코의범위를선 택하여이값을원래에코그램과연결하여대상생물의에코만 추출하여새로운에코그램을만들어낸다(Fig. 3).
세번째방법인역치값을이용한방법은일반적으로단일주 파수에서많이사용하는방법으로대상생물로판단되는범위 를역치값으로조정한다
.
3
가지방법의raw
자료는SV
값을–80~–30 dB
로설정하여 Fig. 1. Flow diagram for noise removal using acoustic analyze software algorithms.잡음을제거하였고
,
주파수차이방법은위의설정으로어류와 동물플랑크톤을분리하였으며, TVT
방법과역치조정방법은–60~-30 dB
로어류의에코를추출하였다.
이값으로추출된에코를
0.5 n.mile
의EDSU (Elementary Distance Sampling
Unit)
간격으로적분하여추출된해리당면적산란계수(Nauti-
cal Area Scattering Coefficient, NASC, m
2/n.mile
2)
값으로나 타내었다.
통계분석
본연구에서는위의
3
가지주파수차이방법,
시간변량역치방법
,
역치조정방법을이용하여추출한어류의분포밀도차 이를파악하기위하여각방법의상관성및유의성평가는통 계분석프로그램(SPSS ver. 21.0, IBM)
의t-test
를이용하여검 증하였다.
결과 및 고찰
Fig. 4
는수집된주파수38
과120 kHz
의raw
에코그램과잡음 이제거한에코그램을비교하여나타내었다. Fig. 4
에서보는바 와같이주파수38
과120 kHz
는잡음이포함되어져있고,
특히 주파수120 kHz
에는잡음이강하게나타났다. De Robertis and Higginbottom (2007)
와Wang et al. (2015)
의방법을사용하여 Fig. 2. Data process flow for discriminating fish using dB differ-ence method at 38 and 120 kHz.
Fig. 3. Data process flow for discriminating fish using TVT meth- od at 38 kHz (Kang, 2012).
Fig. 4. Comparison of noise removal and raw echograms.
음향산란층의 식별을 위한 에코그램 분석 방법 비교
859
잡음을제거한결과잡음은제거되는것을알수있었다
.
일반적 으로음향자료를수집하는동안배경잡음뿐만아니라조사시 의환경즉해상날씨,
사용장비의전기잡음,
선박운항잡음이 포함된다.
따라서,
대상생물의신호를추출하기위해서는잡음 을제거하는것이자료처리과정에중요하다. Park et al. (2015)
및Lee et al. (2015)
도음향자료를포함되어있는잡음을제거 하는과정을소개하였고,
잡음제거후대상생물의SV
는약1
dB
이하로낮아지는경향을보였으나에코의형태는손상없이잡음만제거되었다
.
본조사는야간에수행되어어류가군을형성하는것이아니 라동물플랑크톤과어류가혼재된에코특성을보였다
.
또한,
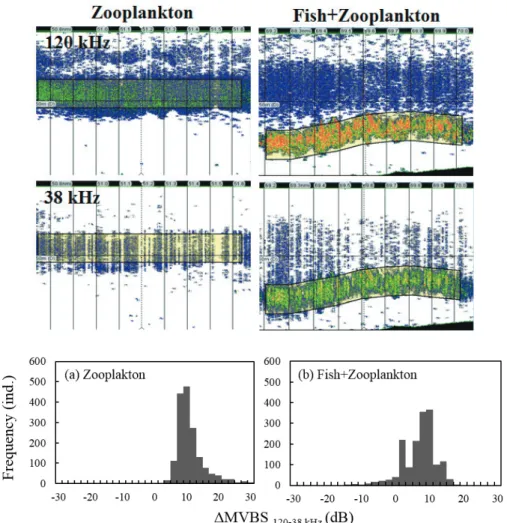
본 연구에서는샘플어구조사가이루어지지않아종명확성을알 수없기때문에어류를구분하기위한주파수차이범위를파악 하기위하여동물플랑크톤만구성된해역과어류와동물플랑크 톤이혼재되어있는해역에서주파수차이를알아보았다. Fig.
5
의에코그램에나타낸바와같이동물플랑크톤만구성된해역 은주파수120 kHz
와38 kHz
의주파수차이가크게나타나는Fig. 5. The dB-difference of section of only zooplankton and mixed zooplankton and fish using 38 and 120 kHz.
Fig. 6. Range of dB difference to identify zooplankton and fish.
반면동물플랑크톤과어류가혼재되어있는해역은주파수차 이가유사하거나크게나타났다
.
그결과동물플랑크톤으로구 성된해역의주파수차이는0-28 dB
범위를보였으며, 10 dB
에서최대빈도를나타내었다
.
어류와동물플랑크톤이혼재되어 있는해역의주파수차이는–14~18 dB
이었고, 2 dB
과10 dB
에 서최대빈도가나타났다.
동물플랑크톤으로구성된해역과어류와동물플랑크톤이혼 재되어있는해역의주파수차이를이용하여어류를구분할수
있는주파수차이범위를
Fig. 6
에나타내었다.
본조사해역에서식하는어류와동물플랑크톤은
∆MVBS
120-38kHz가2 dB
에서 명확히구분이되는것을알수있었다.
따라서,
어류와동물플랑크톤을구분하기위한
∆MVBS
120-38kHz는<2 dB
을기준으로 설정하였고,
이주파수차이를이용하여주파수38 kHz
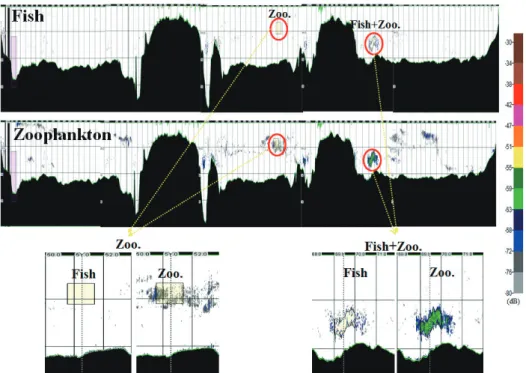
로어류 와동물플랑크톤을구분하였다(Fig. 6). Fig. 7
에서보는바와같 이동물플랑크톤으로형성된해역의에코그램에는어류는탐지 되지않았고,
동물플랑크톤에코신호만남았으며,
어류와동물 플랑크톤이혼재되어있는해역의에코그램은어류와동물플랑 크톤이분리되어지는것을알수있다.
주파수차이방법
,
시간변량역치방법,
역치조정방법을이 용하여추출한어류의면적산란계수를비교한결과를Fig. 8
에 나타내었다.
조사라인별어류의평균밀도는주파수차이방법 의경우0.1-30.4 m
2/nmi
2,
시간변량역치방법의경우0.1-64.3 m
2/nmi
2,
역치조정방법은0.1-51.7 m
2/nmi
2이었다.
각방법마 다의상관성을유의성의통계적검증은T-
검정을이용하였고,
주파수차이방법과시간변량역치방법및역치조정방법은 피어슨상관계수는각각0.230 (P>0.05), 0.232 (P>0.05)
으로 유의한차이가나타나지않았고,
시간변량역치방법과역치조 정방법은피어슨상관계수가0.999 (P<0.05)
으로유의한차이 가나타났다.
이와같이주파수차이방법과시간변량역치방 법및역치조정방법의유의한차이가나타나지않은것은시간 역치방법과역치조정방법은SV
로어류를구분하는것으로SV
는대상생물의개체수와초음파산란강도(Target strength, TS)
와관계한다. SV
는TS
가강한생물의개체수가작거나, TS
가약한생물의개체수가많아지면SV
는비슷하게나타나,
시 간변량역치방법과역치조정방법은동물플랑크톤이군집해 Fig. 7. Exampled of echograms to identify zooplankton and fish using ∆MVBS method.Fig. 8. Correlation relationship of mean NASC (m2/nmi2) by tran- sect lines using frequency difference method, time variable thresh- old method, and threshold modification method.
음향산란층의 식별을 위한 에코그램 분석 방법 비교
861
있는해역도
SV
값이강하게나타나므로어류로오인될가능성 이있다.
추후에단일주파수를이용하여야간에어류의밀도를 파악하기위해서는표본어구를사용하여어류와동물플랑크톤 과의구분이명확히이루어져야할것으로판단된다.
사 사
본 연구는
2016
년도 국립수산과학원 수산과학연구사업(R2016028)
의지원에의해수행되었으며,
현장조사수행에도 움을준전남대학교이경훈교수,
편용범님과본논문을사려깊 게검토하여주신심사위원님들과편집위원님께감사드립니 다.
References
De Robertis A and Higginbottom I. 2007. A post-processing technique to estimate the signal-to noise ratio and remove echosounder background noise. ICES J Mar Sci 64, 1282- 1291. https://dx.doi.org/10.1093/icesjms/fsm112.
Horne JK and Jech JM. 1999. Multi-frequency estimates of fish abundance: constraints of rather high frequencies.
ICES J Mar Sci 56, 184–199. https://dx.doi.org/10.1006/
jmsc.1998.0432.
Hwang BK, Lee YW, Jo HS, Oh JK and Kang MH. 2015. Vi- sual census and hydro-acoustic survey of demersal fish ag- gregations in Ulju small scale marine ranching area (MRA), Korea. J Kor Soc Fish Technol 51, 16-25. https://dx.doi.
org/10.3796/ksft.2015.51.1.016.
Hwang DJ, Park JS and Lee YW. 2004. Estimation of fish school abundance by using an echo sounder in an artifi- cial reef area. J Kor Fish Soc 37, 249-254. https://dx.doi.
org/10.5657/kfas.2004.37.3.249.
Kang DH, Im YJ, Lee CW, Yoo JT and Myoung JG. 2008. Hy- droacoustic survey of spatio-temporal distribution of demer- sal fish aggregations near the west coast of Jeju island, Ko- rea. Ocean and Polar Research 30, 181-191. https://dx.doi.
org/10.4217/opr.2008.30.2.181.
Kang MH. 2012. Acoustic method for discriminating plank- ton from fish in Lake Dom Helvecio of Brazil using a time varied threshold. J Kor Soc Fish Tech 48, 495-503. https://
dx.doi.org/10.3796/ksft.2012.48.4.495.
Kang, MH. Furusawa M and Miyashita K. 2002. Effective and accurate use of difference in mean volume backscattering strength to identify fish and plankton. ICES J Mar Sci 59, 794–804. https://dx.doi.org/10.1006/jmsc.2002.1229.
Kim JI, Hwang BK, Lee YW, Lee KH, Shin HO and Lim JN.
2013. Application of hydro-acoustic survey technique for abundance estimation of juvenile cod (Gadus macrocepha
lus) in Jinhae bay, Korea. J Kor Soc Fish Tech 49, 270-281.
https://dx.doi.org/10.3796/ksft.2012.49.3.270.
Lee HB, Choi SG, Lee KH, Lee JB, Lee JH and Choi JH. 2015.
A study on noise removal technique for acoustic data from a fishing boat. J Kor Soc Fish Technol 51, 340-347. https://
dx.doi.org/10.3796/ksft.2015.51.3.340.
Lee HB, Kang DH, Im YJ and Lee KH. 2014. Distribution and abundance of Japanese anchovy Engraulis japonicus and other fishes in Asan Bay, Korea, estimated hydroacoustic survey. Korean J Fish Aquat Sci 47, 671-681. https://dx.doi.
org/10.5657/kfas.2014.0671.
Lee HB, Seo YI, Oh TY, Choi JH, Jo HS and Choi KH. 2015.
Distribution of Demersal Fish Based on a Combined Acous- tic and Trawl Survey during Day and Night in Costal of the South Sea, Korea. Korea J Fish Aquat Sci 48, 798-804.
https://dx.doi.org/10.5657/kfas.2015.0798.
Lee JB, Oh TY, Yeon IJ, Kim BY, Shin HO, Hwang BK, Lee KH and Lee YW. 2012. Estimation of demersal fish biomass using hydroacoustic and catch data in the marine ranch- ing area (MRA) of Jeju. J Kor Soc Fish Tech 48, 128-136.
https://dx.doi.org/10.3796/ksft.2012.48.2.128.
McKelvey DR and Wilson CD. 2006. Discriminant classifica- tion of fish and zooplankton backscattering at 38 and 120 kHz. Transact American Fish Soc 135, 488-499. https://
dx.doi.org/10.1577/t04-140.1.
Miyashita, K, Aoki I, Seno K, Taki K and Ogishima T. 1997.
Acoustic identification of isada krill, Euphausia pacifica Hansen, off the Sanriku coast, north-eastern Japan. Fish Oceanogr 6, 266-271. https://dx.doi.org/10.1046/j.1365- 2419.1998.00042.x.
Park JS, Lee JH, Kim DN, Park YG, Jang CS, Park BS and Kang MH. 2015. Efficient eliminating methods of noises imbedded acoustic signals. J Kor Soc Fish Technol 51, 432- 440. https://dx.doi.org/ 10.3796/ksft.2015.51.3.432.
Simmonds J and MacLennan D. 2005. Fisheries acoustic theory and practice. Blackwell Science, Oxford, 176-202.
Wang X, Zhao X, and Zhang J. 2015. A noise removal algorithm for acoustic data with strong interference based on post-pro- cessing techniques. CCAMLR SG-ASAM-15/02: 11pp.