• 검색 결과가 없습니다.

The Impact of Innovation Activities on Firm Efficiency: Data Envelopment Analysis

N/A
N/A
Protected

Academic year: 2021

Share "The Impact of Innovation Activities on Firm Efficiency: Data Envelopment Analysis"

Copied!
10
0
0

로드 중.... (전체 텍스트 보기)

전체 글

(1)

Print ISSN: 2288-4637 / Online ISSN 2288-4645 doi:10.13106/jafeb.2021.vol8.no3.0895

The Impact of Innovation Activities on Firm Efficiency:

Data Envelopment Analysis*

Tien Phat PHAM 1 , Abdul QUDDUS 2

Received: August 20, 2020 Revised: January 26, 2021 Accepted: February 16, 2021

Abstract

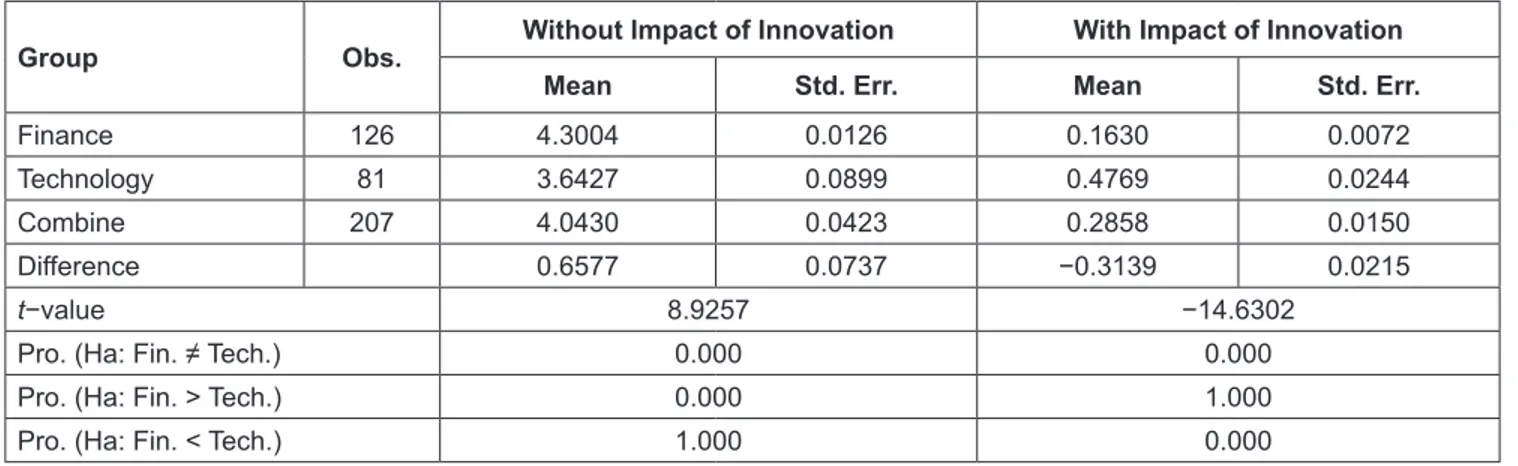
This study aims to investigate the impact of innovation on firm efficiency. Panel data of fourteen finance companies and nine technology companies from 2011 to 2019 on the Vietnam Stock Exchange Market is derived from audited financial statements, annual reports, and other crucial reports that are provided by Vietstock; macroeconomic variables are collected from the World Bank Database. A two-stage approach is used. First, use of the Data Envelopment Analysis methodology to measure firm efficiency. Second, use of the Pooled ordinary least squares, the Fixed effects model, and the Random effects model to investigate the impact of innovation on firm efficiency. Furthermore, the Generalized Method of Moments and the Tobit model are used to validate the impact of innovation on firm efficiency, and the t-test is used to confirm the difference in efficiency with and without the impact of innovation between two industries. The results show that there is a significant impact of innovation on efficiency, and innovation plays a more important in increasing the efficiency of the finance industry than the technology industry. Moreover, the relation between age and efficiency is like the U-shaped, and between size and efficiency is like the inverted U-shaped, whereas efficiency is not associated with inflation.

Keywords: Innovation, Firm Efficiency, Finance, Technology JEL Classification Code: O30, O32, D61

are the outcomes of the production function. The survey on scholarly literature of DEA from 1978 to 2016 that Emrouznejad and Yang (2018) carried out reveals that there were various DEA versions, which were modified to apply for different purposes by scholars. Many studies use DEA to estimate the efficiency and productivity, which are like the intermediate variables for other research objectives, for example, the studies by Cheruiyot (2017), Bremmera et al.

(2008), and Faruq and Yi (2010) about the determinant of firm efficiency.

Innovation plays the most important role for the growth of enterprises; it is the essential factor to increase competitiveness capability and increase firm efficiency in operation and productivity ( Gunday et al., 2011; Hall &

Bagchi-Sen, 2002). The topic of the impact of innovation on firm performance was explored by various scholars (Hall &

Bagchi-Sen, 2002; Gunday et al., 2008; Rosli & Sidek, 2013;

Artz et al., 2010). These studies missed the consideration of firm performance as the outcomes of the production function, thus we propose this research gap will be filled by this study.

Overall, this study aims to investigate the impact of innovation on firm performance, measured by the DEA approach.

*Acknowledgements:

1

This work is supported by Internal Grant Agency, project No.

IGA/FaME/2021/003 (Performance management, consumer behaviour, and sustainability of firms in a competitive digital world) of Tomas Bata University in Zlin, The Czech Republic.

1

First Author and Corresponding Author. [1] Ph.D. Student, Faculty of Management and Economics, Tomas Bata University in Zlin, The Czech Republic [2] Lecturer, College of Economics, Can Tho University, Vietnam [Postal address: Mostní 5139, Zlin, 760 01, The Czech Republic] Email: tien@utb.cz

2

Ph.D. Student, Faculty of Management and Economics, Tomas Bata University in Zlin, The Czech Republic. Email: quddus@utb.cz

© Copyright: The Author(s)

This is an Open Access article distributed under the terms of the Creative Commons Attribution Non-Commercial License (https://creativecommons.org/licenses/by-nc/4.0/) which permits unrestricted non-commercial use, distribution, and reproduction in any medium, provided the original work is properly cited.

1. Introduction

Data Envelopment Analysis (DEA) was first introduced

by Charnes et al. (1978). According to Google Scholar

(accessed on 2

nd

August 2020), the citations number of

the work of Charnes et al. (1978) reaches 35,806, it is a

huge citation. DEA has been popularly used to evaluate

firm performance via efficiency and productivity, which

(2)

2. Literature Review

2.1. The Determinant of Firm Efficiency

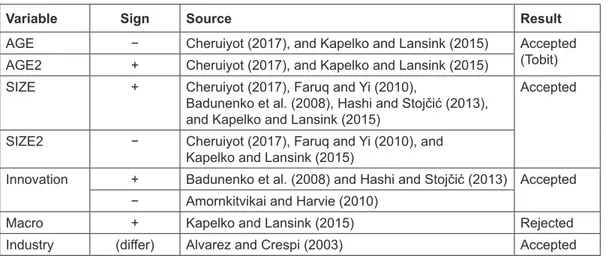
Cheruiyot (2017) used the data from the World Bank’s Regional Program for Enterprise Development Investment Climate Survey for Kenya in 2007 of 396 manufacturing firms in Kenya to determine the factor of firm efficiency.

The result showed that firm efficiency was impacted by firm age, firm age square, firm size, firm size square, firm location, and firm industry. The author also used the DEA to measure firm efficiency where the output was sales and the inputs were capital and labor. Because firm efficiency value is from 0 to 1, the Tobit model was used for robustness to check the factors of firm efficiency.

Ramanathan et al. (2018) used the DEA to extend the literature on environmental policy. The study indicated that innovation capabilities significantly influence the financial performance of firms. On the other hand, corporations that felt that they faced more inflexible regulations were not so effective in improving their financial performance with their innovation capabilities. Chowdhury and Zelenyuk (2016) used DEA at the first stage to estimate efficiency scores and then used truncated regression estimation with double bootstrap to test the significance of explanatory variables. They also examined distributions of efficiency across geographic locations, size, and teaching status.

We find that several organizational factors are significant determinants of efficiency. Arunkumar and Ramanan (2017) explored the efficiency of 46 firms through DEA analysis and revealed that significantly technical inefficiencies exist in the industry. Mahajan et al. (2018) found that, with an enhancement in acquisitions and mergers, a movement to diversifying operations, implementation of advanced imported foreign technology, investment in fixed assets, and judicious distribution of resources for marketing activities can improve firm efficiency. Kapelko and Lansink (2015) revealed that the good performance of macroeconomic condition was the background for increasing firm efficiency, and there was a difference of efficiency between industries.

2.2. The Relationship Between Innovation and Efficiency

Innovation plays the most important role in increasing firm competitiveness and firm survival (Zhang et al., 2018; Gunday et al., 2011; Hall & Bagchi-Sen, 2002;

Kittikunchotiwut, 2020). Dobrzanski (2018) indicated that innovation and efficiency presented various innovation strategies by using DEA methodology and showed that innovation spending should be increased gradually in the aim to achieve optimal results. The DEA methodology allows assessing input-output efficiency. The input indicator is the annual public and private spending on

research and development (R&D). Further, Rajapathirana and Hui (2018) explored the relationship between innovation capabilities, types, and firm effectiveness in the insurance industry. The outcome confirms the strong and significant association between the innovation and effectiveness of the firm. Chancellor et al. (2015) determined the vital drivers in the productivity industry using two-staged data envelopment analysis method and found that there is a probable expansion through the greater use of R&D. The positive significant impact of innovation on firm performance was validated (Parast, 2011; Kocak et al., 2017; Hashi & Stojčić, 2013). 

3. Methodology

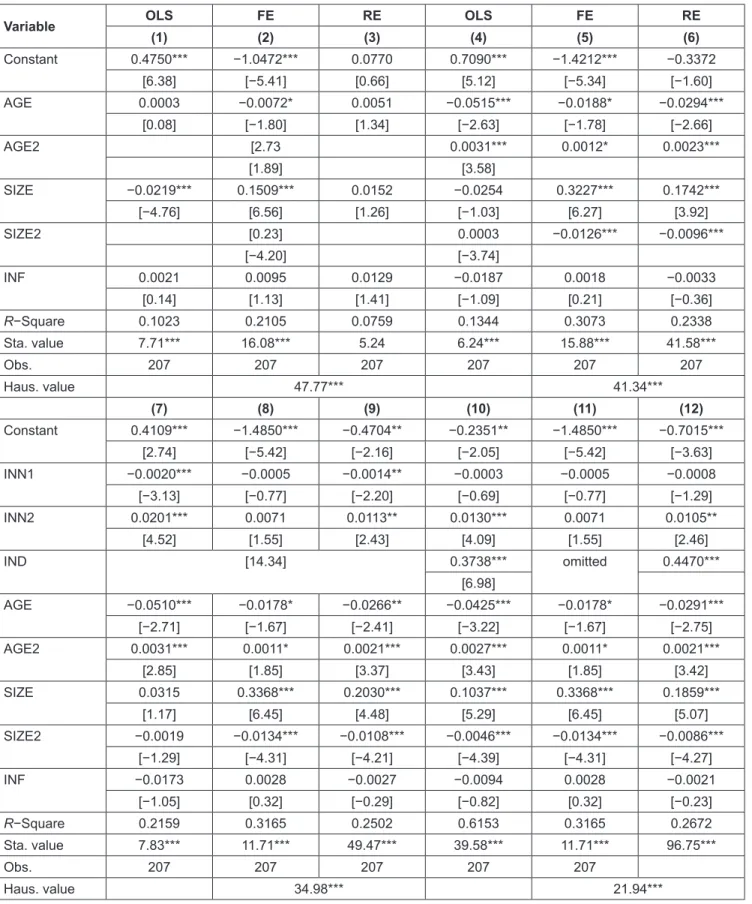
The two-stage approach is used to estimate the impact of innovation on firm efficiency. The first stage is the use of DEA to estimate firm efficiency value for each company in a year. With the strong balanced panel data, the second stage is the use of the Pooled ordinary least squares (Pooled), Fixed effect model (FE), and Random effect model (RE) to estimate the impact of innovation on firm efficiency.

Besides, to estimate the robustness, we use the Generalized method of moments approach (GMM), the Tobit model to determine the impact of innovation on firm efficiency, and the t-test to examine the difference in firm efficiency between the finance industry and the technology industry.

3.1. Data Envelopment Analysis Method

Based on the relationship between output and input in the production function, Charnes et al. (1978) proposed the DEA approach to estimate this relationship. The outcome of the DEA is called by the efficiency of the decision-making unit (DMU).

h u y

j r

v x

rj rj

s ij ij i


m


11

(1)

subject to u

r

and v

i

 ≥ 0, and Max h

j

 ≤ 1

•  j = 1, …, n; r = 1, …, s; i = 1, …, m

•  y

j

and x

j

are output and input of the j

th

DMU

•  u

r

is the weight of the r

th

output; and v

i

is the weight of the i

th

input

•  h

j

is the efficiency score of the j

th

DMU. A DMU is efficient if h

j

= 1, and if less than 1, it is inefficient.

The strengths and weaknesses of DEA were indicated

by Alvarez and Crespi (2003). The strengths include: no

need for some assumptions as the production functions and

the weight of input and output are the same, and call for no

(3)

special model. The weaknesses include: the result may be sensitive to measurement error, and the large inputs may lead to high efficiency. To minimized the risk when using DEA, Cheruiyot (2017), Alvarez and Crespi (2003), Bremmera et al. (2008), and Faruq and Yi (2010) suggest to use only sales as output, and labor and capital as inputs.

3.2. The Static Panel Model

To consider the simultaneous effect of cross-section and time-series of innovation on firm efficiency, we formulate the static panel model below:

Y

jt

= α + β

1

X

jt

+ β

2

Z

jt

+ ԑ

jt

(2) Where:

•  Y, X, and Z is firm efficiency variable, determinant variables of firm efficiency, and innovation variables, respectively

•  j = 1, …, n is the firm

•  t = 2011, …, 2019 is the year (9 years)

•  α is a constant, β

1

and β

2

are the coefficients of X and Z variables

•  ԑ

jt

= µ

j

+ λ

jt

is error term with µ

j

is the individual specific effect to cover the specific heterogeneity, and λ

jt

is individual time-varying across individuals and over time

Based on Hansen (1982), Arellano and Bond (1991), and Wooldridge (2001), three approaches are considered to estimate the regression model for panel data: Pooled, FE, and RE. While the pooled method considers all observations in the sample like the cross-section data, FE and RE consider both time-series and cross-section components simultaneously.

Furthermore, whereas FE assumes unobserved variables association with observed variables, there is no correlation between unobserved variables and observed variables in the assumption of RE (Borenstein et al., 2010). To choose the best model between FE and RE for explaining the effect of independent variables on dependent variable, the Hausman test is used by Griliches and Hausman (1986) and Arellano (1993). However, the results of FE and RE methods may have multicollinearity and autocorrelation issues, therefore, to fix the issues and increase robustness of the result, the GMM method is used. The GMM outcome is considered the best results of panel data to explain the relationship between variables in linear regression model (Hansen, 1982; Arellano

& Bond, 1991; and Wooldridge, 2001).

Because the value of efficiency is from zero (0) to one (1), Alvarez and Crespi (2003), Bremmera et al. (2008), and Faruq and Yi (2010) proposed the Tobit model to be used to assess the robustness of the impact of independent variables on the dependent variable.

3.3. Measurement Variables 3.3.1. Firm Efficiency

Firm performance may be represented by firm efficiency value (Cheruiyot, 2017; Bremmera et al., 2008). The efficiency refers to the success of allocating resources in the production to optimize the outcomes (Cheruiyot, 2017).

Borrowing from Cheruiyot (2017), Alvarez and Crespi (2003), Bremmera et al. (2008), and Faruq and Yi (2010), we use the DEA method to estimate the efficiency with inputs being capital and labor, and output being sales. Inputs consist of the equity and the number of employees, and output is the sales. Under the support of Stata Statistical Software, the value of firm efficiency (EFF) is calculated.

3.3.2. Innovation

The most common financial statement about intangible fixed asset shows that intangible fixed asset is the worth of patent, brand name, etc., that reflects the innovation activities (Lev, 2000; Flor & Oltra, 2004; Kleinknecht et al., 2002).

Hence, in this study, the innovation variable is measured by the ratio of intangible fixed asset on fixed asset (INN1), and the ratio of intangible fixed asset on total asset (INN2).

3.3.3. Other Variables

Based on studies about determinant of firm efficiency in various industries by Faruq and Yi (2010), and Kapelko and Lansink (2015), we found some common variables such as firm characteristics and macroeconomic condition, which influence firm efficiency such as:

•  Firm age (AGE) is the number of years the firm has been in the initial public offering

•  Firm size (SIZE) is measured by the logarithm of total assets

•  Inflation (INF) is measured by the definition of inflation by the World Bank: “Inflation as measured by the consumer price index reflects the annual percentage change in the cost to the average consumer of acquiring a basket of goods and services that may be fixed or changed at specified intervals, such as yearly”.

Furthermore, we collected the data from the finance industry and the technology industry, which are categorized by the regulation of the Vietnam Stock Exchange Commission.

Therefore, industry variable (IND) is determined; IND is a

dummy variable with the value of 0 and 1 for the finance

industry and the technology industry, respectively. Alvarez

and Crespi (2003) found that there was a difference in

efficiency between difference industries.

(4)

Based on the results of previous studies, we expect the sign of independent coefficients in the linear regression model as Table 1, which is hypothesized by this study.

3.4. Data Collection

The data for this study is provided from Vietstock, a stock statistical entity of the Vietnam Stock Exchange market.

They collect the audited financial statements, annual reports and others important reports of listed companies and publish the data on their website. The data of Vietstock was used by various studies about the listed companies in Vietnam (Nguyen & Nguyen, 2020; Thu et al., 2013; Lien Minh et al., 2018; Phung & Mishra, 2016; Wang & Nguyen, 2017). The inflation variable is collected from the World Bank Database.

The data period is from 2011 to 2019. The year of 2011 was chosen as Vietnam’s economy was beginning to recover

after the effect of the global financial crisis 2008–2009. The database covers the finance industry and the technology industry. We choose these two industries because, firstly, they were not mentioned in previous studies in Vietnam, a developing country. Secondly, because both industries depend on innovation for survival and growth, especially the strong relationship between innovation and the fintech industry, which is a new industry combining finance and technology (Van Loo, 2018; Buchak et al., 2018; Dorfleitner et al., 2017). We chose 23 listed companies including fourteen financial organizations and nine technological companies, which met the following requirements:

•  They are classified by the International Standard Industrial Classification, which has been adopted by the Vietnam Stock Exchange market since 2010.

•  To have good data, we require the selected companies must be operating during the period 2011-2019 because we observe that there are some companies that stopped or went bankrupt in the timescale of this study, negatively impacted by the financial crisis of 2008–2009.

•  The annual financial reports always reveal the main components for calculating most variables, thus, we only choose the firm having the audited financial report. It ensures the variables are objective.

•  The annual report, which is presented to the shareholder meeting, is also the key document that reflects exactly performance, capabilities, and crucial changes of the company during a year. The annual report provides the key component for this study, which is the number of employees. Thus, we only chose companies having nine annual reports with the report revealing the number or change of employees.

Table 2: Descriptive Statistics

Variable Obs. Mean Std.

Dev. Min Max

EFF 207 0.286 0.215 0.058 1.000

INN1 207 37.207 29.426 0.022 99.246

INN2 207 2.564 4.634 0.005 24.921

AGE 207 7.522 3.403 1.000 17.000

SIZE 207 9.025 3.141 2.708 14.031

INF 9 2.621 1.030 1.410 4.82

IND 207 0.391 0.489 0.000 1.000

Note: INF is just for 9 years (2011-2019), and it is repeated for each firm.

Source: The Vietstock 2020 and the World Bank 2020.

Table 1: The Expectation Sign of the Linear Regression Model

Variable Sign Source Result

AGE − Cheruiyot (2017), and Kapelko and Lansink (2015) Accepted (Tobit) AGE2 + Cheruiyot (2017), and Kapelko and Lansink (2015)

SIZE + Cheruiyot (2017), Faruq and Yi (2010),

Badunenko et al. (2008), Hashi and Stojčić (2013), and Kapelko and Lansink (2015)

Accepted

SIZE2 − Cheruiyot (2017), Faruq and Yi (2010), and Kapelko and Lansink (2015)

Innovation + Badunenko et al. (2008) and Hashi and Stojčić (2013) Accepted

− Amornkitvikai and Harvie (2010)

Macro + Kapelko and Lansink (2015) Rejected

Industry (differ) Alvarez and Crespi (2003) Accepted

(5)

While most variables have 207 observations for 23 listed companies in the period 2011–2019, GDP variable has nine observations for nine years (2011–2019) and it is repeated for each company. The descriptive statistics of variables are illustrated in Table 2.

4. Results and Discussion

Table 3 shows that the maximize of VIF is 2.05 (<4.00), and the maximize of absolute value of correlation coefficient between pairs variables is 0.442 (<0.50). Therefore, we can conclude that the all variables in the regression model (2) are eligible (Gujarati & Porter, 2009; O’brien, 2007; Salmerón Gómez et al., 2020).

Based on the study by Faruq and Yi (2010) and Cheruiyot (2017), we first investigate the determinant of firm efficiency with firm age and firm size, which are as the independent variables, and inflation is as the control variable for macroeconomic condition factor.

After that, the firm age square and firm size square are added into the model, because of the U-shaped in the relationship between efficiency and firm size-age of the company (Kapelko & Lansink, 2015; Faruq & Yi, 2010;

Cheruiyot, 2017). Next, we bring innovation variables and industry variable into the determinant firm efficiency model to investigate the impact of innovation on firm efficiency and the difference in efficiency between both industries.

These models are processed by the Pooled, FE, and RE approaches, and the outcomes are shown in Table 4. The statistical values of models indicate that most results of models (1–12) are significant levels at 1%, except for model RE (column 2), which is not significant. The Hausman test indicates that the outcomes of FE are better to explain the influence of independent variables on dependent variable than the outcomes of RE. There is a significant relationship between firm age, firm size, and firm efficiency at different significant levels and a sign of size, age, size square, and age square are consistency with Kapelko and Lansink (2015) and Cheruiyot (2017). Additionally, the macroeconomic condition (inflation variable) does not influence firm efficiency, but there is a significant difference in firm

efficiency between the finance industry and the technology industry at level 1%.

From column 7 to column 12 (see table 4) show that while coefficients of INN1 have negative signs, coefficients of INN2 have positive signs. The coefficients of INN1 in column 7 and column 9 are significant at 1% and 5%, respectively. The coefficients of INN2 in column 7, column 9, column-10, and column 12 are significant at 1%, 5%, 1%, and 5%, respectively. The impact of two innovation variables on firm efficiency are contradictory. The ratio of intangible fixed asset on total asset is the increasing factor of firm efficiency, whereas if the ratio of intangible fixed asset on fixed asset increases, it will make to decrease firm efficiency.

As we mentioned above, the outcomes of Pooled, FE, and RE methods may not meet the standard requirements of the linear regression model, hence we check the robustness of the models by using the GMM method. Besides, because firm efficiency value is [0,1], the Tobit model is used for robustness check. Table 5 shows the outcome of the GMM model and Tobit model. Generally, the statistical values (Sta. val. row) show that all results from GMM and Tobit are significant at least 5%. The AR(2) value and Sargan value indicate that the outcomes are suitable with the standard requirements of GMM method. Based on the outcomes of Table 5, we can verify that there is a significant influence of innovation on firm efficiency;

the relationship between size and efficiency is like the inverted U-shaped pattern (column 15), the relationship between age and efficiency is like the U-shaped pattern (column 18), and while the influence of other variables on firm efficiency is different in both various models and methods.

The outcomes in column 10 and column 12 reveal the difference in efficiency between the finance industry and the technology industry. Based on the outcome in column 15, we calculate the new firm efficiency, and then we use t-test to examine the difference in efficiency under the impact of innovation. Table 6 shows that there is a significant difference in efficiency between the two industries with and without the impact of innovation. Without the impact of innovation, the firm efficiency of the technology industry is higher than of the finance industry, but under the impact of innovation, the finance industry is higher than of the technology industry at 1% of a significant level.

Table 3: The VIF Value and Correlation Matrix Between Variables

Variable VIF EFF INN1 INN2 AGE SIZE INF

EFF − 1.000

INN1 1.86 −0.153 1.000

INN2 2.05 0.298 0.391 1.000

AGE 1.29 −0.048 −0.001 −0.133 1.000

SIZE 1.96 −0.320 0.330 −0.435 0.153 1.000

INF 1.27 0.019 −0.090 −0.050 −0.442 −0.035 1.000

(6)

Table 4: The Regression Results

Variable OLS FE RE OLS FE RE

(1) (2) (3) (4) (5) (6)

Constant 0.4750*** −1.0472*** 0.0770 0.7090*** −1.4212*** −0.3372

[6.38] [−5.41] [0.66] [5.12] [−5.34] [−1.60]

AGE 0.0003 −0.0072* 0.0051 −0.0515*** −0.0188* −0.0294***

[0.08] [−1.80] [1.34] [−2.63] [−1.78] [−2.66]

AGE2 [2.73 0.0031*** 0.0012* 0.0023***

[1.89] [3.58]

SIZE −0.0219*** 0.1509*** 0.0152 −0.0254 0.3227*** 0.1742***

[−4.76] [6.56] [1.26] [−1.03] [6.27] [3.92]

SIZE2 [0.23] 0.0003 −0.0126*** −0.0096***

[−4.20] [−3.74]

INF 0.0021 0.0095 0.0129 −0.0187 0.0018 −0.0033

[0.14] [1.13] [1.41] [−1.09] [0.21] [−0.36]

R−Square 0.1023 0.2105 0.0759 0.1344 0.3073 0.2338

Sta. value 7.71*** 16.08*** 5.24 6.24*** 15.88*** 41.58***

Obs. 207 207 207 207 207 207

Haus. value 47.77*** 41.34***

(7) (8) (9) (10) (11) (12)

Constant 0.4109*** −1.4850*** −0.4704** −0.2351** −1.4850*** −0.7015***

[2.74] [−5.42] [−2.16] [−2.05] [−5.42] [−3.63]

INN1 −0.0020*** −0.0005 −0.0014** −0.0003 −0.0005 −0.0008

[−3.13] [−0.77] [−2.20] [−0.69] [−0.77] [−1.29]

INN2 0.0201*** 0.0071 0.0113** 0.0130*** 0.0071 0.0105**

[4.52] [1.55] [2.43] [4.09] [1.55] [2.46]

IND [14.34] 0.3738*** omitted 0.4470***

[6.98]

AGE −0.0510*** −0.0178* −0.0266** −0.0425*** −0.0178* −0.0291***

[−2.71] [−1.67] [−2.41] [−3.22] [−1.67] [−2.75]

AGE2 0.0031*** 0.0011* 0.0021*** 0.0027*** 0.0011* 0.0021***

[2.85] [1.85] [3.37] [3.43] [1.85] [3.42]

SIZE 0.0315 0.3368*** 0.2030*** 0.1037*** 0.3368*** 0.1859***

[1.17] [6.45] [4.48] [5.29] [6.45] [5.07]

SIZE2 −0.0019 −0.0134*** −0.0108*** −0.0046*** −0.0134*** −0.0086***

[−1.29] [−4.31] [−4.21] [−4.39] [−4.31] [−4.27]

INF −0.0173 0.0028 −0.0027 −0.0094 0.0028 −0.0021

[−1.05] [0.32] [−0.29] [−0.82] [0.32] [−0.23]

R−Square 0.2159 0.3165 0.2502 0.6153 0.3165 0.2672

Sta. value 7.83*** 11.71*** 49.47*** 39.58*** 11.71*** 96.75***

Obs. 207 207 207 207 207

Haus. value 34.98*** 21.94***

Note: *, **, and *** are the significant at 10%, 5%, and 1%, respectively.

(7)

Table 5: The Estimation of the GMM Method and Tobit Model

GMM Tobit

(13) (14) (15) (16) (17) (18)

AGE −0.0423*** 0.0637 0.0443 0.0004 −0.0515*** −0.0510***

[−2.70] [1.59] [1.32] [0.08] [5.19] [−2.77]

SIZE 0.4813*** 0.7918*** 0.8616*** −0.0219*** −0.0254 0.0315

[3.00] [3.42] [3.54] [−4.80] [−1.05] [1.19]

INF −0.0212* 0.0171 0.0022 0.0021 −0.0187 −0.0173

[−1.69] [1.15] [0.17] [0.14] [−1.11] [−1.07]

AGE2 −0.0025 −0.0023 0.0031*** 0.0031***

[−1.20] [−1.14] [2.77] [2.91]

SIZE2 −0.0441*** −0.0394*** 0.0003 −0.0019

[−3.57] [−3.65] [0.24] [−1.31]

INN1 −0.0059** −0.0020***

[−2.41] [−3.20]

INN2 0.0322** 0.0201***

[2.09] [4.61]

CONS 0.4750*** 0.7090*** 0.4109***

[6.44] [5.19] [2.79]

Sta. Val. 3.38** 14.37*** 10.74*** 22.34*** 29.88*** 50.35***

N 161 161 161 207 207 207

AR(2) 0.77 −0.72 0.01

Sargan 4.07 11.50 13.12

Note: *, **, and *** are the significant at 10%, 5%, and 1%, respectively.

Table 6: Comparison of Technical Efficiency Between the Finance and the Technology Industry

Group Obs. Without Impact of Innovation With Impact of Innovation

Mean Std. Err. Mean Std. Err.

Finance 126 4.3004 0.0126 0.1630 0.0072

Technology 81 3.6427 0.0899 0.4769 0.0244

Combine 207 4.0430 0.0423 0.2858 0.0150

Difference 0.6577 0.0737 −0.3139 0.0215

t−value 8.9257 −14.6302

Pro. (Ha: Fin. ≠ Tech.) 0.000 0.000

Pro. (Ha: Fin. > Tech.) 0.000 1.000

Pro. (Ha: Fin. < Tech.) 1.000 0.000

Note: *, **, and *** are the significant at 10%, 5%, and 1%, respectively.

New technical efficiency = 0.8616 * SIZE – 0.0394*SIZE2 – 0.0059 * INN1 + 0.0322*INN2.

(8)

5. Conclusion

We added the innovation variables into the determinant of firm efficiency model of Faruq and Yi (2010) and Cheruiyot (2017) to investigate the impact of innovation on firm efficiency. Additionally, the inflation variable is also added to the model to consider the influence of macroeconomic condition on firm efficiency. Two-stage approach is used, in which firm efficiency is like the intermediate variable, that is computed by the DEA method, a popular method to measure firm efficiency, and then linear regression model is formulated. Vietstock provides the audited financial statements and other reports that relate to 23 listed companies in the finance industry and technology industry in Vietnam Stock Exchange market from 2011 to 2019. The macroeconomic condition is represented by inflation, collected from the database of World Bank. The Pooled, FE, and RE are used to investigate the impact of innovation on firm efficiency. Besides, the GMM and Tobit are applied for robustness check of the outcomes, and t-test is also used to check the difference in efficiency between the finance industry and the technology industry. The results show that there is a significant impact of innovation on firm efficiency. Moreover, we have found that the role of innovation in enhancing efficiency of the finance industry is more important than the technology industry; the relation between age and efficiency is like the U-shaped, and between size and efficiency is like the inverted U-shaped.

Besides the DEA, the Stochastic Frontier Analysis (Amornkitvikai & Harvie, 2010), or Non-Stochastic Frontier Analysis (Kumar et al., 2020) are also useful to measure firm efficiency. Thus, to increase the consistency and efficiency of the results, we recommend that future studies may consider using the Stochastic Frontier Analysis and Non-Stochastic Frontier Analysis for measuring firm efficiency. Fintech is the new industry in the digital era, created by the financial and technological innovation in the finance sector. It is also as a hybrid of the finance industry and the technology industry (Van Loo, 2018). The fintech industry is developing sharply (Buchak et al., 2018; Dorfleitner et al., 2017; Lien et al., 2020), hence, we propose that research about fintech efficiency issue may be considered in the future.

References

Alvarez, R., & Crespi, G. (2003). Determinants of Technical Efficiency in Small Firms. Small Business Economics, 20(3), 233–244. https://doi.org/10.1023/A:1022804419183

Amornkitvikai, Y., & Harvie, C. (2010). Identifying and measuring technical inefficiency factors: evidence from unbalanced panel data for Thai listed manufacturing enterprises. Department of Economics, University of Wollongong, Working Paper 05–10, 2010, 1–35. https://ro.uow.edu.au/commwkpapers/222

Arellano, M. (1993). On the testing of correlated effects with panel data. Journal of Econometrics, 59(1–2), 87–97. https://doi.

org/10.1016/0304-4076(93)90040-C

Arellano, M., & Bond, S. (1991). Some Tests of Specification for Panel Data: Monte Carlo Evidence and an Application to Employment Equations. The Review of Economic Studies, 58(2), 277–297. https://doi.org/10.2307/2297968

Artz, K. W., Norman, P. M., Hatfield, D. E., & Cardinal, L. B.

(2010). A Longitudinal Study of the Impact of R&amp;D, Patents, and Product Innovation on Firm Performance. Journal of Product Innovation Management, 27(5), 725–740. https://

doi.org/10.1111/j.1540-5885.2010.00747.x

Arunkumar, O. N., & Ramanan, T. R. (2017). Operational efficiency and its determinants of Indian food and beverages industries:

a DEA approach. International Journal of Services and Operations Management, 27(1), 1–18. https://doi.org/10.1504/

IJSOM.2017.083332

Borenstein, M., Hedges, L. V., Higgins, J. P. T., & Rothstein, H. R.

(2010). A basic introduction to fixed-effect and random-effects models for meta-analysis. Research Synthesis Methods, 1(2), 97–111. https://doi.org/10.1002/jrsm.12

Bremmera, J., Lansink, A. G. J. M. O., & Huirne, R. B. M. (2008).

The impact of innovation, firm growth and perceptions on technical and scale efficiency. Agricultural Economics Review, 9(2), 65–85.

Buchak, G., Matvos, G., Piskorski, T., & Seru, A. (2018). Fintech, regulatory arbitrage, and the rise of shadow banks. Journal of Financial Economics, 130(3), 453–483. https://doi.

org/10.1016/j.jfineco.2018.03.011

Chancellor, W., Abbott, M., & Carson, C. (2015). Factors Promoting Innovation and Efficiency in the Construction Industry: A Comparative Study of New Zealand and Australia.

Construction Economics and Building, 15(2), 63–80. https://

doi.org/10.5130/AJCEB.v15i2.4386

Charnes, A., Cooper, W. W., & Rhodes, E. (1978). Measuring the efficiency of decision making units. European Journal of Operational Research, 2(6), 429–444. https://doi.

org/10.1016/0377-2217(78)90138-8

Cheruiyot, K. J. (2017). Determinants of Technical Efficiency in Kenyan Manufacturing Sector. African Development Review, 29(1), 44–55. https://doi.org/10.1111/1467-8268.12237

Chowdhury, H., & Zelenyuk, V. (2016). Performance of hospital services in Ontario: DEA with truncated regression approach. Omega, 63, 111–122. https://doi.org/10.1016/j.

omega.2015.10.007

Dobrzanski, P. (2018). Innovation expenditures efficiency in central and eastern European countries. Zbornik Radova Ekonomskog Fakultet Au Rijeci, 36(2), 827–859. https://doi.org/10.18045/

zbefri.2018.2.827

Dorfleitner, G., Hornuf, L., Schmitt, M., & Weber, M. (2017).

FinTech in Germany. In: FinTech in Germany. Berlin: Springer

International Publishing. https://doi.org/10.1007/978-3-319-

54666-7

(9)

Emrouznejad, A., & Yang, G. (2018). A survey and analysis of the first 40 years of scholarly literature in DEA: 1978–2016.

Socio-Economic Planning Sciences, 61, 4–8. https://doi.

org/10.1016/j.seps.2017.01.008

Faruq, H. A., & Yi, D. T. (2010). The Determinants of Technical Efficiency of Manufacturing Firms in Ghana. Global Economy Journal, 10(3), 1850205. https://doi.org/10.2202/1524- 5861.1646

Flor, M. L., & Oltra, M. J. (2004). Identification of innovating firms through technological innovation indicators: An appli- cation to the Spanish ceramic tile industry. Research Policy, 33(2), 323–336. https://doi.org/10.1016/j.respol.2003.09.009 Griliches, Z., & Hausman, J. A. (1986). Errors in variables in panel

data. Journal of Econometrics, 31(1), 93–118. https://doi.

org/10.1016/0304-4076(86)90058-8

Gujarati, D. N., & Porter, D. C. (2009). Basic econometrics.

Douglas Reiner, McGraw-Hill/Irwin.

Gunday, G., Ulusoy, G., Kilic, K., & Alpkan, L. (2008). Modeling innovation: Determinants of innovativeness and the impact of innovation on firm performance. 2008 4th IEEE International Conference on Management of Innovation and Technology, 766–771. https://doi.org/10.1109/ICMIT.2008.4654462 Gunday, G., Ulusoy, G., Kilic, K., & Alpkan, L. (2011). Effects of

innovation types on firm performance. International Journal of Production Economics, 133(2), 662–676. https://doi.

org/10.1016/j.ijpe.2011.05.014

Hall, L. A., & Bagchi-Sen, S. (2002). A study of R&D, innovation, and business performance in the Canadian biotechnology industry. Technovation, 22(4), 231–244. https://doi.

org/10.1016/S0166-4972(01)00016-5

Hansen, L. P. (1982). Large Sample Properties of Generalized Method of Moments Estimators. Econometrica, 50(4), 1029–1054.

Hashi, I., & Stojčić, N. (2013). The impact of innovation activities  on firm performance using a multi-stage model: Evidence from the Community Innovation Survey 4. Research Policy, 42(2), 353–366. https://doi.org/10.1016/j.respol.2012.09.011

Kapelko, M., & Lansink, A. O. (2015). Technical efficiency and its determinants in the Spanish construction sector pre- and post- financial crisis. International Journal of Strategic Property Management, 19(1), 96–109. https://doi.org/10.3846/164871 5X.2014.973924

Kittikunchotiwut, P. (2020). The Roles of Organizational Learning Capability and Firm Innovation in the Relationship between Entrepreneurial Orientation and Firm Performance. Journal of Asian Finance, Economics and Business, 7(10), 651–661.

https://doi.org/10.13106/jafeb.2020.vol7.no10.651

Kleinknecht, A., Van Montfort, K., & Brouwer, E. (2002). The Non-Trivial Choice between Innovation Indicators. Economics of Innovation and New Technology, 11(2), 109–121. https://doi.

org/10.1080/10438590210899

Kocak, A., Carsrud, A., & Oflazoglu, S. (2017). Market, entrepreneurial, and technology orientations: impact on

innovation and firm performance. Management Decision, 55(2), 248–270. https://doi.org/10.1108/MD-04-2015-0146 Kumar, A., Anand, N., & Batra, V. (2020). Trends in Indian Private

Sector Bank Efficiency: Non-Stochastic Frontier DEA Window Analysis Approach. Journal of Asian Finance, Economics and Business, 7(10), 729–740. https://doi.org/10.13106/jafeb.2020.

vol7.n10.729

Lev, B. (2000). Intangibles: Management, measurement, and reporting. Washington, DC: Brookings Institution Press.

Lien Minh, D., Sadeghi-Niaraki, A., Huy, H. D., Min, K., & Moon, H. (2018). Deep Learning Approach for Short-Term Stock Trends Prediction Based on Two-Stream Gated Recurrent Unit Network. IEEE Access, 6, 55392–55404. https://doi.

org/10.1109/ACCESS.2018.2868970

Lien, N. T. K., Doan, T.-T. T., & Bui, T. N. (2020). Fintech and Banking: Evidence from Vietnam. Journal of Asian Finance, Economics and Business, 7(9), 419–426. https://doi.

org/10.13106/jafeb.2020.vol7.no9.419

Mahajan, V., Nauriyal, D. K., & Singh, S. P. (2018). Efficiency and Its Determinants: Panel Data Evidence from the Indian Pharmaceutical Industry. Margin: The Journal of Applied Economic Research, 12(1), 19–40. https://doi.

org/10.1177/0973801017738416

Nguyen, V. C., & Nguyen, T. N. L. (2020). Financial Security of Vietnamese Businesses and Its Influencing Factors. Journal of Asian Finance, Economics and Business, 7(2), 75–87. https://

doi.org/10.13106/jafeb.2020.vol7.no2.75

O’brien, R. M. (2007). A Caution Regarding Rules of Thumb for Variance Inflation Factors. Quality & Quantity, 41(5), 673–690.

https://doi.org/10.1007/s11135-006-9018-6

Parast, M. M. (2011). The effect of Six Sigma projects on innovation and firm performance. International Journal of Project Management, 29(1), 45–55. https://doi.org/10.1016/j.

ijproman.2010.01.006

Phung, D. N., & Mishra, A. V. (2016). Ownership Structure and Firm Performance: Evidence from Vietnamese Listed Firms.

Australian Economic Papers, 55(1), 63–98. https://doi.

org/10.1111/1467-8454.12056

Rajapathirana, R. P. J., & Hui, Y. (2018). Relationship between innovation capability, innovation type, and firm performance.

Journal of Innovation & Knowledge, 3(1), 44–55. https://doi.

org/10.1016/j.jik.2017.06.002

Ramanathan, R., Ramanathan, U., & Bentley, Y. (2018). The debate on flexibility of environmental regulations, innovation capabilities and financial performance – A novel use of DEA. Omega, 75, 131–138. https://doi.org/10.1016/j.

omega.2017.02.006

Rosli, M. M., & Sidek, S. (2013). The Impact of Innovation on the Performance of Small and Medium Manufacturing Enterprises:

Evidence from Malaysia. Journal of Innovation Management in Small & Medium Enterprise, November, 1–16. https://doi.

org/10.5171/2013.885666

(10)

Salmerón Gómez, R., Rodríguez Sánchez, A., García, C. G.,

& García Pérez, J. (2020). The VIF and MSE in Raise Regression. Mathematics, 8(4), 605. https://doi.org/10.3390/

math8040605

Thu, N. K., Trien, L. V., Anh, D. T. T., & Nhon, H. T. (2013).

Determinants of Dividend Payments of Non-financial Listed Companies in Ho Chi Minh Stock Exchange. VNU Journal of Economics and Business, 29(5), 16–33. https://js.vnu.edu.vn/

EAB/article/view/417

Van Loo, R. (2018). Making innovation more competitive: The case of fintech. UCLA Law Review, 65(1), 232–279. https://ssrn.

com/abstract=2966890

Wang, C. N., & Nguyen, X. T. (2017). Forecasting and Measuring Productivity in Vietnamese Plastic Industry by Using Grey and DEA. International Research Journal of Advanced Engineering and Science, 2(4), 141–148. https://www.irjaes.com/pdf/

V2N4Y17-IRJAES/IRJAES-V2N4P229Y17.pdf

Wooldridge, J. M. (2001). Applications of generalized method of moments estimation. Journal of Economic Perspectives, 15(4), 87–100. https://doi.org/10.1257/jep.15.4.87

Zhang, D., Zheng, W., & Ning, L. (2018). Does innovation facilitate firm survival? Evidence from Chinese high-tech firms. Economic Modelling, 75(January), 458–468. https://doi.

org/10.1016/j.econmod.2018.07.030

수치

Table 2: Descriptive Statistics
Table 3 shows that the maximize of VIF is 2.05 (&lt;4.00),  and the maximize of absolute value of correlation coefficient  between pairs variables is 0.442 (&lt;0.50)
Table 4: The Regression Results
Table 6: Comparison of Technical Efficiency Between the Finance and the Technology Industry

참조

관련 문서

The efficiency of the proposed method is illustrated with the numerical results on randomly generated synthetic/deterministic data and gene expression data, in comparison

The English Language Centre The University of Adelaide Level 9, 115 Grenfell Street Adelaide SA 5005 Australia Phone: + 61 8 8313 4777 Fax: + 61 8 8313

 The Dutch physicist Pieter Zeeman showed the spectral lines emitted by atoms in a magnetic field split into multiple energy levels...  With no magnetic field to align them,

Modern Physics for Scientists and Engineers International Edition,

If both these adjustments are considered, the resulting approach is called a bootstrap-BC a -method (bias- corrected-accelerated). A description of this approach

Several theories have emerged on the nature of the firm: The neoclassical theory of the firm, the principal agency theory, the transaction cost theory,

Hypotheses on Innovation Mode and Firm Decision to Export or perform FDI As in HMY (2004) and in Hallak and Sivadasan (2009), the innate levels of productivity and product

③ A student who attended Korean course at KNU Korean Language Program and holds TOPIK Level 3 or a student who completed Korean course Level 4 at the KNU Korean Language