ORIGINAL ARTICLE
A Study on the Thermal Characteristics of Midsummer in Daegu Metropolitan Area
Myung-Hee Park, Joon-Soo Lee, Won-Shik Ahn1), Hae-Dong Kim1)*, Sung-Nam Oh2) Fishery and Ocean Information Division, National Fisheries Research and Development Institute,
Busan 619-705, Korea
1)The Department of Global Environment, Keimyung University, Daegu 704-701, Korea
2)Korea Institute of Science and Technology Information, Seoul 130-742,Korea
Abstract
This study aims to examine the actual status of the urban heat island in Daegu by analyzing the data of 17 automatic weather stations installed in the Daegu area. And the results can be summarized as follows: First, regarding the temperature distribution in Daegu by summer time zones, for the 31 days(August 1st till 31st), 18 days showed daily maximum temperature over 30℃, and 11 days indicated daily minimum temperature over 25℃. The day that showed the highest daily maximum temperature was August 5th, which indicated 36℃. Second, about the spatial distribution of time ratio exceeding 30℃ and 25℃, the area with the highest time ratio exceeding 30℃ is mostly the downtown(central area), eastern area, and northern area. Meanwhile, regarding the time ratio exceeding 25℃, the downtown area centering around the central area were high as over 70%, and the outskirts were low as under 65%. Third, considering the temporal distribution of daily maximum temperature and daily minimum temperature, daily maximum temperature was shown around 14:00 to 15:00 while the daily minimum temperature was indicated around 17:00 to 18:00. Daily maximum and minimum temperature were appeared at northeast and downtown, respectively. Fourth, regarding the spatial distribution of tropical days and tropical night days, tropical days showed 77% and tropical night days indicated 42% before and after the 24th and also the 13th each. Tropical days were occurred up to 24 days at northeastern area. And the southwestern area of Daegu showed under 22 days. The downtown showed the 14 days of the tropical night. However, the outskirts indicated relatively few days as under 10 days.
Fifth, about the spatial distribution of the average daily temperature range (the difference between the highest temperature and lowest temperature), the central area, the central part of the city, showed the smallest as 7.2℃, and as it was closer to the northern area, it became larger, so in the eastern and northern area, it was over 8.8℃ or so.
Key words : Daily minimum temperature, Daily maximum temperature, Urban heat island, Tropical days, Tropical night days
1. Introduction1)
The urban heat island effect, which indicates higher temperatures in an urban area than in its surrounding rural area, is deepening with the acceleration of urbanization (Lowry, 1969; Shin, 2003). Therefore, the urban heat island effect on large
cities today is increasing the displeasure of urban dwellers in their life during the summer. In addition, it is causing serious environmental problems in various areas including air pollution and urban floods. Further, the cities located below the temperate zones are increasing the use of air conditioners due to the urban heat island effect, which, in turn, rapidly
Received 5 February, 2013; Revised 23 April, 2013;
Accepted 15 May, 2013
*Corresponding author : Hae-Dong Kim, The Department of Global Environment, Keimyung University, Daegu 704-701, Korea Phone: +82-53-580-5930
E-mail: [email protected]
ⓒ The Korean Environmental Sciences Society. All rights reserved.
This is an Open-Access article distributed under the terms of the Creative Commons Attribution Non-Commercial License (http://
creativecommons.org/licenses/by-nc/3.0) which permits unrestricted non-commercial use, distribution, and reproduction in any medium, provided the original work is properly cited.
increases energy consumption and heightens the risks of blackouts by causing heavy loads in power supply (Moriyama, 2004). Moreover, in China, Southeast Asia, Thailand, and southern China, quite a few regions suffer from chronic power shortages due to air conditioning loads during the summer. This raises a strong need to curb energy consumption, and resolve and plan for energy crises by inducing urban structures that have low environmental heat loads.
Along with rising urban temperatures, the urban heat island effect is also greatly affecting the onset of diseases, intensification of photochemical smogs, daily human lives and life itself, and the ecosystem.
In addition, urban heat islands are playing the role of accelerating temperature rises at the regional level in the era of global warming. Global warming is the rise in the Earth's average temperature due to the increase in greenhouse gases. Today, the urban population is exceeding half of the world's population.
In this respect, the impact of urban temperatures, which are rising at a much faster rate than that of temperatures rises due to global warming, is projected to have a much greater influence on human lives.
Accordingly, a number of countries all over the world have defined urban heat islands as thermal air pollution and aggressively sought to resolve this issue (Ando et al., 2003; Kim, 2011).
In Osaka, Japan, a comprehensive study has been conducted regarding the influences of the urban heat island by investigating the actual conditions of Osaka's urban heat island based on the 2002 observation data and performing a resident survey (Moriyama, 2004).
The resident survey confirmed the influences of the urban heat island on the residents' use of air conditioners during the summer, their health conditions and the ecosystem. Based on such results, the research team quantified the influences of the urban heat island on the environment of Osaka, using the data from the city of Osaka and utilities. As a result, during the daytime, the city's commercial
districts showed a higher level of sensitivity to temperature than the residential districts (the rate of power consumption increase for each 1℃ rise in temperature). At night, however, the residential districts exhibited a higher level of sensitivity to temperature. In particular, the residential districts revealed a markedly high level of sensitivity to temperature after 20:00pm. In addition, compared to the power consumption during intermediate periods of no cooling or heating, the power consumption of the downtown of Osaka during the midsummer was 112%
higher. During the same period, the power consumption of the suburban areas was 62% higher, indicating that the cooling loads of the suburban areas remained about half of those of the downtown. Moreover, the entire Osaka region was identified to generate about 600,000 kW for each 1℃ rise in average summer temperature. This is similar to the power generation capacity of a medium-scale nuclear reactor.
The research team also investigated the influences of the urban heat island effect on health. The health conditions caused by the heat island effect include sunstroke or heart strain due to rising daytime temperatures during the summer, air-conditioningitis due to long hours of air conditioning, and sleep deprivation and stress following rising night temperatures. The onset of sunstroke began to increase from a daily maximum temperature of 32℃ and sunstroke patients carried to hospitals rapidly increased from 35℃. The demand for air conditioning according to the rise in summer night temperatures rapidly increased at around 25℃. The threshold for the use of air conditioners during nocturnal sleep was estimated to range from 25℃ to 27℃. Moreover, according to the resident survey, more than 80% of the downtown residents responded that they could not stand without using an air conditioner both in the daytime and at night during the summer. Based on these study findings, the threshold from which the health of urban dwellers
and the environmental comfort begin to be destroyed was set at 35℃ in daytime temperature and at 27℃ in night temperature. Apart from this, the urban heat island was also confirmed to greatly affect the urban ecosystem and water balance.
The urban heat island effect has a strong localized nature. In order to identify the causes of temperature rises in different patterns by smaller areas within a city or mechanisms of the occurrences of heavy rains, the city's detailed weather data are necessary. In addition, to verify forecast results using urban climate models, spatiotemporal and high-resolution weather observation data are also required. To achieve the above research objectives, Tokyo in Japan has obtained urban climate data by installing weather observation systems in about 120 sites throughout Tokyo from 1997 to 1998 (Kim, 2011). Among them, 20 sites observe wind direction, wind speed, temperature, humidity, rainfall, and air pressure every 10 minutes using automatic weather observation systems installed on the rooftop of each building.
This observation network is called METROS20. The remaining 100 sites observe temperature and humidity by installing temperature and humidity logs in the instrument screen of each elementary school.
This observation network is called METROS100.
The representative study results that used the above data include the spatial distribution charts of temperatures in Tokyo, produced based on the observation data from July 20 to August 31, 2002, during which a heat wave swept the city. As the METROS observation data enable the analysis of spatio-temporal and high-resolution observation data, detailed information on urban heat environments also become identifiable.
In addition, such outcomes were provided to the Tokyo Metropolitan Area to establish measures to relieve its urban heat island effect. The municipal government utilized them as the basic data to establish the Basic Environment Plan for the Tokyo
Metropolitan Area (also titled as the 'Urban Temperature 2℃ Reduction Project'), which is to be implemented in the Tokyo Metropolitan Area with a goal to complete by the end of 2015. This plan has set "securing the potential for sustainable cities and the Earth and preventing the progress of the heat island effect and global warming" as its most important goal, and suggested measures for the urban heat island as one of the five key programs to achieve this goal.
In this basic plan, the goal of its heat island measures was defined as “reducing the number of days for which tropical nights occur from 30 days to 20 days by 2015 and lowering the average urban temperature by 2℃.” This goal was based on the intent to restore the urban climates of Tokyo to pre-1980s levels (Kim, 2011).
In the above context, the present study performed an investigation on the actual conditions of the heat island effect in Daegu by analyzing the data from 17 automatic weather observation stations installed in Daegu.
2. Materials and Methods
In this study, the original intention was to analyze the summer period (June to August) of 2005.
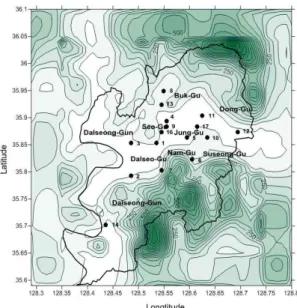
However, the due period was considered inappropriate for identifying the actual conditions of the urban heat island due to the inclusion of the monsoon season from June 21 to July 25. Therefore, the temperature data from August 1 to 31, which were derived from 17 weather observation sites, were used for the analysis. Fig. 1 and Table 1 below show the locations and names of the target sites. The weather observation network examined in Fig. 1 includes six out of 13 total sites within the air quality automatic measurement network installed and run by the Ministry of Environment in Daegu, excluding two mobile observation network sites (Namsan-dong, Pyeongri-dong), four sites
Site Name
Atmospheric environmental laboratory of keimyung
university
Dalseogu 1. GMS(Gamsam Middle School) Dalseogu 2. HMS(Hawon High School) Dalseogu 3. KMU(Keimyung University) Seogu 4. PMS(Pyungri Middle School)
Junggu 5. KNUHS(Kyungpook National University High School) Suseonggu 6. SMS(Suseong Middle School)
Dalseogu 7. DMS(Dowon Middle School)
Bukgu 8. Chilgok(Gyeongsangbuk-Do Agricultural research & Extention services)
Daegu government public institute of Health & environment
Seogu 9. Nowon(Samyoung Elementary School) Suseonggu 10. Manchon(Dongwon Elementary School) Donggu 11. Sinarm(Community Center)
Donggu 12. Yulha(Anil Elementary School) Bukgu 13. Taejeon(Taeam Elementary School) Dalseogu 14. Hyunpoong(The office of waterworks) Daegu
meteorological administration
Suseonggu 15. Suseong(DMA)
Seogu 16. Seogu(DMA)
Donggu 17. DMA(Daegu Meteorological Administration) Table 1. List of surface observation site
examined to have missing measurement dates (Daemyeong-dong, Suchang-dong, Ehyeon-dong, Jisan- dong), and one site with abnormally higher temperature levels than other sites (Galsan-dong), eight sites installed at the climate environment research center of Keimyung University in Daegu, and three sites at the Daegu Meterological Agency.
Fig. 1. Locations of observation sites.
3. Results and Discussion
3.1. Comparison with the Daegu Meterological Agency data
To evaluate the accuracy and the characteristics of the automatic weather observation network data (data from 16 sites excluding the Daegu Meterological Agency (DMA); hereafter described as 'All sites'), the observation data of the two sites (DMA and All sites) during the same period were compared and reviewed.
Generally, in identifying the weather conditions of Daegu, the DMA's ground weather data are utilized.
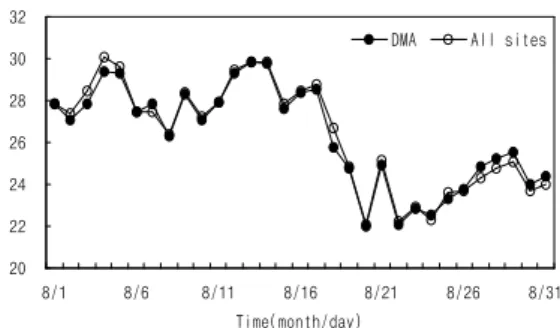
Therefore, the analysis of this study was also based on the DMA data. Fig. 2 shows the daily comparison of daily average temperatures between the DMA and All sites from August 1 to 31. In this, the patterns of daily average temperature changes between the DMA and All sites are exhibited to well match each other.
In addition, during the periods in which the DMA showed high temperatures, All sites also exhibited high temperatures while partly revealing minor temperature differences with the DMA.
20 22 24 26 28 30 32
8/1 8/6 8/11 8/16 8/21 8/26 8/31
Time(month/day)
Temperature(℃)
DMA All sites
Fig. 2. The comparison of daily mean temperatures at DMA and All sites.
Fig. 3 shows the hourly average values of temperatures. The changing patterns of the DMA and All sites show a strong correspondence. Except for the time interval from 15:00pm to 19:00pm, the DMA shows higher temperatures. Fig. 4 indicates temperature differences between the DMA and All sites to confirm such a pattern. A positive value means that a DMA value is higher than that of All sites. Looking at such differences, the DMA's lowest value was -0.6℃ at around 18:00pm, and its highest value was with 0.7℃ at around 8:00am. Such temperature differences are presumably because the data from All sites were the averages of all the areas excluding the DMA, thereby including the data of areas with wide daily temperature ranges. On the other hand, the DMA is located relatively near the downtown, thereby yielding observation results from locations with relatively narrower daily temperature ranges. However, overall, the two sites exhibited fairly consistent changing patterns each other. These results are also in accordance with the results of an analysis on Tokyo, Japan, conducted by Ando et al.
(2003).
Fig. 5 shows changes in daily average temperature, the daily minimum temperature, and the daily maximum temperature in the midsummer of 2005 (averages of all observation sites including the DMA and All sites from August 1 to 31 after July, 25, the end of the monsoon season). Over the 31-day period,
18 days recorded daily maximum temperatures of above 30℃, and 11 days recorded daily minimum temperatures of above 25℃. In early August, one day exhibited a maximum temperature of above 35℃.
Over the observation period, the day with the highest daily maximum temperature was August 5, registering 36℃.
23 24 25 26 27 28 29 30
1 3 5 7 9 11 13 15 17 19 21 23
Time(hr)
Temprerature(℃)
DMA All sties
Fig. 3. The comparison of hourly mean temperatures at DMA and All sites.
-0.6 -0.4 -0.2 0.0 0.2 0.4 0.6 0.8
1 3 5 7 9 11 13 15 17 19 21 23
Time(hr)
Temperature(℃)
DMA-All sites
Fig. 4. Differences of hourly mean temperatures at DMA and All sites.
15 20 25 30 35 40
8/1 8/6 8/11 8/16 8/21 8/26 8/31
Time(month/day)
Temperature(℃)
Daily mean temperature Daily maximum temperature Daily miniumu temperature
Fig. 5. The variation of temperatures in the summer at 2005 (Average all the points).
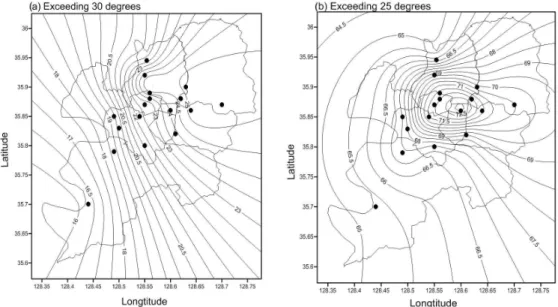
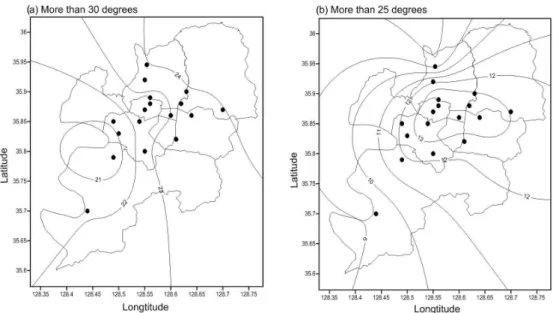
Fig. 6. The distribution of percentage exceeding (a) 30℃ and (b) 25℃ in hourly, respectively.
3.2. Temperature distribution characteristics By identifying the hourly average values and frequencies of temperatures based on the temperature data of each site and interpolating such values, various temperature distribution charts were drawn up. In addition, their regional characteristics were outlined in Fig. 1. ● in each figure indicates the location of an observation site.
3.2.1. Spatial distributions of the percentages of hours exceeding 30℃ and 25℃
Fig. 6 shows the spatial distributions of the percentages of hours exceeding 30℃ and 25℃
respectively. The regions with the highest percentages of hours exceeding 30℃ were widely distributed, mainly spanning the downtown (Jung-gu), eastern (Dong-gu), and northern (Buk-gu) regions. Their combined average percentage was over 22%, whereas the western region (Dalseo-gu and Dalseong-gun) showed a low percentage of less than 18%. The times at which the temperature began to exceed 30℃ were concentrated on the hours after midday, which tends to have the highest temperature levels throughout the day. This fact suggests that the regions that exhibit
high temperature levels are also the regions in which daytime temperature rises can easily occur.
On the other hand, the percentage of hours exceeding 25℃ was high at above 70% in the downtown and low at below 65% in the outskirts.
The regions with a high percentage of hours exceeding 25℃ were also the regions whose temperatures could hardly drop to below 25℃. In other words, they were the regions in which night temperatures could not easily go down. In this figure, the values of isoplethic curves in the outskirts out of the downtown were drawn without observation sites. Thus, readers should be noted that their reliability is relatively weak. Such a limitation is similarly applied to the spatial distributions of other climate factors presented afterward.
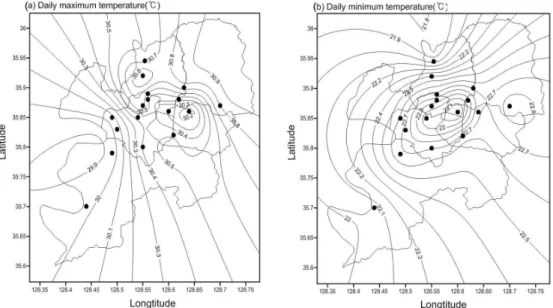
3.2.2. Spatial distributions of daily maximum tem- peratures and daily minimum temperatures Fig. 7 shows the spatial distributions of daily maximum temperatures and daily minimum temperatures.
The daily maximum temperatures were exhibited between 14:00pm and 15:00pm, and the daily minimum temperatures were exhibited between 5:00am and
Fig. 7. The distributions of (a) maximum temperature and (b) minimum temperature, respectively.
6:00am. Based on the findings, Fig. 7 shows average temperature distributions during the respective time intervals. The daily maximum temperatures were found to increase toward the northeastern region. The daily minimum temperatures showed the highest levels in the downtown. In terms of the daily maximum temperatures, Dalseo-gu, located near the Nakdong River, had a 1℃ lower record than Dong-gu. The regions with daily maximum temperatures of above 23℃ were near Jung-gu which belongs to the downtown, and almost overlapped with the regions with high percentages of hours exceeding 25℃.
However, the outskirts farther from the center of Daegu exhibited corresponding lower temperature levels. The regional gaps of each daily maximum temperatures and daily minimum temperatures were about 1℃ (daily maximum temperatures) and 1.3℃
(daily minimum temperatures).
3.2.3. Spatial distributions of the number of tropical day and tropical night, respectively Tropical days and tropical nighs are defined as the days with daily maximum temperatures of above 30℃
and the days with daily minimum temperatures of
above 25℃ respectively. Fig. 8 shows the respective numbers of tropical days and tropical nights over a 31-day period. The number of days with tropical days was around 24 days and the number of days with tropical nights was around 13 days, representing 77%
and 42% respectively. Tropical days were most frequent in the northern regions of Dong-gu and Buk- gu, recording 24 days, whereas the city's southwestern region exhibited a low level of 22 days. The largest number of days with tropical nights was observed in the downtown with 14 days. On the other hand, the suburban regions had relatively low 10 or fewer days.
The above numbers of tropical days were indeed significantly higher than 12.8 days, the annual average frequency over the recent 10 years (2000 to 2009) published by the National Institute of Meteorological Research (2009) based on the DMA data. Such a discrepancy results from the DMA's location in Shinam-dong, Dong-gu, which is the district with a relatively low level of urban activities.
3.2.4. Differences of daily temperature As a next step, a spatial distribution chart of average temperature differences (differences of maximum and
Fig. 8. The distribution of (a) tropical days and (b) tropical night days.
minimum temperatures) was drawn up, and then its regional characteristics were reviewed (Fig. 9).
According to Fig. 9, the daily temperature difference was smallest at 7.2℃ in Jung-gu, the city's central part, and became larger toward the northern areas.
For instance, Dong-gu and Buk-gu exhibited over 8.
8℃ in daily temperature difference.
Fig. 9. Differences between maximum and minimum tem- peratures.
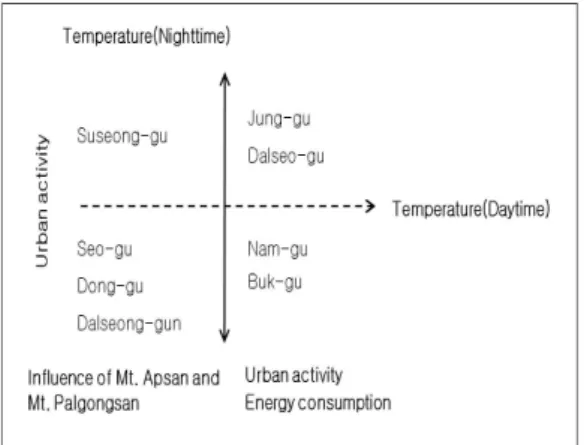
3.3. Factors related to temperature distribution Fig. 10 shows the grouping of regions with similar temperature changes by administrative districts on a plane with the two axes based on daytime and night temperatures. In reality, individual districts have different areas and numbers of observation sites, which subsequently results in different thermal environments. Therefore, such a simplified process involved certain difficulties. Among the important factors that can influence the temperature distribution of cities, the existence of the seas or mountains is notable in terms of the effect on lowering temperatures (Ahn et al., 2007, 2010; Koo et al., 2007). On the other hand, one of the factors that increase temperatures is the concentration level of human activities (Inoue and Kimura, 2007; Ando et al., 2003). In this respect, Mikami (2005) used charts with the two axes based on the above two factors in classifying the spatial distribution of urban temperatures in Tokyo, Japan. The present study also selected the level of urban activities and the influence of large mountain areas as the two axes that determine the spatial distribution of temperatures in
Daegu. In addition, to evaluate the level of urban activities (energy consumption), the study findings of Ahn et al. (2002) were used.
While plane temperature distribution charts were exhibited based on various agregation methods thus far, their regional characteristics can be summarized as follows.
① The percentages of hours exceeding 30℃, daily maximum temperatures, and the number of tropical days are considered to exhibit the conditions of daytime temperatures. In this study, higher levels of daytime temperatures were exhibited toward the northern and northeastern regions from the downtown, and relatively lower levels of weekly temperatures were distributed toward the western and southwestern regions.
② The percentages of hours exceeding 25℃, daily minimum temperatures, and the number of tropical nights represent basic nighttime conditions. Temperatures during the respective hours were highest in Jung-gu, the city's central part and became lower in the outskirts farther from the city. In particular, night temperatures were low in Buk-gu, Dong-gu, and Dalseong-gun, which are adjacent to Mt. Palgongsan.
The city's subregions could be classified according to such characteristics of the spatial distributions of daytime and night temperatures.
Fig. 10. Thermal characteristics of Daegu in summer.
4. Conclusions
Identifying which factors determine regional temperatures is important in projecting the effects of urban heat island measures. Therefore, this study examined the spatial distributions of temperatures targeting the Daegu region based on the city's 2005 temperature data. The study findings are as follows.
Firstly, in a review of the hourly temperature distributions of Daegu during the summer, over the 31-day period (August 1 to 31), the number of days on which the daily maximum temperature was above 30℃ was 18 days, and the number of days on which the daily minimum temperature was above 25℃ was 11 days. The highest daily maximum temperature was recorded on August 5, at 36℃.
Secondly, in terms of the spatial distributions of the percentages of hours exceeding 30℃ and 25℃
respectively, the regions with the highest percentages of hours exceeding 30℃ mainly consisted of the downtown (Jung-gu), eastern (Dong-gu), and northern (Buk-gu) regions. The hours from which the temperature began to exceed 30℃ were concentrated on the hours after midday at which the temperature tend to rise to the highest levels throughout the day.
This suggests that the respective regions were also the regions in which daytime temperatures could easily rise. On the other hand, the percentage of hours exceeding 25℃ was notably high in the downtown centered around Jung-gu with 70% or above, and low in the outskirts with 65% or below.
Thirdly, looking at the spatial distributions of daily maximum temperatures and daily minimum temperatures respectively, the daily maximum temperatures were exhibited between 14:00pm to 15:00pm, and the daily minimum temperatures were exhibited between 5:00am to 6:00am. The daily maximum temperatures were observed to increase toward the northeastern regions, whereas the daily minimum temperatures were confirmed to have the highest levels in the
downtown.
Fourthly, in a review of the spatial distributions of the number of days with tropical days and the number of days with tropical nights, the number of days with tropical days was around 24 days and the number of days with tropical nights was around 13 days, representing 77% and 42% respectively. The largest number of days with tropical days was observed in the northern regions of Dong-gu and Buk-gu, which was 24 days. On the other hand, the southwestern region of Daegu had 22 or fewer days. The largest number of days with tropical nights was 14 days centered around the downtown, whereas the suburbs exhibited relatively low levels of 10 or fewer days.
Fifthly, in terms of the spatial distribution of average daily temperature differences (differences of daily maximum and minimum temperatures), Jung-gu, the city's central part, exhibited the lowest level of 7.2℃, and father northern regions resulted in corresponding larger daily temperature differences, with above 8.8℃ in Dong-gu and Buk-gu.
As reported thus far, the present study examined the conditions of Daegu's heat island effect based on an analysis of the data from the automatic weather observation stations in 17 sites installed in Daegu. In fact, the number of weather observation stations in Daegu is much lower those of Tokyo, Japan or Seoul (52 sites), Korea, which caused certain limitations in identifying the spatial distribution of the urban heat island in high resolution. Particularly, the city's automatic weather observation network was concentrated in the downtown and the eastern and western areas, whereas the sites of the network were limited in the suburbs surrounding Daegu. Consequently, this presented limitations in properly identifying the temperature distributions of downtown and suburban regions. Despite the fact, as shown in Fig. 1, the concentration of the automatic weather observation systems on Daegu's downtown was useful for identifying the thermal characteristics of the downtown
area. The present study's findings are considered to be utilized as the basic data to expand weather observation systems in Daegu. Since the summer of this year, as with the METROS100 in Tokyo, Japan, Daegu has developed the plan to obtain high- resolution temperature and humidity data by installing a number of temperature and humidity logs in the instrument screens of schools. Once this plan is implemented, the limitations of the current observation data in terms of insufficient spatial resolution are likely to be overcome.
Acknowledgement
The present study was conducted by the support of the project "Investigation on the changes of atmospheric-science standard terminology and a sudy on the development of standard glossary of atmospheric science(CATER 2012-2110)" by the Meteorological Technology Development Management Office.
References
Ahn, J. S., Kim, H. D., Hong, J. H., 2002, Estimation of the temporal and spatial distribution of anthropogenic heat in Daegu, J. Env. Sci., 19(3), 1045-1054.
Ahn, J. S., Kim, H. D., Kim, S. W., 2007, Estimation of urban heat island potential based on land-use type in summertime of Daegu, J. Env. Sci., 16(1), 65-71.
Ahn, J. S., Kim, H. D., Kim, S. W., 2010, Effect of difference of land cover conditions on urban thermal environment in Daegu using satellite and AWS data, J. Env. Sci., 19(3), 281-293.
Ando, H., Shioda, T., Morishima, W., Kojima, S., Ishii, K., Izumi, T., Mikami, T., 2003. Spatial structure of summer temperatures over the urban area of Tokyo in 2002, Annual Report of the Tokyo Metropolitan Research Institute for Environmental Protection 2003, Japan.
Howard, L., 1833, Climate of London deduced from meteorological observations, 3 vols, 3rd edn, Horver&
Darton, London, England.
Inoue, T., Kimura. F., 2007, Numerical experiments on
fair-weather clouds forming over the urban area in nothern Tokyo, SOLA, 3, 125-128.
Kim, H. D., 2011, The establishment of urban weather observation system and environment assessment of heat island, Meteorological technology and policy information, 4(2), 31-42.
Koo, H. S., Kwon, B. H., Kim, H. D., 2007, Observation study on the local wind of the Dalbi-valley located at ap-mountain in Daegu, J. Env. Sci., 16(1), 73-79.
Lowry, W. P., 1969, Weather in life, Academic press, New York.
Mikami, T., 2005, Urban abnormal climate of Tokyo, Yosensha, Tokyo.
Moriyama, 2004, Measures and technology of heat island(in Japanese), Gakugei- Syuppan, Tokyo.
National institute of meteorological research, 2009, Understanding climate change-Climate change of Daegu and Gyeongbuk, Seoul.
Shin, J. H., 2003, Characteristics of diurnal variation of surface temperature and heat island effect in Busan metropolitan city, Graduate school of education, Pukyong national university, Busan, Korea.