INTRODUCTION
Due to the limited resources and ever-increasing greenhouse gas emission, fossil fuels should be substituted for renewable bio-energy (United Nation of Framework Convention a Climate Change: UNFCCC). Anaerobic digestion has many environmental benefits including the production of a renewable energy carrier, the possibility of nutrient recycling and reduction of waste volumes
1-3). Different types of organic wastes have been anaerobic digested in a successful way, such as sewage sludge, industrial waste, slaughterhouse waste, fruit and vegetable waste, manure and agricultural biomass. The wastes have been treated separately and
in co-digestion processes
4-6).
Food waste and swine manure are the most abundant and problematic organic solid wastes in Korea. The amount of food waste produced in Korea is about 11,000 tons per day, accounting for 23% of municipal solid wastes
7). That of swine waste is about 150,000 tons/day, and approximately 5.7% of the produced swine waste is disposed by ocean dumping
8). It is the major source of odor production, vermin attraction, toxic gas emission and groundwater con- tamination, with being collected, transported, and landfill of solid wastes due to their high organic contents (food waste; volatile solid/total solid, 0.8-0.9) and moisture contents (food waste; 77-85%, swine manure; 67-74%). However, these wastes might be suitable for fermentative methane production, because one is carbohydrate-rich
4)and the other is high in alkalinity.
Potential Methane Production on Anaerobic Co-digestion of Swine Manure and Food Waste
JoungDu Shin
1)*, SangWon Park
1), Sang-Hyoun Kim
2), Jack Duangmanee
2), Po-Heng Lee
2), Shihwu Sung
2), and BongHoon Lee
1)1)
Department of Environmental Ecology, Agro-Environmental Division, National Institute of Agricultural Science and Technology, RDA, Republic of Korea
2)
Department of Civil, Concentration and Environmental Engineering, Ames, Iowa State University, USA (Received May 28, 2008, Accepted June 20, 2008)
ABSTRACT: Anaerobic co-digestion of swine manure and food waste for biogas production was performed in serum bottles at various volatile solids (VS) contents and mixing ratios of two substrates (swine manure : food waste = 100 : 0 ~ 0 : 100). Through kinetic mode of surface methodology, the methane production was fitted to a Gompertz equation. The ultimate methane production potential of swine manure alone was lower than that of food waste regardless of VS contents. However, it was appeared that maximum methane production potentials in 80 : 20 of the mixing rate at VS 3% was enhanced at 144.7%, compared to its only swine manure. The potential increased up to 815.71 ml/g VS fed as VS concentration and food composition increased up to 3.0% and 20%, respectively. The ultimate amount of methane produced had significantly a positive relationship with that of methane yield rate. Overall, it would be strongly recommended that feeding stocks use 20% of mixing ratio of food waste based on VS 3% contents when operating the anaerobic reactor on site at 35 ℃ if not have treatment of its anaerobic waste water.
Key Words: Anaerobic co-digestion, Cumulative methane yield, Gompertz equation, Swine manure, Food waste, Methane production
*
Corresponding author:
Tel: +82-31-290-0229 Fax: +82-31-290-0206 E-mail: [email protected]
145
Co-digestion of swine waste with organic carbon rich wastes has been accepted as an economic and feasible approach to retrofit conventional digesters
9,10). Methane produced by anaerobic digestion of food waste with swine waste can be easily converted to energy for a local community. Despite its potential benefit, successful application of the co-digestion of food waste and swine manure is rarely carried out in Korea. It is mainly because the knowledge on the digester operation is not mature yet (ex. optimum mixing ratio of swine manure and food waste).
The objectives of the current study were to predict the optimum mixing ratio based on different volatile solids (VS) and to find the relationship between mixing ratio of swine manure and food waste for potential methane production using a full quadratic model.
MATERIALS AND METHODS Seeding sludge
Seeding sludge was taken from an anaerobic digester in a local waste treatment plant. Once collected, the seeding sludge was stored in a refrigerator at 4℃
for one week before analyzing its volatile solids (VS) contents. Then it was pre-heated to 35 ℃ for 24 hours and inoculated with substrates. The VS concentration was 2.73%.
Substrate
A mixture of food waste and swine manure was used as substrate in this study. Food waste from a local restaurant was grinded by an electrical blender.
Swine manure was collected from a local swine farm.
The substrate was loaded into each incubation bottle (250 ml). The volatile solid (VS) content of the substrates was adjusted at 1, 2 and 3%, respectively. Physicochemical parameters as pH, TSS, VSS, T-N and T-P were determined according to Standard Methods
11). The physicochemical characteristics of substrate are presented in Table 1.
Digestion procedures
The experiment was conducted with 150 ml of working volumes using 250 ml of Duran bottles by 3 replications of split plot design. Main plots were 1, 2 and 3% volatile solids (VS). Total six treatments were made; swine manure and food waste were mixed at
the ratios of 100: 0 (T1), 80: 20 (T2), 60: 40 (T3), 40: 60 (T4), 20: 80 (T5) and 0: 100 (T6), respectively. Each bottle was added with 8.18 mL of seeding sludge and appropriate amount of swine manure and food.
Subsequently, the headspace of each bottle was flushed with N
2gas for 3 min, degassed 1 hour later with a glass syringe, and sealed tight with a clamp.
The bottles were then placed in a shaker at 35 ℃ and 100 rpm. The amount of biogas production was measured by using 20-200 ml of a glass syringe
12). At the same time, methane concentration of the produced gases was periodically determined. Methane content in the biogas was measured by a gas chromatography (GC: Varian CP3800) with a thermal conductivity detector and a 1.0 m × 2 mm stainless steal packed column with N
2gas as a carrier. The temperatures of detector and column were kept at 189 and 40 . ℃
Kinetic Model
In many biological fields, the basic knowledge of phenomena is insufficient to build a mechanistic model. In this case, responding to surface methodology, an empirical model or a statistical analysis can be formulated to elucidate basic mechanisms underlying a complex system and thus providing better guidance in process design and control
13). In this study, the effect of mixing ratios of swine manure and food waste to methane production in the anaerobic digester was analyzed using a Gompertz model
14)as shown below.
exp exp
m(
0) 1
p m
m
M P R x x e
P
⎡ ⎧ ⎫ ⎤
= ⎢ − ⎨ − + ⎬ ⎥
⎩ ⎭
⎣ ⎦ (Eq. 1)
where M
pwas cumulative methane production (ml), Table 1. Physicochemical characteristics of substrate used in this study
Parameters Swine manure Food waste
pH (1 : 5) 7.6 4.5
Electrical Conductivity
(mS/cm) 3.4 13.6
Total Solid (%) 30.7 20.4
Volatile Solid (%) 20.5 16.3
Total Nitrogen (%) 4.0 3.0
NH
4‐ N (mg/kg) 565.0 682.4
NO
3‐ N (mg/kg) 13.6 8.1
Total Phosphorus (%) 28.7 31.0
P
mwas ultimate methane production (ml), R
mwas methane production rate (ml/day), x
0was lag-phase time (days), and e was exponential 1.
All the parameters in the above equation were evaluated by performing regression with a Newtonian algorithm to minimize the sum of the square errors (SSE) between the experiment and estimation using Sigma plot version 10.0. The goodness of the parameter fit was diagnosed by SSE, correlation coefficient (R
2), standard errors (SE), 95% of confidence limits, t-test, and F-test.
RESULTS AND DISCUSSIONS
Estimation of Methane Production Potential using the Logistic Regression Model
The regression model provided in Eq. (1) was applied to fit the methane production profiles and the goodness of each fit was determined using the model p value.
The cumulative methane production curves from the 3 VS levels and 6 mixing ratios were well described with Eq. (1). All the model p values were less than 0.0001 in Table 2, suggesting that the regression model is statistically significant. Although the hydrogen production curve was fitted to a modified Gompertz equation
15), which was used as a suitable model for describing the hydrogen production in a batch system
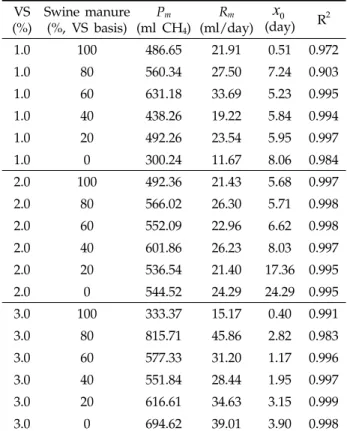
16-18), it was observed that Gompertz model was also proper to predict the methane production with co- digestion of food waste and swine manure. Fig. 1 illustrates that the maximum methane production potential was varied from 300.24 to 815.71 ml/g VS fed, but these values were higher than the reported
maximum values, 268, 229 and 213 ml/g VS fed, from co-digestion with cow manure and crop residues such as grass, sugar beet top and straw, respectively
19). It was observed that the maximum methane production potentials were 631.18 for T3, 601.86 for T4 and 815.71 ml/g VS fed for T2, mixing ratio, based on VS 1, 2 and 3%, respectively. The ultimate methane production from the reactor with only swine manure was not consistently enhanced, but its food waste did with
Table 2. Model parameters identified from regression of the methane production profiles
(%) VS Swine manure (%, VS basis) P
m(ml CH
4) R
m(ml/day)
0x
(day) R
21.0 100 486.65 21.91 0.51 0.972
1.0 80 560.34 27.50 7.24 0.903
1.0 60 631.18 33.69 5.23 0.995
1.0 40 438.26 19.22 5.84 0.994
1.0 20 492.26 23.54 5.95 0.997
1.0 0 300.24 11.67 8.06 0.984
2.0 100 492.36 21.43 5.68 0.997
2.0 80 566.02 26.30 5.71 0.998
2.0 60 552.09 22.96 6.62 0.998
2.0 40 601.86 26.23 8.03 0.997
2.0 20 536.54 21.40 17.36 0.995
2.0 0 544.52 24.29 24.29 0.995
3.0 100 333.37 15.17 0.40 0.991
3.0 80 815.71 45.86 2.82 0.983
3.0 60 577.33 31.20 1.17 0.996
3.0 40 551.84 28.44 1.95 0.997
3.0 20 616.61 34.63 3.15 0.999
3.0 0 694.62 39.01 3.90 0.998
VS 1%
Digestion periods(days)
0 20 40 60
Cumulative CH4 production(ml/g VS fed) 0 200 400 600 800 1000
T1 T2 T3 T4 T5 T6
VS 2%
Digestion periods(days)
0 20 40 60 80 100 120 140
Cumulative CH4 production(ml/g VS fed) 0 200 400 600 800
T1 T2 T3 T4 T5 T6
VS 3%
Digestion periods(days)
0 20 40 60 80
Cumulative CH4 production(ml/g VS fed) 0 200 400 600 800 1000
T1 T2 T3 T4 T5 T6
Fig. 1. Fitting results of the Gompertz model to methane production profile according to different volatile solids.
increasing VS contents. The higher methane production from the proper mixed reactor with swine manure and food waste was again attributed to the increased carbon contents
Effects of mixing ratios based on VS contents on digestive methane production
Table 2 shows that each variable of the model was calculated with different treatment for methane pro- duction potential. The activity of methane production bacteria would be decreased if too much food waste was provided (Table 2 and Fig. 1). It is because methanogenic activity can be affected by the low pH or high salt contents from the waste. It was appeared that maximum methane production potentials in the T3, T4 and T2 for the mixing rate at VS 1, 2 and VS 3% were great at 29.7, 22.2 and 144.7%, respectively
compared to their only swine manure (Table 2). For the lag phase time, the more food waste contains the more it prolonged except T2 at VS 1 and 2%.
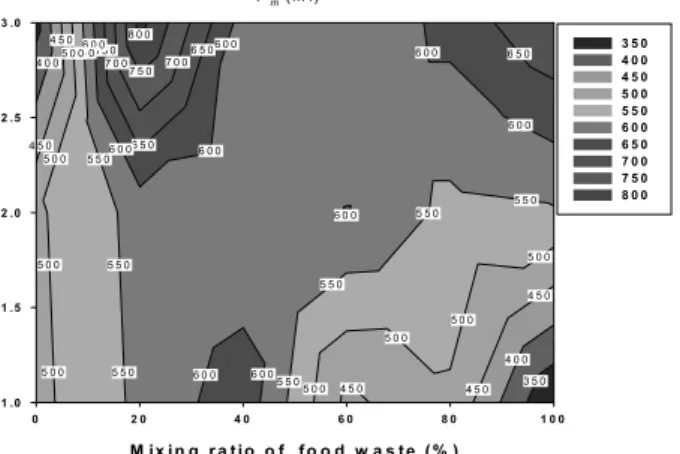
Fig. 2 illustrates that the ultimate methane production potential was found to be higher than 300.24 ml/g VS fed at all VS concentration and waste composition of 0 : 100 (swine manure : food waste). The potential increased up to 815.71 ml/g VS fed as VS concentration and food composition increased up to 3.0% and 20%, respectively. Swine manure showed lower methane production potential than food waste. Less methane production from swine waste can be attributed to its relatively lower organic contained than food waste.
Overall, it would be strongly recommended that feeding stocks use 20% of mixing ratio of food waste based on VS 3% contents when operating the anaerobic reactor on site at 35 ℃ if not have treatment of its anaerobic waste water.
The ultimate amount of methane produced had significantly a positive relationship with that of methane yield rate as shown in Fig. 3. It was observed that the ultimate methane yield was comparable to the methane yield rate.
CONCLUSIONS
The objectives of the current study were to predict the optimum mixing ratio based on different volatile solids (VS) and to find the relationship between mixing ratio of swine manure and food waste for potential methane production using a full quadratic model.
Through kinetic mode of surface methodology, the methane production was fitted to a Gompertz equation. It was appeared that maximum methane production potentials in 80 : 20 of the mixing rate at VS 3% was enhanced at 144.7%, as compared to its only swine manure. The potential increased up to 815.71 ml/g VS fed as VS concentration and food composition increased up to 3.0% and 20%, respectively.
It was observed that there was positive linear relationship between ultimate methane yield and methane yield rate. Overall, it would be strongly recommended that feeding stocks use 20% of mixing ratio of food waste based on VS 3% contents when operating the anaerobic reactor on site at 35 ℃ if not have treatment of its anaerobic waste water.
Pm (m l)
6 5 0
6 0 0 6 0 0
5 5 0 5 5 0
5 5 0 5 5 0
5 0 0 5 0 0
5 0 0 5 0 0
4 5 0 4 5 0
4 0 0 3 5 0 6 0 0
4 5 0
6 0 0 6 0 0
8 0 0 7 5 0 7 0 0 7 0 0
6 5 0
6 5 0
6 5 0 6 0 0
6 0 0 6 0 0 6 0 0
5 5 0 5 5 0 5 5 0 5 5 0
5 0 0 5 0 0 5 0 0
5 0 0
4 5 0 4 5 0 4 0 0
M ix i n g r a t io o f f o o d w a s t e ( % )
0 2 0 4 0 6 0 8 0 1 0 0
1 .0 1 .5 2 .0 2 .5 3 .0
3 5 0 4 0 0 4 5 0 5 0 0 5 5 0 6 0 0 6 5 0 7 0 0 7 5 0 8 0 0
Fig. 2. Changes of ultimate methane yield (ml) to VS contents vs. mixing ratios of food waste.
Rm (ml/day)
0 10 20 30 40 50
Pm (ml)
200 300 400 500 600 700 800 900