Print ISSN: 2288-4637 / Online ISSN 2288-4645 doi:10.13106/jafeb.2020.vol7.no9.191
Sectoral Contribution to Economic Development in India:
A Time-Series Co-Integration Analysis
Sandip SOLANKI
1, Krishna Murthy INUMULA
2, Asmita CHITNIS
3Received: July 03, 2020 Revised: July 19, 2020 Accepted: August 10, 2020
Abstract
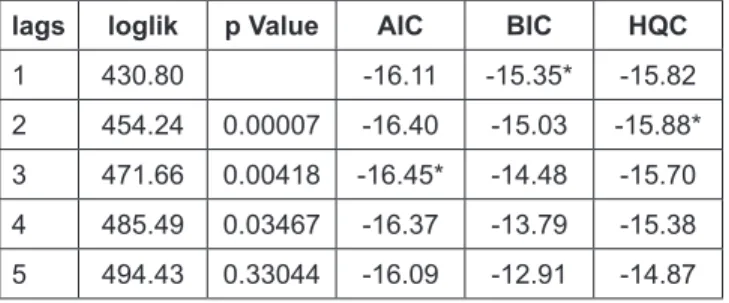
This research paper examines the causal relationship between India’s economic growth and sectoral contribution to Gross Domestic Product (GDP) and vice versa, in the short-run and long-run, over a 10 years time period. Johansen’s method of cointegration is used to study the cointegration between the sectoral contributions to Indian GDP vis-à-vis India’s economic growth. Further, the route of interconnection between economic growth and sectoral contribution is tested by using Vector Auto Regression (VAR) model. Special attention was given for investigating impulse responses of economic growth depending on the innovations in sectoral contribution using time-series data from 1960 to 2015. This paper highlighted a dynamic co-relationship among industrial sector contribution and agricultural sector contribution and economic development. In the long run, one percent change in industrial sector contribution causes an increase of 3.42 percent in the economic growth and an increase of 1.12 percent in the primary sector contribution, while in the short run industrial and service sector contributions showed significant impact on economic development and agriculture sector. The changing composition of sector contribution is going to be an important activity for the policymakers to monitor and control where the technology and integration of sectors play a significant role in economic development.
Keywords: Economic Growth, Economic Sectors, Econometrics Analysis, Co-integration, India JEL Classification Code: C22, L60, O11
huge variations in economic growth of the country. The import substitution regime (1960-80) or the inward-looking policy regime, saw a significant decline in the agriculture contribution giving rise to non-agriculture contribution that resulted into the per-capita gross domestic product of the country to rise. Most of the economists believe that during this period of substitution regime, India’s structural transformation from a primary sector to non-primary sector economy replaced the agriculture domination with non- agriculture industrial growth.
In the reform phase (period after the year 1991-92), policies of economic liberalization and subsequent impact of globalization increased India’s domestic and foreign trade capabilities, which came at par with the other developing countries. Post-independence, the Indian policymakers also made conscious efforts to boost the agriculture sector with the help of green revolution and subsequent innovations in cultivation practices. In India, agriculture contribution (14.39%) to India’s economy is much higher than world’s average (6.4%) as per records of 2019. The liberalization regime (1980-2004) witnessed a steady growth (yet comparatively slower than earlier substitution regime) in
1. Introduction
India, with a GDP value of about 2.9 trillion dollar, became the seventh largest economy in the world, and looking at the buying power, India is positioned as the third biggest economy on the planet. The structural transformation of Indian economy under different policy regimes saw an uneven growth patterns in the sectoral composition causing
1
First Author and Corresponding Author. Associate Professor, Symbiosis Institute of International Business (SIIB), Symbiosis International (Deemed University), (SIU), India [Postal Address: Hinjawadi, Pune - 411057, Maharashtra, India]
Email: [email protected]
2
Associate Professor, Symbiosis Institute of International Business (SIIB), Symbiosis International (Deemed University), (SIU), India.
Email: [email protected]
3
Director, Symbiosis Institute of International Business (SIIB), Symbiosis International (Deemed University), (SIU), India.
Email: [email protected]
© Copyright: The Author(s)
This is an Open Access article distributed under the terms of the Creative Commons Attribution Non-Commercial License (https://creativecommons.org/licenses/by-nc/4.0/) which permits unrestricted non-commercial use, distribution, and reproduction in any medium, provided the original work is properly cited.
structural transformation from agriculture to industry.The license raj system eroded the benefits of sustainable trade and led to the imperfect competition among the industrialists and even increased corruption levels across the country.
The economic reforms regime (post-1991) gave more thrust to agriculture to further increase its contribution to the economy; as of now (2019) the share of Indian primary sector to the country’s GDP stood at around 14%. During the reforms’ period (abolition of license raj system) the opening of the economy resulted in exploring the full potential of the industry by its diversification from basic traditional iron and steel to jute and automobiles. As per the year ending 2019, the share of India’s industry sector to the country’s GDP stood at around 29%, almost double of agriculture contribution.
The advancement in science and technology has created more innovative services adds to the conventional service sector, which comprises banking, finance, telecommunications, and business process outsourcing, currently regarded as the backbone contributing around 57% of the economy. With the emergence of information technology (IT) and information technology-enabled services, India has become the largest provider of the best technology manpower with a great demographic dividend, and has become one of the major IT hubs of the world. The recent development in the banking and financial services has offered more inclusive growth in the country, facilitating the much needed and easier economic reforms for financial inclusion. Because of the innovations and customer feedback loops, more employment opportunities are offered in the service sector compared to agriculture and industry.
Diversification and privatization of different services such as travel, tourism, medical sectors, etc., have contributed to raise service sectors’ competencies. However, the country’s transformation from primary sector to tertiary sector has its own advantages and disadvantages.
India’s external trade has a significant impact on the economic development of the country. The service sector contributes more to the external trade in terms of high technology exports compared to the agriculture and industrial output, namely, agricultural products, engineering goods, chemicals & marine products, textiles, plantations, petroleum, and leather goods. The Make in India initiative which was tossed in the year 2014 by the government is a one-step forward movement to promote agriculture and industrial exports. The three major aims of this initiative are first to push up the secondary sector growth rate to 12-14%
per annum, second to generate one hundred million additional manufacturing job opportunities in the country before 2022, and third to endorse secondary and allied exports.
The rate of technological change is not the same across the sectors causing uneven growth in sector wise performance and results in unbalanced economic growth in the country. In
the agriculture sector, besides the very limited technological innovations, the resource-based constrains such as farmer’s inability to pay back loans, lack of minimum price support by the government, abnormal cultivation practices, lack of technical knowhow, and urbanization are causing distress in the farming community. The time reversal of the role and contribution of agriculture and service sectors in India is a matter of utmost importance for the policymakers to strive for a balanced economic growth in the country. Because of rapid urbanization and changing lifestyles, there is a need for innovations to create a balanced mix of three-sector composition to provide more employment opportunities to the next generation. Therefore,there is a requirement to better understand the current sectoral composition of the country and take suitable policy decisions for the development of a balanced economic.
The paper is organized as follows: Section 2 gives a brief literature review explaining different types of research that have been led so far in various economies of the world.
Section 3 details different econometric methods that are used in this study. Section 4 gives results of this study, followed by conclusions in Section 5.
2. Literature Review
Scholars have tried to understand the causal association between economic growth and sectoral contributions to GDP and vice versa for different countries in the short run as well as long run. For example, in studies by Hwa (1988); Sastry, Singh, Bhattacharya, and Unnikrishnan (2003), the results inferred that the agricultural sector is still dominating and contributes significantly to the overall economic growth in general. Gollin, Parente, and Rogerson (2002) argued that agricultural productivity contributes significantly to economic development with the help of structural transformation model. The paper also highlighted that reason for slow industrialization. In yet another study,Turan Katircioglu (2006) revealed that agricultural output and economic growth are co-integrated and also have bidirectional causation among them in the long run. In a similar study, Awokuse (2009) indicted that the primary sector has emerged as very significant force for economic development in 15 emerging as well as transition countries in Africa, Asia and Latin America.
In another research in China by Xuezhen, Shilei, and Feng
(2010), an econometric model analysis was performed for the
period 1952-2007, showing an positive connection between
the primary sector and economic growth also highlighting
that the primary sector is significantly contributing to
economic growth. In yet another empirical study, Jatuporn,
Chien, Sukprasert, and Thaipakdee (2011) using time series
analysis, the paper investigated a long-run interelationship
between the primary sector growth and economic growth and
vice versa from 1961 to 2009 in Thailand.
But, there are studies in the literature where authors have denied the linkage of agriculture with economic growth. For example, Katircioglu (2004) demonstrated that, in spite of agriculture being the backbone of the North Cyprus economy, the agricultural sector does not contribute significantly to the economic development. The result also reveals that there is co-integration between real GDP and industrial output and the service sector.
Nemours’ research examined the causal connection among secondary sector growth and economic development, between service sector growth and economic growth and between agricultural growth and economic growth over the short run as well as the long run. Tregenna (2008) identified that the manufacturing sector was an important sector for creating demand in the service sector as well as the economy as a whole through its strong backward linkages for the South Africa. Similarly, Szirmai (2012) showed that the secondary sector has significantly contributed to the development of the economy, but cannot be considered as an engine of economic growth;the study was conducted in 67 emerging nations and 21 advanced nations during the period 1950-2005. Matahir (2012) showed that the primary and secondary sectors are cointegrated in the long run as well as found one-way causality direction from the industrial sector to the agricultural sector over the short and long run for the period from 1970 to 2009 in Malaysia. Other researchers have also identified the significant role of various sectors in the economic development, e.g., Bhattacharya and Mitra (1989),who inferred that relative growth of income and employment in both sectors, namely, secondary and tertiary, significantly affected the nature of the agriculture-industry relationship.
Echevarria (1997) and Verner and Fiess (1999) explored the relationship between sectoral composition and economic development. Results highlighted that sectoral composition also effects the growth and vice versa. Gemmell, Lloyd, and Mathew (1998) used time-series econometric techniques for investigating linkages between agricultural, manufacturing and service GDPs (and productivity) in Malaysia. Results suggested significant impact of both manufacturing and service sectors on agricultural productivity in the long run. In other study, Block (1999) calculated macroeconomic growth multipliers resulting from income shocks to the primary sector, modern and traditional secondary sector in Ethiopia.
Verner and Blunch (1999) conducted a study on three African economies and found that at least one statistically significant long-run relationship for sectoral GDP through comprising sectoral growth.
The importance of such linkages was further stressed by Gani and Clemes (2002) who revealed that growth of tertiary activities exercises a statistically significant positive effect. Moreover, results also highlighted a strong positive effect of growth in secondary sector and
government expenditure on tertiary activities. Clemes, Arifa, and Gani’s (2003) findings showed a robust, positive bi-directional effect of growth of tertiary sector and secondary sector of ASEAN economies. Similarly Craigwell, Downes, Greenidge, and Steadman (2008) investigated relationships between the primary sector, secondary sector and tertiary sector over the long run and short-run in Barbados over the past five decades. Results showed one cointegrating relationship in both the sub- periods. Furthermore, Subramanian, Saghaian, Maynard, and Reed (2009) showed that tertiary sector was found to be the major driver of development of both sectors, namely, primary and secondary, during initial phases of development in Poland and Romania. Eddine (2010), in his empirical study, found all Tunisian economic sectors to be co-integrated and showing unidirectional movement. Rahman, Rahman, and Hai-bing’s (2011) results indicated that primary and secondary sectors are the most significant factors of the GDP of Bangladesh.
Interestingly, in this study, the service sector did not emerge as an influencing factor for the GDP growth;
however, GDP was recognized as a most important driver for the tertiary sector growth.
Hussin and Yik (2012) undertook a study of Indian and Chinese economies. They used a time-series analysis to study the sectoral composition and its impact on the economic development. The results found that each sector has a robust, positive and substantial linear relationship with economic growth in both economies. The study was conducted over the period between 1978 and 2007. In addition, the results of multiple regression analysis showed a positive relationship between primary, secondary and tertiary sectors with the GDP per capita in both countries India and China. Sepehrdoust and Hye (2012) in their study of Iranian economy, explored the relationship between the variables gross domestic product (Y), industrial value added (IN), agricultural value added (AG), services value added (SS) and oil and gas value added (O and S). The study indicated that one percent rise in industrial value added (IN), agricultural value added (AG), services value added (SS) and Gas, caused the GDP to rise by 0.216, 0.091, 0.431 and 0.156 percent, respectively, for the period 1959-2010 in Iran.
Burren and Neusser (2013) highlighted the shift of the
US economy from good-producing to the service sector-
driven economy. In this study, 30% of the decline in GDP’s
unpredictability was due to the service sector in spite of some
sectors found to be even more volatile. Singaariya and Sinha
(2015) also indicated the presence of bidirectional causality
between primary sector and economic growth, while the
unidirectional causality between the secondary sector and
economic growth and that between the primary and secondary
sector in India. In another study of the Bangladesh economy,
by Uddin (2015), over the period from 1980 to 2013, each
economic sector (agriculture, industry and services) was found to have a strong, positive and significant linear relationship with the country’s economic growth. The study done by Alhowaish and Al-Shihri (2015) found that there is a bidirectional causality among the sectoral output of the Saudi economy in the short run. Recently, Malikov, Qineti, Pulatov, and Shukurov (2016) indicated that agriculture still dominates in terms of employment in Uzbekistan. Islam, Ahmed, Saifullah, Huda, and Al-Islam’s (2017) study used VAR model and suggested that industrial production and GDP per capita have a significant relationship with carbon emission.
Popoola, Araromi, Rafiu, and Odusina (2017) revealed that the agriculture sector makes the highest contribution to the growth of the economy, followed by the manufacturing and oil sectors, respectively, while the least contribution was made by building and construction in Nigeria. Cantore, Clara, Lavopa, and Soare (2017) used the Generalized Method of Moments (GMM) technique on 80 countries to treat the endogeneity bias for the period between 1980 and 2010. The findings highlighted that the secondary sector is an engine of economic growth.
Gabriel and Santana Ribeiro (2019) observed that growth multipliers were 1.54 for primary sector, 1.80 for tertiary sector, 1.34 for modern industry, and 1.22 for traditional industry. Findings showed that intersectional connections are operated on a significantly uneven basis.Khan (2020) used simulation technique to study the Nepalese economy.
The results of this study inferred that labor productivity as well as sectoral contribution have favorable effects on growth, welfare and household income of Nepal.Kumar and Paramanik (2020) showed that economic growth rate is affected positively by financial development in the long run, while Luong, Nguyen, and Nguyen (2020) revealed that economic growth indicators have negative and statistically significant impact on the shadow economy.
Moreover, Ngo, Cao, Nguyen, and Nguyen (2020) highlighted that FDI is affected by size of market and Nurlanova, Omarov, and Satpayeva (2020) identified that innovative activities is most important factor affecting sustainable development
From the review of the literature it can be observed that sectoral contribution and its impact on the economic development of various nations remained a topic of most relevant research. A number of studies has been conducted in the past on various economies about this relationship.
To the best of our knowledge, no study has been done in the recent past, which explores the sectorial contribution to Indian economic growth using a time-series co-integration analysis.
In this paper, an attempt has been made to study various sectoral contributions to the Indian economic growth using
co-integration analysis method for the time period from 1960 to 2015.
3. Data and Methods 3.1. Data and Scope
This research uses time-series annual data from 1960 to 2015 on four economic indicators, namely, GDP per capita in current US dollars, agriculture value added (% of GDP), industry value added (% of GDP), and services value added (% of GDP)”, collected from World Bank open data website (data.worldbank.org). Since independence, India has undergone a sectoral shift from agrarian economy to a service-based economy in spite of the majority of rural population is engaged in agriculture and semi-agricultural practices, which is keeping the industry growth performance to a moderate level during the study period.
This research studies the causal association between economic development and sector contribution and vice versa.
This study uses an endogeneity framework, which facilitates each variable as a study variable or dependent variable, so that the interrelationships among the variables can be captured through the causality flow between the variables.
3.2. Econometric Method
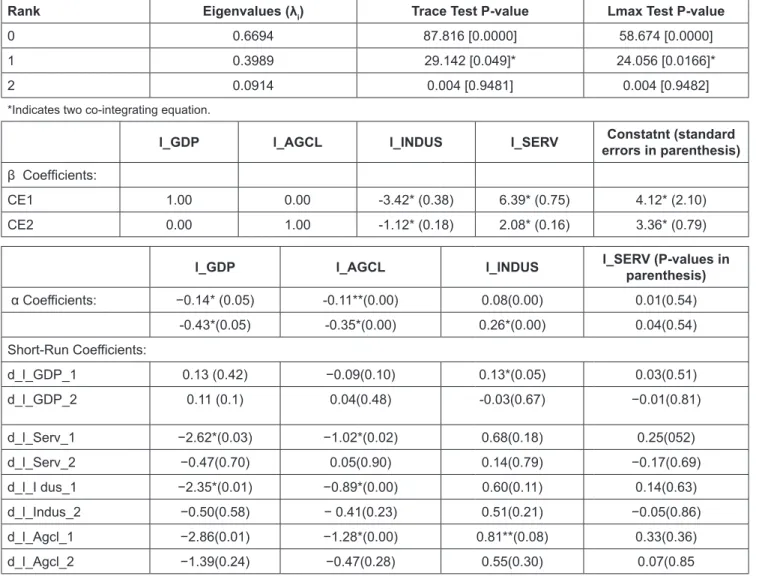
This study uses Johansen’s method (1988, 1991) to study the cointegration between the sectoral contributions to Indian GDP vis-à-vis economic growth. In addition to Johansen’s method, the Engle-Granger causality technique is also employed to determine the direction of the causality by using the vector auto regression (VAR) framework. The study of co- integration requires that the time-series data are assumed to be stationary and hence it is tested for possible non-stationary.
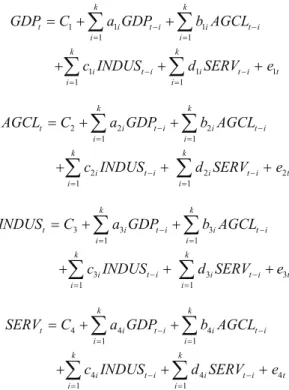
Augmented Dickey Fuller (ADF) test is used as well to confirm the stationary and non-stationary of the level and first differenced variables. The selection of lag length is based on the best of three information criterion scores, namely,Akaike Information criterion (AIC), Schwartz Bayesian criterion (BIC), and Hannan-Quinn criterion (HQC).
The simultaneous equation system (VAR) facilitates each
variable to be considered as endogenous on each other for
determining the significant impact of each variable on each
other. The direction of the causal relations between the study
variables is also tested for determining which variable can
cause the other variables, and the information of causal flow
between the variables is at most important in model building
and prediction. The following VAR framework is used in
this study to explore the relationship among the agriculture,
industry and services sectors of the Indian economy, with
economic growth.
1 1 1
1 1
1 1 1
1 1
k k
t i t i i t i
i i
k k
i t i i t i t
i i
GDP C a GDP b AGCL c INDUS d SERV e
− −
= =
− −
= =
= + +
+ + +
∑ ∑
∑ ∑
2 2 2
1 1
2 2 2
1 1
k k
t i t i i t i
i i
k k
i t i i t i t
i i
AGCL C a GDP b AGCL c INDUS d SERV e
− −
= =
− −
= =
= + +
+ + +
∑ ∑
∑ ∑
3 3 3
1 1
3 3 3
1 1
k k
t i t i i t i
i i
k k
i t i i t i t
i i
INDUS C a GDP b AGCL c INDUS d SERV e
− −
= =
− −
= =
= + +
+ + +
∑ ∑
∑ ∑
4 4 4
1 1
4 4 4
1 1
k k
t i t i i t i
i i
k k
i t i i t i t
i i
SERV C a GDP b AGCL c INDUS d SERV e
− −
= =
− −
= =