한수지 53(5), 773-783, 2020
773
Copyright © 2020 The Korean Society of Fisheries and Aquatic Science pISSN:0374-8111, eISSN:2287-8815 Korean J Fish Aquat Sci 53(5),773-783,2020
Original Article
서 론
우리나라는연안해역에서어류
,
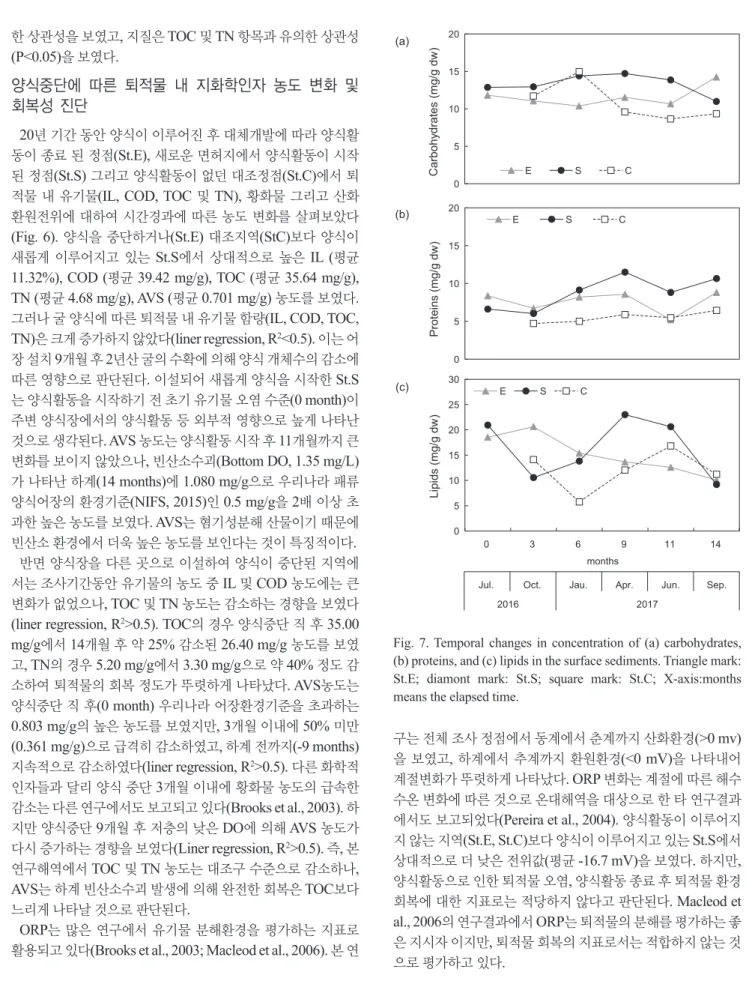
패류,
해조류등다양한품종 을양식하고있으며,
특히패각류(Bivalves)
생산량은중국다 음으로높다(FAO, 2020).
전체패류양식생산량의약74%
는 굴이며,
굴양식생산량은1990
년에약20
만톤에서2019
년기 준약30
만톤으로꾸준히증가하고있다(MOF, 2020).
패류양 식은경상남도와전라남도연안해역을중심으로성행하고있으며
, 2018
년기준우리나라전체굴생산량의81%
가경상남도에서생산되고있다
(MOF, 2020).
경상남도의경우통영및거제시관할칠천도
,
가조도,
원문만에양식장이밀집되어있 고,
참굴과피조개양식생산량이높으며(NFRDI, 2002),
특히 원문만은수하식패류양식이가장활발하다(Cho et al., 1982).
우리나라는태풍
,
파랑등외력으로부터안정되고접근성이 좋은내만에서밀집된양식을하고있으며,
적절한어장휴식없 이장기간해수면(
공유수면)
을이용해왔다.
어류양식장은인위 적인사료공급에의해미섭이된사료와어류의배설물질등이 퇴적층바닥으로침강하여퇴적물내유기물의축적률이높다굴(Crassostrea gigas)양식 중단 이후 퇴적물 질 회복에 관한 지화학적 지표 탐색
심보람 1,4 ·김형철 2 *·강성찬 1 ·이대인 1 ·홍석진 3 ·이상헌 4 ·김예진 4
1국립수산과학원 어장환경과, 2국립수산과학원 연구기획과, 3국립수산과학원 갯벌연구센터, 4부산대학교 해양학과
Geochemical Indicators for the Recovery of Sediment Quality after the Abandonment of Oyster Crassostrea gigas Farming in South Korea
Bo-Ram Sim
1,4
, Hyung Chul Kim2
*, Sungchan Kang1
, Dae-In Lee1
, SokJin Hong3
, Sang Heon Lee4
and Yejin Kim4
1Marine Environment Research Division, National Institute of Fisheries Science, Busan 46083, Korea
2Research and Development Planning Division, National Institute of Fisheries Science, Busan 46083, Korea
3Tidal Flat Research Center, National Institute of Fisheries Science, Gunsan 54001, Korea
4Department of Oceanography, Busan National University, Busan 46241, Korea
In order to evaluate the recovery of fishing ground environment after the cessation of aquaculture farming, we ex- amined the variation in sediment quality over time using different geochemical factors and investigated whether these factors are indicators of sediment quality recovery. The study area was an oyster Crassostrea gigas , farm in Tongyeong, Geyongsangnam-do, South Korea, where aquaculture activities had been carried out for 20 years, and the changes in water and sediment environment were monitored for 14 months after the abandonment of the farm.
The mean water depth was 14 m, with a tidal range of 3 m, and seawater current velocity ranged from 4.7 to 7.0 cm/s.
After the abandonment of the farm, total organic carbon and total nitrogen concentrations in the surface sediments decreased significantly over time compared to those in the control site; in particular, immediately after farm abandon- ment, acid-volatile sulfide concentrations decreased relatively rapidly. Carbohydrate and protein concentrations in the sediments showed no significant changes; however, lipid concentrations markedly decreased. Further studies on other aquaculture taxa and various aquaculture areas are needed to establish new policies for environmental management of fishing grounds, such as relocation of fishing grounds and determination of optimal fallowing periods.
Keywords: Oyster farm, Recovery of sediment quality, Organic enrichment, Cessation of farming, Fallowing period
*Corresponding author: Tel: +82. 51. 720. 2822 Fax: +82. 51. 720. 2515 E-mail address: [email protected]
This is an Open Access article distributed under the terms of the Creative Commons Attribution Non-Commercial Licens (http://creativecommons.org/licenses/by-nc/3.0/) which permits unrestricted non-commercial use, distribution, and reproduction in any medium, provided the original work is properly cited.
Received 24 September 2020; Revised 15 October 2020; Accepted 16 October 2020 저자 직위: 심보람(연구원, 대학원생), 김형철(연구사), 강성찬(연구원), 이대 인(연구사), 홍석진(연구사), 이상헌(교수), 김예진(대학원생)
https://doi.org/10.5657/KFAS.2020.0773
Korean J Fish Aquat Sci 53(5), 773-783, October 2020
심보람
ㆍ
김형철ㆍ
강성찬ㆍ
이대인ㆍ
홍석진ㆍ
이상헌ㆍ
김예진774
(Mazzola et al., 2000; Crawford et al., 2003).
반면패류양식의 퇴적환경오염도는어류양식에비해상대적으로적다고알려 져있다(Grant et al., 1995; Yokoyama, 2002).
하지만해조류(
미역,
다시마등)
를섭식하는전복을제외하고패류는여과식자(filter feeder)
또는퇴적물식자(deposit feeder)
로서수층의식 물플랑크톤,
입자성유기물질및퇴적층내유기물질등을섭이 하여성장하기때문에해수및퇴적물의오염정화순기능이있지만많은양의배설물
(faeces)
을환경중으로배출하여 양식장퇴적환경에많은유기물을공급한다
(Baudinet et al., 1990;
Hargrave, 1994; Danovaro et al., 2004).
통영패류양식장에서 는양식생물로부터약2.9 ton/day/km
2의배설물이저층바닥 에침적되며특히진해만은약4.5 ton/day/km
2이침적되어1.6
배높은부하량을보였다(Lee et al., 2000).
이와같이진해만은 퇴적환경내유기물농도가높고빈산소수괴가자주발생하는 등연안환경이점차악화되고있어수층뿐만아니라퇴적환경 에관하여많은조사가수행되었다(Kim et al., 2012; Cho et al., 2013; Jung et al., 2014; Choi et al., 2017).
진해만에서퇴적물 오염의주요원인으로양식생물로부터환경중에배출되는배 설물등에서유래된다는연구결과가있다(Cho, 1991).
많은나라에서양식장내퇴적환경을다양한인자에대해기 준을설정하여모니터링하고관리하고있다
(Ervik et al., 1997;
YoKoyama, 2003; FOC, 2018).
양식을통해오염된퇴적환경 을저비용,
친환경적으로개선하기위한방법중하나는일정기 간양식활동을휴식(fallowing)
하는것이다.
어장휴식에따른퇴적환경회복
(recovery)
기간과평가인자를탐색하는 연구가노르웨이
,
캐나다,
뉴질랜드등에서수행되었다(Karakassis et al., 1999; Brooks et al., 2003; Macleod et al., 2006; Keeley et al., 2014).
대부분연구대상은어류(
연어,
송어,
돔등)
양식장이 었으며패류양식장에대한조사는거의없었다.
어장환경회복에관한연구에서적용된주요화학적인자로는유기물
(organic
matter),
총유기탄소(total organic carbon, TOC),
황화물(sul-
fide),
산화환원전위(oxidation-reduction potential, ORP)
가있 으며,
이외에도철(Fe),
아연(Zn),
구리(Cu)
등과같은미량금 속또는총인(total phosphate),
지질(lipids, fatty acids, sterols)
등다양한항목들이지역적특성과연구목적등에따라적용되 었다.
장기간고밀도양식이이루어져어장환경이상대적으로 좋지않은남해안에서어장시설물이동(
재배치)
과이에따른환 경인자의변화를모니터링하고회복가능성을진단하는연구는 어장환경관리측면에서매우중요하다.
이러한배경을바탕으 로본논문은처음으로우리나라에서대체개발에따라굴양식 장이이동된후퇴적물내화학적인자들의변화와회복양상에 관하여연구하였다.
또한양식시설이새롭게설치된해역에서 양식활동에따른오염의진행에관한연구도함께수행하였다.
이를바탕으로어장회복과휴식기간과의상관성을파악하고,
현재어장관리법제11
조2
에따라어류양식장에만국한되어있 는어장환경평가제도에서평가품종확대에따른패류양식장의 퇴적물오염실태와변화과정을이해하기위한기초자료로활용 할수있을것이다.
재료 및 방법
조사해역
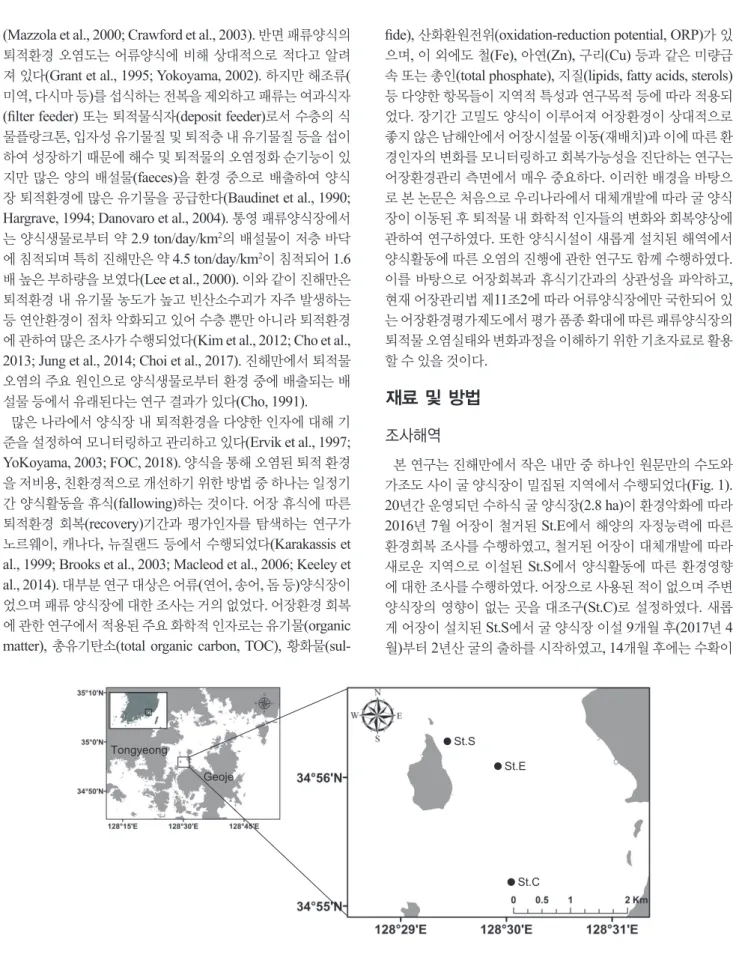
본연구는진해만에서작은내만중하나인원문만의수도와 가조도사이굴양식장이밀집된지역에서수행되었다
(Fig. 1).
20
년간운영되던수하식굴양식장(2.8 ha)
이환경악화에따라2016
년7
월어장이철거된St.E
에서해양의자정능력에따른 환경회복조사를수행하였고,
철거된어장이대체개발에따라새로운지역으로이설된
St.S
에서양식활동에따른환경영향에대한조사를수행하였다
.
어장으로사용된적이없으며주변양식장의 영향이없는곳을대조구
(St.C)
로설정하였다.
새롭게어장이설치된
St.S
에서굴양식장이설9
개월후(2017
년4
월)
부터2
년산굴의출하를시작하였고, 14
개월후에는수확이Fig. 1. Study area and sampling sites in the Tongyeong of Korea.
Geoje
Tongyeong St.S
St.E
St.C
Speed(cm/sec)
Flood Max: 22.2
Speed(cm/sec) Speed(cm/sec)
Ebb Max: 18.8
Flood Max: 17.9
Ebb Max: 18.1 Ebb Max: 16.1
Flood Max: 14.3
(a) (b) (c)
0 5 10 15 20 25 30
Water temperature (°C) E_surf. S_surf. C_surf.
E_bott. S_bott. C_bott.
22 24 26 28 30 32 34 36
Salinity
E_surf. S_surf. C_surf.
E_bott. S_bott. C_bott.
0 3 6 9 12 15
0 3 6 9 11 14
Dissolved oxygen (mg/L)
months
E_surf. S_surf. C_surf.
E_bott. S_bott. C_bott.
6 7 8 9 10
0 3 6 9 11 14
pH
months
E_surf. S_surf. C_surf.
E_bott. S_bott. C_bott.
(a) (b)
(c) (d)
Jul. Oct. Jau. Apr. Jun. Sep.
2016 2017
Jul. Oct. Jau. Apr. Jun. Sep.
2016 2017
SAND MUD
GRAVEL G
mG msG sG
gmS gS
(g)S S (g)mS mS
(g)M sM gM
M
Mud:Sand 5:5
Percent Gravel9:1 30%
80%
1:9 trace 0.01%
G=gravel sG=sandy gravel msG=muddy sandy gravel mG=muddy gravel gM=gravelly mud gmS=gravelly muddy sand gS=gravelly sand (g)M=slightly gravelly mud (g)mS=slighty gravelly muddy sand (g)S=slightly gravelly sand M=mud
sM=sandy mud mS=muddy sand S=sand
5%
CLAY 2:1
zS cS mS
S
SILT SAND
M Z C
sM sZ sC
10%
50%
90%
1:2 S=sand cS=clayey sand mS=muddy sand zS=silty sand sC=sandy clay sM=sandy mud sZ=sandy silt C=clay M=mud Z=silt
0
20
40
60
80
100
120
0 10 20 30 40
Sediment depth (cm)
Carbon (mg/g)
st.E st.C
(a) (b)
0
20
40
60
80
100
120
0 2 4 6
Sediment depth (cm)
Nitrogen (mg/g)
st.E st.C
6 8 10 12 14
IL (%)
E S C
20 30 40 50
COD (mg/g)
E S C
20 30 40 50
TOC (mg/g dw)
E S C
2.0 4.0 6.0 8.0
TN (mg/g dw)
E S C
0.0 0.3 0.6 0.9 1.2
0 3 6 9 11 14
AVS (mg/g dw)
months
E S C
-300 -200 -100 0 100 200 300
0 3 6 9 11 14
ORP (mV)
months
E S C
(a)
(c)
(e)
(b)
(d)
(f)
Jul. Oct. Jau. Apr. Jun. Sep.
2016 2017
Jul. Oct. Jau. Apr. Jun. Sep.
2016 2017
(a) (b) (c)
0%
20%
40%
60%
80%
100%
0 3 6 9 11 14
months
0%
20%
40%
60%
80%
100%
0 3 6 9 11 14
months
NO DATA
0%
20%
40%
60%
80%
100%
0 3 6 9 11 14
months
Lipids Proteins carbohydrates
Jul. Oct. Jau. Apr. Jun. Sep.
2016 2017
Jul. Oct. Jau. Apr. Jun. Sep.
2016 2017
Jul. Oct. Jau. Apr. Jun. Sep.
2016 2017
굴 양식 중단 후 어장환경 회복
775
끝나
1
년산굴만남아있었다.
조사해역의평균수심은약14 m (St.E 13.6 m; St.S 14.3 m; St.C 13.4 m)
전후로모든정점에서 유사하게나타났으며,
조차는약2 m
로나타났다.
조사 및 분석방법
해양의물리적특성을파악하고자
St.E
에서2018
년11
월22
일-12
월7
일까지15
일이상층별연속조류를조사하였다.
음향 도플러유속계(acoustic doppler current profiler, ADCP) (Flow- Quest 600 ADCP, LinkQuest Inc., San Diego, CA, USA)
를해 저면에설치하여조류의유향및유속을연속관측하였다.
관측 자료는표층(4 m),
중층(8 m),
저층(12 m)
의자료를추출하여 조화분석을통해해역의조류특성을파악하였다.
수층및표층퇴적물조사는어장철거
(2016
년6
월말)
직후 인2016
년7
월부터2017
년9
월까지약14
개월동안수행되었 다.
수층환경은CTD (SBE19, SeaBird Scientific , Bellevue, WA, USA)
를이용하여수온(seawater temperature)
과염분(sa- linity)
을측정하였고,
다목적수질측정기(YSI6000, YSI, Yel- low Springs, OH, USA)
장비를이용하여용존산소(dissolved oxygen, DO),
수소이온농도(pH)
를측정하였다.
퇴적물환경은Van Veen Grab sampler (self-manufactured equipment)
을이 용하여표층퇴적물(<2 cm)
을채취하였고,
채취된시료는현장 에서냉동보관하여실험실로이동하였다.
표층퇴적물시료는 입도(grain size), IL (ignition loss), COD (chemical oxygen de- mand), TOC, TN (total nitrogen), AVS (acid volatile sulfide), ORP
그리고생화학조성(biochemical composition)
을분석하 였다.
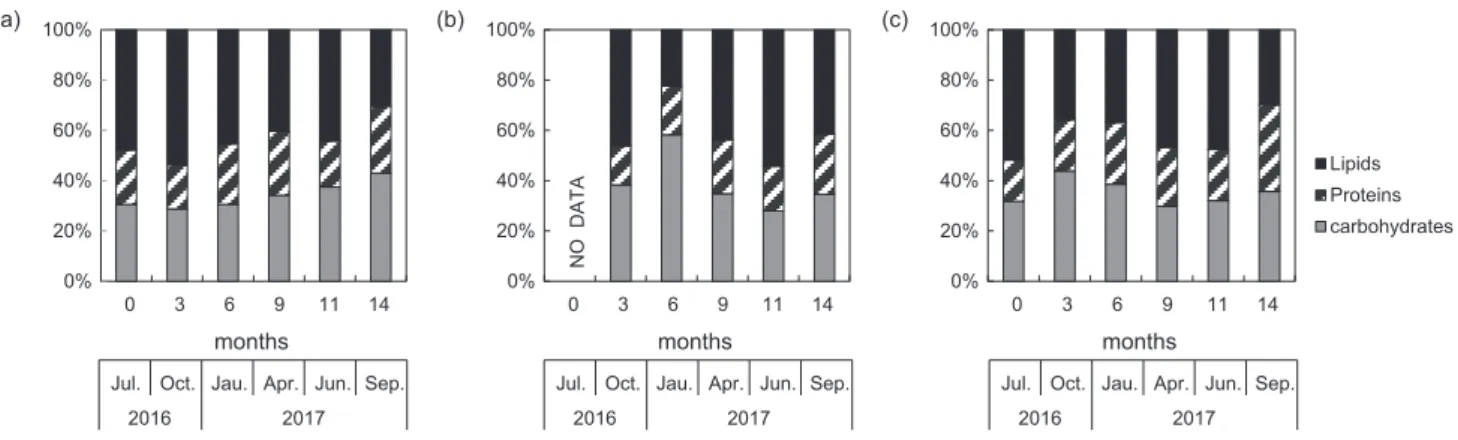
생화학조성인자로는 탄수화물(carbohydrates),
단백질(proteins),
지질(lipids)
에대하여정량하였다.
주상퇴적물시료는모니터링조사후추가적으로
2020
년4
월 에St.E, St.C
에서전문다이버를이용하여2 m
아크릴파이프 를이용하여채취하였다.
채집된시료는실험실에서0-2 cm
까 지는1 cm
간격으로, 2-40 cm
는2 cm
간격으로, 40-70 cm
는3 cm
간격, 70 cm
이하는5 cm
간격으로절단하여TOC
및TN
농도를측정하였다.
입도
, IL, COD, TOC, TN
및AVS
항목은해양환경공정시험 기준(MOF, 2013)
에준하여분석하였다.
입도분석은15%
과 산화수소를첨가하여유기물을제거하고, 10%
염산을첨가하 여탄산염을제거하였다.
전처리가끝난퇴적물시료는4 φ
체 를이용하여 습식체질하였고조립질(≧4 φ)
과세립질(<4 φ)
로 구분하였다.
조립질 시료는 건식체질하여 입도별무게를 측정하였고,
세립질시료는자동입도분석기(Sedigraph 5120, Micromeritics, Norcross, GA, USA)
로분석하였다.
측정된결 과는자갈,
모래,
실트,
점토함량으로나누어퇴적물의평균입 도를계산하였고, Folk (1968)
의삼각다이어그램을 이용하여 퇴적물유형을분류하였다. IL
은110°C
에서항량으로될때까지 건조한후
, 550°C
에서2
시간강열하여건조전과후의무게차이를이용하여정량하였다
. COD
는알칼리성과망간산칼 륨법으로분석하였으며, 0.1 N
티오황산나트륨(Na
2S
2O
3·H
2O)
로적정하여계산하였다. TOC
와TN
은표층퇴적물시료를동 결건조한후아게이트모르타르를이용하여곱게분쇄하고약10%
염산용액을가하여탄산염광물을제거하였다.
전처리된 시료는원소분석기(2400Series, PerkinElmer, Waltham, MA, USA)
를이용하여정량하였다. AVS
는표층퇴적물1g
을기체 발생관에분취하고,
황산을가하여발생되는황화수소를검지 관(Gastec, Tokyo, Japan)
을이용하여측정하였다. ORP
는다 항목측정기(A211, ThermoFisher Scientific, Waltham, MA, UAS)
를 이용하여ORP probe (9678BNWP, ThermoFisher Scientific, Waltham, MA, USA)
로 현장에서 즉시 측정하였 다.
퇴적물내 탄수화물은phenol-sulfuric acid
방법(Dubois et al., 1956)
으로측정하였고,
단백질은folin-ciocalteu phenol
방법(Lowry et al., 1951),
지질은chloroform-methanol
방법(Marsh and Weinstein, 1966)
으로측정하였다.
결과 및 고찰
물리적 환경(유향, 유속)
진해만의해수교환은대부분만입구인가덕수로를통해이루
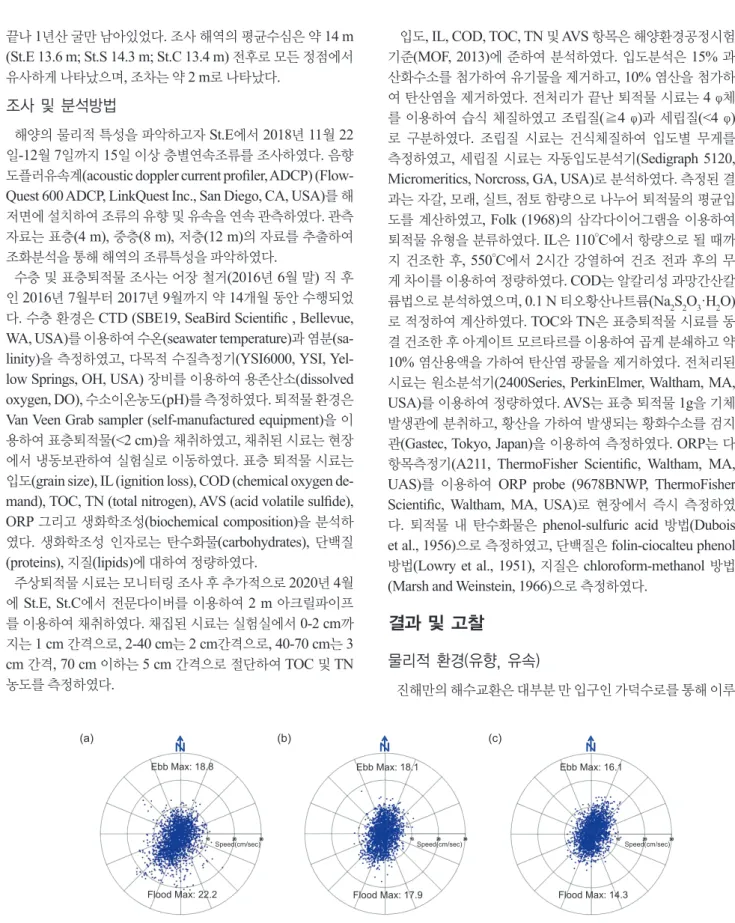
Fig. 2. Scatter diagrams of tidal current at St.E. (a) surface, (b) middle, and (c) bottom layer (unit, cm/s) from November 11 to December 7 of 2018.
Geoje
Tongyeong St.S
St.E
St.C
Speed(cm/sec)
Flood Max: 22.2
Speed(cm/sec) Speed(cm/sec)
Ebb Max: 18.8
Flood Max: 17.9
Ebb Max: 18.1 Ebb Max: 16.1
Flood Max: 14.3
(a) (b) (c)
0 5 10 15 20 25 30
Water temperature (°C) E_surf. S_surf. C_surf.
E_bott. S_bott. C_bott.
22 24 26 28 30 32 34 36
Salinity
E_surf. S_surf. C_surf.
E_bott. S_bott. C_bott.
0 3 6 9 12 15
0 3 6 9 11 14
Dissolved oxygen (mg/L)
months
E_surf. S_surf. C_surf.
E_bott. S_bott. C_bott.
6 7 8 9 10
0 3 6 9 11 14
pH
months
E_surf. S_surf. C_surf.
E_bott. S_bott. C_bott.
(a) (b)
(c) (d)
Jul. Oct. Jau. Apr. Jun. Sep.
2016 2017
Jul. Oct. Jau. Apr. Jun. Sep.
2016 2017
SAND MUD
GRAVEL G
mG msG sG
gmS gS
(g)S S (g)mS mS
(g)M sM gM
M
Mud:Sand 5:5
Percent Gravel9:1 30%
80%
1:9 trace 0.01%
G=gravel sG=sandy gravel msG=muddy sandy gravel mG=muddy gravel gM=gravelly mud gmS=gravelly muddy sand gS=gravelly sand (g)M=slightly gravelly mud (g)mS=slighty gravelly muddy sand (g)S=slightly gravelly sand M=mud
sM=sandy mud mS=muddy sand S=sand
5%
CLAY 2:1
zS cS mS
S
SILT SAND
M Z C
sM sZ sC
10%
50%
90%
1:2 S=sand cS=clayey sand mS=muddy sand zS=silty sand sC=sandy clay sM=sandy mud sZ=sandy silt C=clay M=mud Z=silt
0
20
40
60
80
100
120
0 10 20 30 40
Sediment depth (cm)
Carbon (mg/g)
st.E st.C
(a) (b)
0
20
40
60
80
100
120
0 2 4 6
Sediment depth (cm)
Nitrogen (mg/g)
st.E st.C
6 8 10 12 14
IL (%)
E S C
20 30 40 50
COD (mg/g)
E S C
20 30 40 50
TOC (mg/g dw)
E S C
2.0 4.0 6.0 8.0
TN (mg/g dw)
E S C
0.0 0.3 0.6 0.9 1.2
0 3 6 9 11 14
AVS (mg/g dw)
months
E S C
-300 -200 -100 0 100 200 300
0 3 6 9 11 14
ORP (mV)
months
E S C
(a)
(c)
(e)
(b)
(d)
(f)
Jul. Oct. Jau. Apr. Jun. Sep.
2016 2017
Jul. Oct. Jau. Apr. Jun. Sep.
2016 2017
(a) (b) (c)
0%
20%
40%
60%
80%
100%
0 3 6 9 11 14
months
0%
20%
40%
60%
80%
100%
0 3 6 9 11 14
months
NO DATA
0%
20%
40%
60%
80%
100%
0 3 6 9 11 14
months
Lipids Proteins carbohydrates
Jul. Oct. Jau. Apr. Jun. Sep.
2016 2017
Jul. Oct. Jau. Apr. Jun. Sep.
2016 2017
Jul. Oct. Jau. Apr. Jun. Sep.
2016 2017
심보람
ㆍ
김형철ㆍ
강성찬ㆍ
이대인ㆍ
홍석진ㆍ
이상헌ㆍ
김예진776
어지고있으며
,
일부남쪽의견내량수로를통해서도이루어진 다(Moon, 2009).
본연구에서ADCP
를이용하여진해만의작은내만중하나인원문만에위치한
St.E
정점에서수심별최고유속및평균유속과잔차류를살펴보았고
,
표층,
중층및저층 의조류분산도를Fig. 2
에나타냈다.
표층(4 m)
최고유속은창 조시에22.2 cm/s,
낙조시에18.8 cm/s
로나타났고,
조사기간 동안조석에따른평균유속은4.7-7.0 cm/s
로나타났다.
조사 된유속의85%
가10 cm/s
이하의유속을나타냈고,
창조시에 는남서-
남남서방향의흐름이낙조시에는방향분산성이다소 크게나타났다.
잔차류의유속은2.7 cm/s,
유향은216.9º
로나 타났다.
중층(8 m)
의최고유속은창조시에17.9 cm/s,
낙조시에18.1 cm/s
로나타났고,
조석별평균유속은4.9-5.3 cm/s
로나타 났다.
중층의경우약95%
가10 cm/s
이하의유속을나타냈고,
창조시에는남남서향의흐름이낙조시에는북향의흐름이우 세하게나타났다.
잔차류의유속은0.6 cm/s,
유향은247.4º
로 나타났다.
저층(12 m)
최고유속은창조시에14.3 cm/s,
낙조시 에16.1 cm/s
로나타났고,
조석별평균유속은4.7-5.2 cm/s
로나 타났다.
약94%
가10 cm/s
이하의유속을나타냈고,
창조시에 는남-
남남서방향,
낙조시에는북동-
북북동방향의흐름이나 타났다.
잔차류의유속은0.9 cm/s,
유향은45.8º
로나타났다.
본연구에서
ADCP
를이용하여측정한전체수층의평균유속(5-7
cm/s)
은원문만입구에서약7-10 cm/s
흐름이나타나고만내부는
4 cm/s
이하의약한흐름을보인다는다른연구결과와유사하였다
(Kim et al., 2016).
수층 환경
조사기간동안해수표
·
저층의수온,
염분, DO
및pH
의결 과는Fig. 3
에 나타내었다.
해수 수온은7.98-25.41°C (
평균17.11±6.50°C)
범위로나타났으며,
하계에해수수온이높고 동계에낮은전형적인온대계절성분포특성을보였다.
염분은29.22-34.50 (
평균32.28±1.53)
범위였으며,
어장이설14
개월 후(2017
년9
월)
표층의낮은염분은조사전날강우(270 mm/
day)
에따른것으로판단된다.
해수내pH
농도는7.18-8.08 (
평 균7.72±0.24)
범위로나타났으며,
다소낮은pH
를보였다.
원 문만일대에서하계에빈산소발생시pH
가6.6
까지낮아졌다 는연구결과가있으며,
이는혐기성미생물의작용등으로인해 수중의CO
2농도증가에따른것이다(Kim et al., 2012). DO
는1.35-9.57 mg/L (
평균7.21±2.10 mg/L)
범위였으며,
어장이 설14
개월후저층의DO
농도가가장낮았으며특히양식활동 을하고있는St.S
저층에서빈산소수괴(<3 mg/L)
가관측되었 Fig. 3. Temporal changes in (a) water temperature (b) salinity (c) dissolved oxygen, and (d) pH in the surface and bottom waters of the study area. Triangle mark, St.E; circle mark, St.S; square mark, St.C; solid line, surface; dotted line, bottom; X-axis, months means the elapsed time.Geoje
Tongyeong St.S
St.E
St.C
Speed(cm/sec)
Flood Max: 22.2
Speed(cm/sec) Speed(cm/sec)
Ebb Max: 18.8
Flood Max: 17.9
Ebb Max: 18.1 Ebb Max: 16.1
Flood Max: 14.3
(a) (b) (c)
0 5 10 15 20 25 30
Water temperature (°C) E_surf. S_surf. C_surf.
E_bott. S_bott. C_bott.
22 24 26 28 30 32 34 36
Salinity
E_surf. S_surf. C_surf.
E_bott. S_bott. C_bott.
0 3 6 9 12 15
0 3 6 9 11 14
Dissolved oxygen (mg/L)
months
E_surf. S_surf. C_surf.
E_bott. S_bott. C_bott.
6 7 8 9 10
0 3 6 9 11 14
pH
months
E_surf. S_surf. C_surf.
E_bott. S_bott. C_bott.
(a) (b)
(c) (d)
Jul. Oct. Jau. Apr. Jun. Sep.
2016 2017
Jul. Oct. Jau. Apr. Jun. Sep.
2016 2017
SAND MUD
GRAVEL G
mG msG sG
gmS gS
(g)S S (g)mS mS
(g)M sM gM
M
Mud:Sand 5:5
Percent Gravel9:1 30%
80%
1:9 trace 0.01%
G=gravel sG=sandy gravel msG=muddy sandy gravel mG=muddy gravel gM=gravelly mud gmS=gravelly muddy sand gS=gravelly sand (g)M=slightly gravelly mud (g)mS=slighty gravelly muddy sand (g)S=slightly gravelly sand M=mud
sM=sandy mud mS=muddy sand S=sand
5%
CLAY 2:1
mS zS cS
S
SILT SAND
Z M
C
sM sZ sC
10%
50%
90%
1:2 S=sand cS=clayey sand mS=muddy sand zS=silty sand sC=sandy clay sM=sandy mud sZ=sandy silt C=clay M=mud Z=silt
0
20
40
60
80
100
120
0 10 20 30 40
Sediment depth (cm)
Carbon (mg/g)
st.E st.C
(a) (b)
0
20
40
60
80
100
120
0 2 4 6
Sediment depth (cm)
Nitrogen (mg/g)
st.E st.C
6 8 10 12 14
IL (%)
E S C
20 30 40 50
COD (mg/g)
E S C
20 30 40 50
TOC (mg/g dw)
E S C
2.0 4.0 6.0 8.0
TN (mg/g dw)
E S C
0.0 0.3 0.6 0.9 1.2
0 3 6 9 11 14
AVS (mg/g dw)
months
E S C
-300 -200 -100 0 100 200 300
0 3 6 9 11 14
ORP (mV)
months
E S C
(a)
(c)
(e)
(b)
(d)
(f)
Jul. Oct. Jau. Apr. Jun. Sep.
2016 2017
Jul. Oct. Jau. Apr. Jun. Sep.
2016 2017
(a) (b) (c)
0%
20%
40%
60%
80%
100%
0 3 6 9 11 14
months
0%
20%
40%
60%
80%
100%
0 3 6 9 11 14
months
NO DATA
0%
20%
40%
60%
80%
100%
0 3 6 9 11 14
months
Lipids Proteins carbohydrates
Jul. Oct. Jau. Apr. Jun. Sep.
2016 2017
Jul. Oct. Jau. Apr. Jun. Sep.
2016 2017
Jul. Oct. Jau. Apr. Jun. Sep.
2016 2017
굴 양식 중단 후 어장환경 회복
777
다
.
진해만은빈산소수괴가자주발생하는해역으로빈산소수 괴의형성과지속에관한연구들이많이수행되었으며(Lee et al., 2008; Kim et al., 2012),
진해만양식굴의주요폐사원인이 빈산소수괴의영향이라고알려져있다(NFRDI, 2012).
퇴적물 환경
조사해역 내 표층퇴적물의 자갈
,
모래,
실트 및 점토함량 은 각각0.00-0.22% (
평균0.02±0.06%), 0.00-1.11% (
평균0.29±0.37%), 8.91-17.88% (
평균15.28±2.24%)
및82.12- 90.01% (
평균84.42±2.11%)
범위로 나타났다.
퇴적물의 평 균입도(mean grain size)
는9.00-9.36 (
평균9.10±0.09 Ø)
이 며, Folk (1968)
에따른퇴적물유형(sediment type)
은모든정 점에서점토(clay)
로분류되었다(Fig. 4).
퇴적물분급(sort)
은0.78-1.24 Ø (
평균1.05±0.12 Ø)
범위로불량한(poorly sort- ed)
등급을보였다.
왜도(skewness)
는평균-0.59~-0.35 (
평균-0.47±0.05)
범위로강한음의왜도(strongly negative skewed)
를보였고이는세립질퇴적물의양이많다는것을의미한다.
첨 도(kurtosis)
는1.51-2.98 (
평균1.98±0.3)
범위로입도분포곡선 이정규분포보다중앙으로매우집중된형태(very leptokurtic)
를보였다.
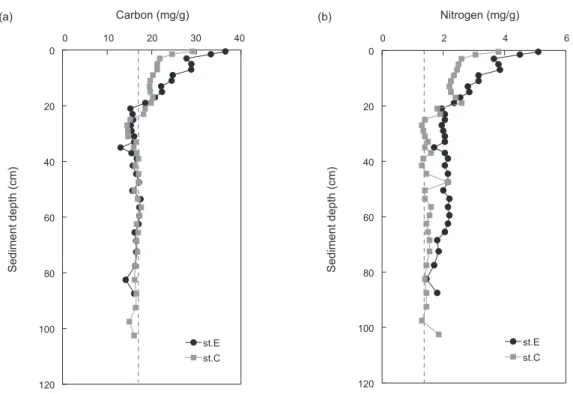
주상퇴적물시료내
TOC
및TN
농도의수직분포특성을통 해양식활동영향이나타나는구간과배경농도(
외부영향이없 는자연적인조건에서의농도)
를살펴보았다.
주상시료는전문 다이버를통해주상퇴적물을최대로채취할수있는깊이까지 채취하였다.
지정된수면에서20
년동안꾸준히양식활동이이 루어졌고,
양식장이다른곳으로이설되어 현재양식이중단 된St.E
에서90 cm
깊이까지,
대조구인St.C
에서105 cm
깊이 까지채취하여분석하였다. TOC
및TN
농도는St.E
에서각각13.00-36.50 mg/g (
평균19.21±5.70 mg/g), 1.45-5.10 mg/g (
평균2.44±0.83 mg/g)
범위로나타났고, St.C
에서각각14.45- 29.15 mg/g (
평균17.90±2.93 mg/g), 1.30-3.80 mg/g (
평균1.82±0.58 mg/g)
범위로나타났다(Fig. 5). TOC
농도는장기 간양식을해온St.E
정점에서대조구(St.C)
보다20 cm
이내퇴 적층상부에서상대적으로높았고, TN
농도는주상퇴적물전체깊이에서높게나타났다
.
대조정점(St.C)
은양식활동이이루어지지않았지만주변양식장과지역적인특성을고려할때약
20
cm
깊이까지외부오염의영향이있었다는것을나타내고있다
.
거제-
한산만의주상퇴적물내TOC
배경농도가10.8-13.6 mg/g (Choi et al., 2017)
였으며,
본연구해역의TOC
배경농도(<20 cm
이하구간)
는17.9-19.2 mg/g
으로상대적으로높았다.
진해만의경우유속이빠르지않아지속적으로유기물이축적 되기용이한해역이며(NFRDI, 2002)
와거제-
한산만에비해본 연구해역이양식장의자가오염에의한퇴적물의오염도가높다(Lee et al., 2000)
는연구결과들이있다.
또한도시하수유입정 도를파악하는지표(sterol, coprostanol)
에따르면진해만전체 가도시하수유입의영향을받고있다는연구결과(Choi et al.,
2005)
가있어본연구해역은자가오염뿐만아니라외부기원의오염물질도유입된다는것을파악할수있었다
.
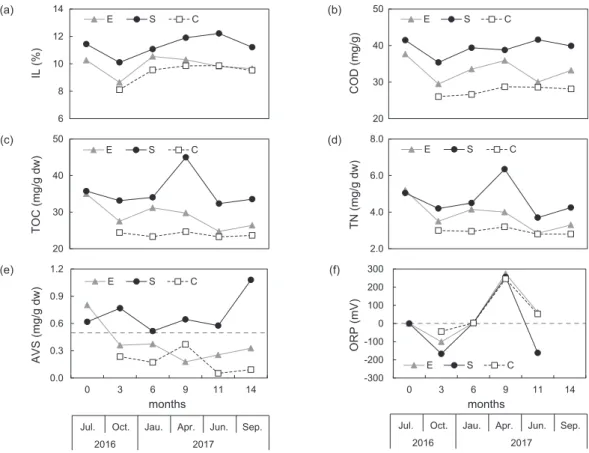
표층퇴적물 내 지화학 인자들의 조사결과를 살펴보면
, IL
농도는8.11-12.21% (
평균10.24±1.05%)
범위, COD
농도 는26.05-41.59 mg/g dry weight (
평균33.79±5.22 mg/g dry weight,
이하mg/g)
범위로 나타났다. TOC
는23.25-45.00 mg/g (
평균29.86±5.77 mg/g), TN
은2.80-6.35 mg/g (
평균3.87±0.97 mg/g)
범위로 나타났다. AVS
농도는0.052-1.080 mg/g (
평균0.437±0.273 mg/g)
범위로 나타났다. ORP
는-166.7~273.8 mV (
평균35.9±146.8 mV)
범위로나타났다.
원 Fig. 4. Sediment type in the study area.Geoje
Tongyeong St.S
St.E
St.C
Speed(cm/sec)
Flood Max: 22.2
Speed(cm/sec) Speed(cm/sec)
Ebb Max: 18.8
Flood Max: 17.9
Ebb Max: 18.1 Ebb Max: 16.1
Flood Max: 14.3
(a) (b) (c)
0 5 10 15 20 25 30
Water temperature (°C) E_surf. S_surf. C_surf.
E_bott. S_bott. C_bott.
22 24 26 28 30 32 34 36
Salinity
E_surf. S_surf. C_surf.
E_bott. S_bott. C_bott.
0 3 6 9 12 15
0 3 6 9 11 14
Dissolved oxygen (mg/L)
months
E_surf. S_surf. C_surf.
E_bott. S_bott. C_bott.
6 7 8 9 10
0 3 6 9 11 14
pH
months
E_surf. S_surf. C_surf.
E_bott. S_bott. C_bott.
(a) (b)
(c) (d)
Jul. Oct. Jau. Apr. Jun. Sep.
2016 2017
Jul. Oct. Jau. Apr. Jun. Sep.
2016 2017
SAND MUD
GRAVEL G
mG msG sG
gmS gS
(g)S S (g)mS mS
(g)M sM gM
M
Mud:Sand 5:5
Percent Gravel9:1 30%
80%
1:9 trace 0.01%
G=gravel sG=sandy gravel msG=muddy sandy gravel mG=muddy gravel gM=gravelly mud gmS=gravelly muddy sand gS=gravelly sand (g)M=slightly gravelly mud (g)mS=slighty gravelly muddy sand (g)S=slightly gravelly sand M=mud
sM=sandy mud mS=muddy sand S=sand
5%
CLAY 2:1
mS zS cS
S
SILT SAND
Z C M
sM sZ sC
10%
50%
90%
1:2 S=sand cS=clayey sand mS=muddy sand zS=silty sand sC=sandy clay sM=sandy mud sZ=sandy silt C=clay M=mud Z=silt
0
20
40
60
80
100
120
0 10 20 30 40
Sediment depth (cm)
Carbon (mg/g)
st.E st.C
(a) (b)
0
20
40
60
80
100
120
0 2 4 6
Sediment depth (cm)
Nitrogen (mg/g)
st.E st.C
6 8 10 12 14
IL (%)
E S C
20 30 40 50
COD (mg/g)
E S C
20 30 40 50
TOC (mg/g dw)
E S C
2.0 4.0 6.0 8.0
TN (mg/g dw)
E S C
0.0 0.3 0.6 0.9 1.2
0 3 6 9 11 14
AVS (mg/g dw)
months
E S C
-300 -200 -100 0 100 200 300
0 3 6 9 11 14
ORP (mV)
months
E S C
(a)
(c)
(e)
(b)
(d)
(f)
Jul. Oct. Jau. Apr. Jun. Sep.
2016 2017
Jul. Oct. Jau. Apr. Jun. Sep.
2016 2017
(a) (b) (c)
0%
20%
40%
60%
80%
100%
0 3 6 9 11 14
months
0%
20%
40%
60%
80%
100%
0 3 6 9 11 14
months
NO DATA