Endocrinol Metab 2016;31:134-141
http://dx.doi.org/10.3803/EnM.2016.31.1.134 pISSN 2093-596X · eISSN 2093-5978
Original Article
Glucose-Dependent Insulinotropic Peptide Level Is Associated with the Development of Type 2 Diabetes Mellitus
Sunghwan Suh1,*, Mi Yeon Kim2,*, Soo Kyoung Kim3, Kyu Yeon Hur2, Mi Kyoung Park1, Duk Kyu Kim1, Nam H. Cho4, Moon-Kyu Lee2
1Division of Endocrinology and Metabolism, Department of Internal Medicine, Dong-A Medical Center, Dong-A University College of Medicine, Busan; 2Division of Endocrinology and Metabolism, Department of Medicine, Samsung Medical Center, Sungkyunkwan University School of Medicine, Seoul; 3Division of Endocrinology and Metabolism, Department of Internal Medicine, Gyeongsang National University School of Medicine, Jinju; 4Department of Preventive Medicine, Ajou University School of Medicine, Suwon, Korea
Background: Incretin hormone levels as a predictor of type 2 diabetes mellitus have not been fully investigated. Therefore, we measured incretin hormone levels to examine the relationship between circulating incretin hormones, diabetes, and future diabe- tes development in this study.
Methods: A nested case-control study was conducted in a Korean cohort. The study included the following two groups: the con- trol group (n=149), the incident diabetes group (n=65). Fasting total glucagon-like peptide-1 (GLP-1) and total glucose-depen- dent insulinotropic peptide (GIP) levels were measured and compared between these groups.
Results: Fasting total GIP levels were higher in the incident diabetes group than in the control group (32.64±22.68 pmol/L vs.
25.54±18.37 pmol/L, P=0.034). There was no statistically significant difference in fasting total GLP-1 levels between groups (1.14±1.43 pmol/L vs. 1.39±2.13 pmol/L, P=0.199). In multivariate analysis, fasting total GIP levels were associated with an increased risk of diabetes (odds ratio, 1.005; P=0.012) independent of other risk factors.
Conclusion: Fasting total GIP levels may be a risk factor for the development of type 2 diabetes mellitus. This association per- sisted even after adjusting for other metabolic parameters such as elevated fasting glucose, hemoglobin A1c, and obesity in the pre-diabetic period.
Keywords: Gastric inhibitory polypeptide; Diabetes mellitus, type 2; Glucagon-like peptide 1
Received: 13 August 2015, Revised: 4 September 2015, Accepted: 15 September 2015
Corresponding authors: Nam H. Cho
Department of Preventive Medicine, Ajou University School of Medicine, 164 World cup-ro, Yeongtong-gu, Suwon 16499, Korea
Tel: +82-31-219-4217, Fax: +82-31-219-5084, E-mail: [email protected] Moon-Kyu Lee
Division of Endocrinology and Metabolism, Department of Medicine, Samsung Medical Center, Sungkyunkwan University School of Medicine, 81 Irwon-ro, Gangnam-gu, Seoul 06351, Korea
Tel: +82-2-3410-3431, Fax: +82-2-3410-0393, E-mail: [email protected]
*These authors contributed equally to this work.
Copyright © 2016 Korean Endocrine Society
This is an Open Access article distributed under the terms of the Creative Com- mons Attribution Non-Commercial License (http://creativecommons.org/
licenses/by-nc/4.0/) which permits unrestricted non-commercial use, distribu- tion, and reproduction in any medium, provided the original work is properly cited.
INTRODUCTION
Glucagon-like peptide-1 (GLP-1) and glucose-dependent insu- linotropic peptide (GIP) are incretin hormones that potentiate glucose-stimulated insulin secretion from β-cells [1]. Recently, new therapeutic agents such as GLP-1 analogs and dipeptidyl peptidase-4 (DPP4) inhibitors were introduced to clinical prac- tice with proven efficacy of glucose control [1]. Development of these novel medications was based on a marked reduction of incretin effects in patients with type 2 diabetes mellitus (T2DM) [2]. In patients with T2DM, the reduction of incretin effects was largely due to decreased GLP-1 secretion after nu- trient stimulation or ineffective GIP action [3]. Nevertheless, it has been demonstrated recently that the incretin effect is not impaired in Japanese and Korean T2DM subjects [4,5]. Recent meta-analyses of clinical studies also suggested that patients with T2DM, in general, do not exhibit reduced GLP-1 secre- tion in response to an oral glucose tolerance test (OGTT) or meal test [6]. There are ethnic differences in the pathogenesis of T2DM, especially in Caucasian and East Asians [7]. How- ever, studies of incretin action in East Asians are limited.
It is well established that the risk of diabetes in prediabetic subjects is much higher compared to those with normal glucose tolerance (NGT) [8]. Even among subjects with NGT, an upper normal level of fasting plasma glucose (FPG) is a predictor of T2DM [9]. However, incretin hormone levels as a predictor of T2DM have not been fully investigated because incretin levels have only been measured in small groups of subjects [10,11]
due to the relatively laborious and time-consuming nature of the laboratory methods associated with this measurement. The present study was conducted to evaluate incretin hormone lev- els before diabetes develops and to determine the role of incre- tin hormones as predictors of diabetes development.
METHODS
Study design and participants
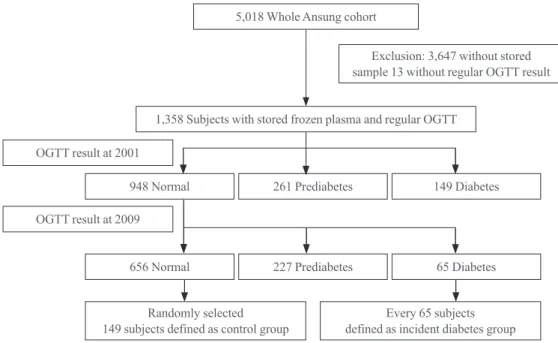
A nested case-control analysis was performed using participants of an Ansung cohort study. The design and baseline characteris- tics of the Ansung-Ansan cohort study have been described in detail elsewhere [12]. Briefly, it is an ongoing prospective com- munity-based epidemiological study that is a part of the Korean Health and Genome Study which was conducted to investigate trends in diabetes and associated risk factors. The baseline ex- amination was performed in 2001 to 2002, and biennial follow- up examinations were continued through 2012. Of the 5,018
subjects who were surveyed in Ansung, complete data from the baseline investigation and frozen samples for further analysis were available for 1,371 participants who registered for the co- hort study in the first year (2001). Among the 1,371 subjects, the results of OGTT were available for 1,358 subjects. During both initial screening and follow-up visit, the definitions of NGT, prediabetes and diabetes were based on plasma glucose levels during the 75 g OGTT according to the 1997 American Diabetes Association criteria. NGT was defined as FPG level <6.1 mmol/
L and 2-hour plasma glucose <7.8 mmol/L. Prediabetes was de- fined as 6.1 mmol/L≤FPG level<7.0 mmol/L or 7.8 mmol/L≤
2-hour plasma glucose<11.1 mmol/L. Diabetes was defined as FPG concentration ≥7.0 mmol/L or 2-hour plasma glucose ≥ 11.1 mmol/L or current treatment with oral antidiabetic drugs or insulin [13]. At the time of initial screening in 2001, there were 948 subjects with NGT, and 261 subjects with prediabetes.
Among the subjects who showed NGT in 2001, 23.9%
(227/948) developed impaired fasting glucose or impaired glu- cose tolerance (IGT) and 6.9% (65/948) developed diabetes by 2009. The “incident diabetes group (NGT→diabetes mellitus group)” in the present study consisted of the 65 subjects who developed diabetes during the follow-up period. Among the 656 subjects who maintained NGT during the 8-year follow-up peri- od, 149 subjects were randomly selected and matched to diabet- ic subjects by sex and age. These 149 subjects were defined as the “control group (NGT→NGT group)” (Fig. 1). Circulating levels of total GLP-1 and total GIP were measured in selected samples to examine the relationship between basal incretin hor- mones and diabetes development. The study protocol was ap- proved by the Institutional Review Boards of the Samsung Medical Center (Approval number 2010-11-068-001).
Data collection and biochemical analyses
Anthropometric parameters and blood pressure were measured using standard methods. FPG, insulin, total cholesterol, triglycer- ides, and high density lipoprotein cholesterol were measured, and the results were obtained from the main database. Homeostasis model of assessment-insulin resistance (HOMA-IR) was defined as [fasting insulin (μU/mL)×fasting glucose (mmol/L)]/22.5.
Homeostasis model of assessment-β cell function (HOMA-B) was calculated using (20×fasting insulin in μU/mL)/(fasting glu- cose in mmol/L–3.5) [14]. Total GLP-1 and total GIP were mea- sured in the stored samples. The plasma concentrations of total GLP-1 (ALPCO Diagnostics, Windham, NH, USA) and total GIP (Millipore Corp., Bedford, MA, USA) were measured with- out an ethanol extraction step by an enzyme-linked immunosor-
bent assay. Samples were frozen at –70°C and never thawed until they were moved to Samsung Medical Center for analy- ses. The biochemical analysis of incretin hormones was per- formed in duplicate by a single trained technician in the De- partment of Laboratory Medicine and Genetics at the Samsung Medical Center.
Statistical analyses
Statistical analyses to compare baseline characteristics between and among the groups were conducted using one-way analysis of variance for normally distributed data. The Kruskal-Wallis test was used for analysis of skewed data. Categorical variables were compared using Pearson and chi-square test. Univariate analyses were performed to assess the association between dia- betes development and clinical parameters. Multivariate analy- sis was performed using variables from the univariate analyses that were significant at P<0.05. A binary logistic regression model was used for univariate and multivariate analyses.
P<0.05 was considered statistically significant. A binary logis- tic regression model was used for development of diabetes ac- cording to incretin quintiles. Statistical analyses were performed using IBM SPSS version 19 (IBM Co., Armonk, NY, USA).
RESULTS
Descriptive data
Demographic characteristics and laboratory results are summa-
rized in Table 1. Demographic characteristics such as age and sex were not significantly different between groups. On the other hand, significant differences in waist circumference, body mass index (BMI), systolic blood pressure, diastolic blood pressure, FPG, postprandial glucose, hemoglobin A1c (HbA1c), triglyceride, aspartate transaminase, alanine transam- inase (ALT), γ-glutamyl transpeptidase were observed. Those discrepancies were primarily observed in subjects who had dia- betes upon initial enrollment. To investigate the role of incretin hormones as predictors of incident diabetes, total GLP-1 and total GIP levels were compared between patients who devel- oped diabetes and those who maintained NGT. Total GLP-1 levels were not significantly different between the two groups who developed diabetes and those who maintained NGT (P=0.199). Nonetheless, there were significant differences in total GIP levels between patients who developed diabetes and those who did not (P=0.034). Correlations between incretin hormones and HOMA-B and HOMA-IR were not significant (data not shown).
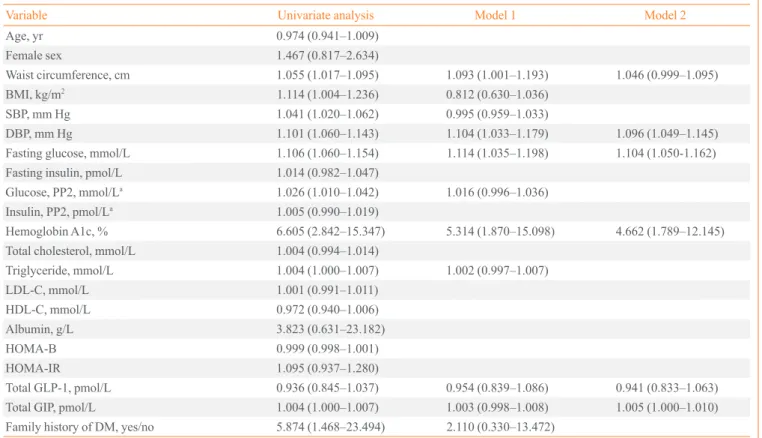
Risk estimates for diabetes development
Parameters that were significantly associated with diabetes de- velopment included waist circumference, BMI, blood pressure, FPG, postprandial glucose, HbA1c, triglycerides, family histo- ry of diabetes, and total GIP levels (Table 2). In multivariate analyses, incretin levels were not significantly associated with the development of diabetes (model 1 of Table 2). After select-
5,018 Whole Ansung cohort
1,358 Subjects with stored frozen plasma and regular OGTT OGTT result at 2001
OGTT result at 2009
Randomly selected
149 subjects defined as control group Every 65 subjects defined as incident diabetes group 948 Normal
656 Normal
261 Prediabetes
227 Prediabetes
149 Diabetes
65 Diabetes Exclusion: 3,647 without stored sample 13 without regular OGTT result
Fig. 1. Flow diagram of the study. OGTT, oral glucose tolerance test.
ing the most relevant variables to predict diabetes occurrence, a second model was established (model 2 of Table 2). In this sec- ond model, fasting total GIP levels were significantly associat- ed with diabetes development, whereas GLP-1 levels were not.
In both univariate and multivariate analyses, higher HbA1c was the most significant predictor of diabetes development. In multivariable logistic regression analyses adjusted for age, sex and BMI, total GIP levels in the fifth quintile were associated with higher odds ratios of future diabetes development, while total GLP-1 levels were not. This association remained signifi- cant after additional adjustment for HbA1c (Table 3).
DISCUSSION
The purpose of this study was to investigate the association be- tween incretin hormones and diabetes development in a com- munity-based cohort. The novel finding is that fasting GIP lev- els were elevated before diabetes development even in subjects with NGT. In patients with T2DM, the reduced effects of incre- tin are well elucidated [2]. Reduced incretin effects have been explained by diminished GLP-1 levels in plasma and deterio- rated GIP action [3]. Although impaired GLP-1 secretion after nutritional stimuli in diabetic patients has been reported in sev- eral papers [15,16], GLP-1 secretion is currently believed to be preserved in diabetic patients [6]. Some researchers have pro- Table 1. Demographic Characteristics of 214 Subjects
Characteristic NGT→NGT (n=149) NGT→DM (n=65) P value
Age, yr 62 (54–65) 59 (49.5–65) 0.144
Sex, male:female 66:83 35:30 0.347
Waist circumference, cm 83.22±8.37 86.85±8.04 0.003
BMI, kg/m2 23.09 (21.67–24.97) 24.45 (22.13–26.51) 0.040
SBP, mm Hg 118.67 (108.33–127.67) 129.33 (114.33–139.33) <0.001
DBP, mm Hg 71.33 (67.33–77.67) 80.00 (72.33–85.33) <0.001
Fasting glucose, mmol/L 4.28 (4.08–4.51) 4.63 (4.25–5.09) <0.001
Fasting insulin, pmol/L 39.24 (31.00–79.00) 40.28 (43.50–87.00) 0.370
Glucose, PP2, mmol/La 5.69 (4.73–6.57) 6.10 (5.51–7.09) 0.001
Insulin, PP2, pmol/La 127.09 (107.25–345.50) 154.18 (126.50–329.00) 0.517
Hemoglobin A1c, % 5.30 (5.09–5.50) 5.63 (5.40–5.91) <0.001
Total cholesterol, mmol/L 4.59±0.68 4.68±0.90 0.450
Triglyceride, mmol/L 1.43 (1.12–1.89) 1.73 (1.34–2.31) 0.033
LDL-C, mmol/L 2.70 (2.30–4.32) 2.73 (2.22–3.39) 0.799
HDL-C, mmol/L 1.13 (0.98–1.29) 1.08 (0.96–1.78) 0.085
Albumin, g/L 40.6 (39.13–41.37) 40.6 (39.50–41.37) 0.144
AST, U/L 25.62 (22.65–30.57) 27.60 (23.64–33.55) 0.004
ALT, U/L 21.42 (17.18–26.72) 23.54 (19.30–33.60) <0.001
γ-GTP, U/L 13.08 (10.07–23.12) 22.12 (14.59–43.20) <0.001
HOMA-B 141.17 (84.67–213.49) 115.38 (68.98–176.72) 0.412
HOMA-IR 1.11 (0.58–1.52) 1.18 (0.79–1.81) 0.223
Total GLP-1, pmol/L 1.39 (0.69–2.82) 1.14 (0.65–2.08) 0.199
Total GIP, pmol/L 25.54 (7.17–43.91) 32.64 (9.96–55.32) 0.034
Family history of diabetes, yes:no 3:146 7:58 <0.001
Values are expressed as median (interquartile range) or mean±SD.
NGT, normal glucose tolerance; DM, diabetes mellitus; BMI, body mass index; SBP, systolic blood pressure; DBP, diastolic blood pressure; PP2, postprandial 2 hours; LDL-C, low density lipoprotein cholesterol; HDL-C, high density lipoprotein cholesterol; AST, aspartate transaminase; ALT, alanine transaminase; γ-GTP, gamma-glutamyl transpeptidase; HOMA-B, homeostasis model of assessment-β cell function; HOMA-IR, homeostasis model of assessment-insulin resistance; GLP-1, glucagon-like peptide-1; GIP, glucose-dependent insulinotropic peptide.
posed that reduced incretin effect is a consequence of diabetic status, as deterioration in glucose homeostasis can develop in the absence of any impairment in GIP or GLP-1 levels [10].
The findings of a large cohort study demonstrated that fasting and integrated postprandial concentrations of total and active GLP-1 are not significantly different between subjects with Table 2. Relationship between Development of Diabetes and Clinical Parameters
Variable Univariate analysis Model 1 Model 2
Age, yr 0.974 (0.941–1.009)
Female sex 1.467 (0.817–2.634)
Waist circumference, cm 1.055 (1.017–1.095) 1.093 (1.001–1.193) 1.046 (0.999–1.095)
BMI, kg/m2 1.114 (1.004–1.236) 0.812 (0.630–1.036)
SBP, mm Hg 1.041 (1.020–1.062) 0.995 (0.959–1.033)
DBP, mm Hg 1.101 (1.060–1.143) 1.104 (1.033–1.179) 1.096 (1.049–1.145)
Fasting glucose, mmol/L 1.106 (1.060–1.154) 1.114 (1.035–1.198) 1.104 (1.050-1.162)
Fasting insulin, pmol/L 1.014 (0.982–1.047)
Glucose, PP2, mmol/La 1.026 (1.010–1.042) 1.016 (0.996–1.036)
Insulin, PP2, pmol/La 1.005 (0.990–1.019)
Hemoglobin A1c, % 6.605 (2.842–15.347) 5.314 (1.870–15.098) 4.662 (1.789–12.145)
Total cholesterol, mmol/L 1.004 (0.994–1.014)
Triglyceride, mmol/L 1.004 (1.000–1.007) 1.002 (0.997–1.007)
LDL-C, mmol/L 1.001 (0.991–1.011)
HDL-C, mmol/L 0.972 (0.940–1.006)
Albumin, g/L 3.823 (0.631–23.182)
HOMA-B 0.999 (0.998–1.001)
HOMA-IR 1.095 (0.937–1.280)
Total GLP-1, pmol/L 0.936 (0.845–1.037) 0.954 (0.839–1.086) 0.941 (0.833–1.063)
Total GIP, pmol/L 1.004 (1.000–1.007) 1.003 (0.998–1.008) 1.005 (1.000–1.010)
Family history of DM, yes/no 5.874 (1.468–23.494) 2.110 (0.330–13.472) Values are expressed as odds ratio (95% confidence interval).
BMI, body mass index; SBP, systolic blood pressure; DBP, diastolic blood pressure; PP2, postprandial 2 hours; LDL-C, low density lipoprotein cho- lesterol; HDL-C, high density lipoprotein cholesterol; HOMA-B, homeostasis model of assessment-β cell function; HOMA-IR, homeostasis model of assessment-insulin resistance; GLP-1, glucagon-like peptide-1; GIP, glucose-dependent insulinotropic peptide; DM, diabetes mellitus.
aAccording to the method section, it should be 2-hour plasma glucose during 75 g oral glucose tolerance test. Or, the authors should mention that they performed postprandial measures, too.
Table 3. Relationship between Serum Incretin Levels and Development of Diabetes
1st 2nd 3rd 4th 5th
GLP-1 quintile
Model 1a 1.00 1.34 (0.56–3.21) 1.11 (0.45–2.77) 0.94 (0.36–2.45) 0.65 (0.24–1.74)
Model 2b 1.00 1.57 (0.64–3.87) 1.41 (0.54–3.65) 1.22 (0.45–3.32) 0.89 (0.32–2.52)
Model 3c 1.00 2.05 (0.76–5.55) 1.80 (0.64–5.08) 1.38 (0.47–4.01) 0.79 (0.26–2.41)
GIP quintile
Model 1a 1.00 1.51 (0.54–4.24) 1.84 (0.67–5.05) 2.34 (0.88–6.26) 2.89 (1.08–7.75)d
Model 2b 1.00 1.53 (0.52–4.45) 2.13 (0.75–6.06) 2.74 (0.99–7.55) 3.64 (1.30–10.20)d
Model 3c 1.00 1.60 (0.52–4.94) 2.31 (0.76–6.99) 2.52 (0.87–7.31) 3.82 (1.26–11.54)d
Values are expressed as odds ratio (95% confidence interval).
GLP-1, glucagon-like peptide-1; GIP, glucose-dependent insulinotropic peptide.
aModel 1: unadjusted; bModel 2: age, sex, body mass index (BMI) adjusted; cModel 3: age, sex, BMI, hemoglobin A1c adjusted; dP<0.05.
NGT and those with IGT [17]. In addition, recent case-control study also found no difference in fasting GLP-1 among normal, prediabetes and diabetes groups [18]. The present study had similar findings when comparing GLP-1 levels in normal and diabetic subjects on enrollment (data not shown).
GIP was the first incretin identified. In addition to stimulating insulin secretion, GIP plays regulatory roles in the maintenance, growth and survival of pancreatic islets, as well as impacting on adipocyte function [19]. In the present study, GIP levels were increased significantly in subjects who later developed diabetes.
This result is also in line with previous report showing that GIP levels were significantly elevated in newly-diagnosed diabetes group when compared with the normal group [18]. The mecha- nisms for these findings are unclear, but GIP elevations might be caused by GIP receptor resistance or defective GIP receptor expression. GIP receptor gene polymorphism was shown to be associated with diabetes and the metabolic syndrome, and GIP receptor polymorphism has begun to receive more attention than GIP plasma levels [20]. GIP/GIP receptor axis is also known to be disrupted in insulin-resistant states, such as obesity [21]. A meta-analysis of nine genome-wide association studies was conducted in order to identify T2DM-associated loci, and it was concluded that genetic variation in the GIP receptor influ- ences glucose and insulin responses to an oral glucose challenge [22]. Most recent study found that up-regulation of GIP produc- tion through interaction with GIP receptors on islets may be a key factor in multi-hormonal dysregulation in T2DM [18]. Ad- ditionally, similar findings were reported in various animal models [23-25]. Our results are in accordance with many stud- ies [26] supporting the role of GIP in an early pathophysiologi- cal step that could lead to T2DM. GIP secretion was also known to be preserved in response to OGTT or meal test in patients with T2DM [27], but the effect of GIP on insulin is blunted [28]. Collectively, increased GIP levels may lead to develop- ment of T2DM in similar way like insulin resistance.
However, GIP level in subjects with diabetes was not differ- ent from the GIP level of the subjects who remained normal during follow-up period. GIP level decrement after diabetes development is hard to explain because little is known about the molecular mechanism of GIP secretion, although several factors which are associated with GIP gene expression have been reported [29,30]. Recent experimental study with T2DM patients found that GIP has negligible effect on plasma glucose at fasting glycemia but it retains insulinotropic effects only during hyperglycemia [31]. Therefore, full GIP response data after meal is further needed to explain this result. Similar pat-
terns are also seen in C-peptide changes during T2DM devel- opment. In the early of stages of T2DM, C-peptide levels are usually elevated compared to normal subjects; however, as the duration of T2DM becomes longer, C-peptide levels decrease [32]. ALT was associated with increase in the risk of T2DM even if it is not elevated in the subjects with diabetes [12]. An- other explanation is that GIP level can be affected by anti-dia- betic drugs. We could not adjust the effect of glucose lowering medication on the serum incretin level in the diabetes group due to lack of data. However, incretin mimetics were not avail- able in the year of 2001 to 2002. Further investigations are re- quired to clarify the causal relationships between the GIP level and diabetes development.
To the best of our knowledge, this is the first study that mea- sured incretin levels in a large Asian community-based cohort.
Moreover, this was an 8-year prospective study of the relation- ship between incretin hormones and diabetes development.
The most significant limitation is that the samples were fasting samples, and thus it was impossible to determine the response of incretin hormones to meal stimuli. However, it seems rea- sonable to assume that fasting total GIP levels might be used to estimate enteroinsular axis like the homeostasis model assess- ment. In homeostasis model assessment, FPG and insulin lev- els are used to estimate insulin resistance and β-cell function [14]. Another limitation is that the samples were not preserved in DPP4 inhibitor containing tube.
In summary, elevated GIP levels were associated with in- creased diabetes risk in this study. After adjusting for other as- sociated risk factors, fasting GIP levels might be a risk factor for the development of diabetes mellitus, suggesting that dete- rioration in the enteroinsular axis might occur before diabetes develops.
CONFLICTS OF INTEREST
No potential conflict of interest relevant to this article was re- ported.
ACKNOWLEDGMENTS
We are grateful to Bong Deok Kim and Hyun Kyu Kim, staff at the Center for Clinical Epidemiology at the Ajou University School of Medicine, for their effort in managing the Korean Health and Genome Study. This study was supported by the Samsung Medical Center Clinical Research Development Pro- gram grant #CRS-110-22-1 and National Genome Research
Institute, the Korean Center for Disease Control and Prevention (contract #2001 to 2003-348-6111-221, 2004-347-6111-213 and 2005-347-2400-2440-215). The funding source had no role in the collection of the data or in the decision to submit the manuscript for publication.
REFERENCES
1. Chia CW, Egan JM. Incretin-based therapies in type 2 dia- betes mellitus. J Clin Endocrinol Metab 2008;93:3703-16.
2. Nauck M, Stockmann F, Ebert R, Creutzfeldt W. Reduced incretin effect in type 2 (non-insulin-dependent) diabetes.
Diabetologia 1986;29:46-52.
3. Nauck MA, Heimesaat MM, Orskov C, Holst JJ, Ebert R, Creutzfeldt W. Preserved incretin activity of glucagon-like peptide 1 [7-36 amide] but not of synthetic human gastric inhibitory polypeptide in patients with type-2 diabetes mel- litus. J Clin Invest 1993;91:301-7.
4. Lee S, Yabe D, Nohtomi K, Takada M, Morita R, Seino Y, et al. Intact glucagon-like peptide-1 levels are not decreased in Japanese patients with type 2 diabetes. Endocr J 2010;57:119- 26.
5. Oh TJ, Kim MY, Shin JY, Lee JC, Kim S, Park KS, et al. The incretin effect in Korean subjects with normal glucose toler- ance or type 2 diabetes. Clin Endocrinol (Oxf) 2014;80:221- 7.
6. Calanna S, Christensen M, Holst JJ, Laferrere B, Gluud LL, Vilsboll T, et al. Secretion of glucagon-like peptide-1 in pa- tients with type 2 diabetes mellitus: systematic review and meta-analyses of clinical studies. Diabetologia 2013;56:965- 72.
7. Yabe D, Seino Y, Fukushima M, Seino S. β Cell dysfunc- tion versus insulin resistance in the pathogenesis of type 2 diabetes in East Asians. Curr Diab Rep 2015;15:602.
8. Rhee SY, Woo JT. The prediabetic period: review of clini- cal aspects. Diabetes Metab J 2011;35:107-16.
9. Brambilla P, La Valle E, Falbo R, Limonta G, Signorini S, Cappellini F, et al. Normal fasting plasma glucose and risk of type 2 diabetes. Diabetes Care 2011;34:1372-4.
10. Vollmer K, Holst JJ, Baller B, Ellrichmann M, Nauck MA, Schmidt WE, et al. Predictors of incretin concentrations in sub- jects with normal, impaired, and diabetic glucose tolerance. Dia- betes 2008;57:678-87.
11. Rask E, Olsson T, Soderberg S, Holst JJ, Tura A, Pacini G, et al. Insulin secretion and incretin hormones after oral glu- cose in non-obese subjects with impaired glucose tolerance.
Metabolism 2004;53:624-31.
12. Cho NH, Jang HC, Choi SH, Kim HR, Lee HK, Chan JC, et al. Abnormal liver function test predicts type 2 diabetes: a community-based prospective study. Diabetes Care 2007;
30:2566-8.
13. Report of the Expert Committee on the diagnosis and clas- sification of diabetes mellitus. Diabetes Care 1997;20:1183- 97.
14. Matthews DR, Hosker JP, Rudenski AS, Naylor BA, Treacher DF, Turner RC. Homeostasis model assessment:
insulin resistance and beta-cell function from fasting plas- ma glucose and insulin concentrations in man. Diabetologia 1985;28:412-9.
15. Vilsboll T, Krarup T, Deacon CF, Madsbad S, Holst JJ. Re- duced postprandial concentrations of intact biologically ac- tive glucagon-like peptide 1 in type 2 diabetic patients. Dia- betes 2001;50:609-13.
16. Toft-Nielsen MB, Damholt MB, Madsbad S, Hilsted LM, Hughes TE, Michelsen BK, et al. Determinants of the im- paired secretion of glucagon-like peptide-1 in type 2 dia- betic patients. J Clin Endocrinol Metab 2001;86:3717-23.
17. Smushkin G, Sathananthan A, Man CD, Zinsmeister AR, Ca- milleri M, Cobelli C, et al. Defects in GLP-1 response to an oral challenge do not play a significant role in the pathogene- sis of prediabetes. J Clin Endocrinol Metab 2012;97:589-98.
18. Chia CW, Odetunde JO, Kim W, Carlson OD, Ferrucci L, Egan JM. GIP contributes to islet trihormonal abnormalities in type 2 diabetes. J Clin Endocrinol Metab 2014;99:2477- 85.
19. McIntosh CH, Widenmaier S, Kim SJ. Glucose-dependent insulinotropic polypeptide signaling in pancreatic β-cells and adipocytes. J Diabetes Investig 2012;3:96-106.
20. Holst JJ, Gromada J, Nauck MA. The pathogenesis of NI- DDM involves a defective expression of the GIP receptor.
Diabetologia 1997;40:984-6.
21. Ceperuelo-Mallafre V, Duran X, Pachon G, Roche K, Gar- rido-Sanchez L, Vilarrasa N, et al. Disruption of GIP/GIPR axis in human adipose tissue is linked to obesity and insulin resistance. J Clin Endocrinol Metab 2014;99:E908-19.
22. Saxena R, Hivert MF, Langenberg C, Tanaka T, Pankow JS, Vollenweider P, et al. Genetic variation in GIPR influences the glucose and insulin responses to an oral glucose chal- lenge. Nat Genet 2010;42:142-8.
23. Lynn FC, Pamir N, Ng EH, McIntosh CH, Kieffer TJ, Ped- erson RA. Defective glucose-dependent insulinotropic polypeptide receptor expression in diabetic fatty Zucker
rats. Diabetes 2001;50:1004-11.
24. Gupta D, Peshavaria M, Monga N, Jetton TL, Leahy JL.
Physiologic and pharmacologic modulation of glucose-de- pendent insulinotropic polypeptide (GIP) receptor expres- sion in beta-cells by peroxisome proliferator-activated recep- tor (PPAR)-gamma signaling: possible mechanism for the GIP resistance in type 2 diabetes. Diabetes 2010;59:1445-50.
25. Yamada Y, Seino Y. Physiology of GIP: lesson from GIP receptor knockout mice. Horm Metab Res 2004;36:771-4.
26. Cho YM, Merchant CE, Kieffer TJ. Targeting the glucagon receptor family for diabetes and obesity therapy. Pharmacol Ther 2012;135:247-78.
27. Calanna S, Christensen M, Holst JJ, Laferrere B, Gluud LL, Vilsboll T, et al. Secretion of glucose-dependent insulino- tropic polypeptide in patients with type 2 diabetes: system- atic review and meta-analysis of clinical studies. Diabetes Care 2013;36:3346-52.
28. Fetner R, McGinty J, Russell C, Pi-Sunyer FX, Laferrere B.
Incretins, diabetes, and bariatric surgery: a review. Surg Obes Relat Dis 2005;1:589-97.
29. Baggio LL, Drucker DJ. Biology of incretins: GLP-1 and GIP. Gastroenterology 2007;132:2131-57.
30. Parker HE, Habib AM, Rogers GJ, Gribble FM, Reimann F.
Nutrient-dependent secretion of glucose-dependent insulin- otropic polypeptide from primary murine K cells. Diabeto- logia 2009;52:289-98.
31. Christensen MB, Calanna S, Holst JJ, Vilsboll T, Knop FK.
Glucose-dependent insulinotropic polypeptide: blood glu- cose stabilizing effects in patients with type 2 diabetes. J Clin Endocrinol Metab 2014;99:E418-26.
32. Neufeld ND, Raffel LJ, Landon C, Chen YD, Vadheim CM. Early presentation of type 2 diabetes in Mexican- American youth. Diabetes Care 1998;21:80-6.