CORROSION SCIENCE AND TECHNOLOGY, Vol.15, No.6(2016), pp.311~313 pISSN: 1598-6462 / eISSN: 2288-6524 DOI: http://dx.doi.org/10.14773/cst.2016.15.6.311
311
1. Introduction
The anodic dissolution of the brass (Cu-Zn alloy) has been investigated to clarify the detailed mechanisms for the selective dissolution1-13). Generally, zinc is preferen- tially dissolved from a Cu-Zn alloy in the aqueous sol- ution, namely, dezincification. Pickering et al.1,3-5) re- ported the fundamental studies of the anodic dissolution of a Cu-Zn alloy. They indicated that a porous Cu-rich layer was formed on the surface of a Cu-Zn alloy because of the preferential dissolution of zinc from the Cu-Zn alloy. They proposed the two types of the dissolution mechanisms, which were simultaneous and selective.
An electrochemical impedance spectroscopy (EIS) was used in order to discuss the detailed dissolution behaviour of a Cu-Zn alloy because the EIS enables us to discrim- inate the time constants of elementary steps in the dis- solution process of metal14,15). Our group has been studied the dissolution mechanism of copper15,16). In this study, we focused on the impedance analysis of a Cu-Zn alloy to examine the dezincification.
2. Experimental Procedure
All electrochemical measurements were performed by a three-electrode system using potentio/galvanostat (Solartron SI1287 ELECTROCHEMICAL INTERFACE). A pure Zn, a
pure Cu and a brass (Cu-Zn) were used as a working electrode.
The surface was abraded by #2000 emery paper under running water before the electrochemical measurements. The surface area of each sample was 0.785 cm2. A KCl-saturated sil- ver/silver chloride electrode (SSE) was used as a reference electrode, and a Pt wire was used as a counter-electrode.
The electrolyte solution was 0.5 M NaCl containing 5 mM NaHCO3. The rest potential Erest was monitored during the immersion test. The anodic polarization curves were measured just after immersion. The potential range was from rest potential Erest to 0.5 vs. SSE, and the scan rate was 100 mV min-1. Impedance spectra were measured in the frequency range from 10 mHz to 10 kHz at five fre- quencies per decade with an AC amplitude of 10 mV.
The applied DC potential difference was -0.1 V vs. SSE for the Cu and Erest vs. SSE for the Cu-Zn.
3. Resutls and Discussion
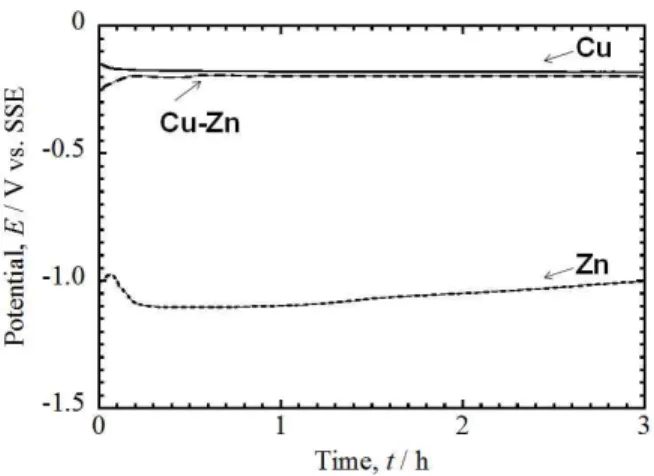
Fig. 1 represents the changes of the rest potential Erest
of Cu, Zn and the Cu-Zn alloy during the immersion test.
Erest of Cu shifted negatively and became stable at -0.168
± 0.005 V vs. SSE. Erest of Zn indicated the positive shift, dropped briefly around 500 s, then shifted positively again.
On the other hand, Erest of the Cu-Zn alloy was shifted rapidly in the positive direction but became stable around -0.2V ± 0.005 V vs. SSE. Thus, Erest of the Cu, the Zn, and the Cu-Zn alloy after 3h immersion was in the the following order: Zn < Cu-Zn < Cu. These results indicate
Electrochemical Impedance Study for Selective Dissolution of a Cu-Zn Alloy
Y. Hoshi1,2,†, K. Tabei1, I. Shitanda1,2, and M. Itagaki1,2
1Department of Pure and Applied Chemistry, Faculty of Industrial Science and Technology, Tokyo University of Science, 2641 Yamazaki, Noda, Chiba 278-8510, Japan
2Research Institute for Science and Technology, Tokyo University of Science, 2641 Yamazaki, Noda, Chiba 278-8510, Japan (Received September 22, 2016; Revised September 22, 2016; Accepted November 29, 2016)
The anodic dissolution behavior of copper and brass in an electrolyte solution of 0.5M NaCl containing 0.5 mM NaHCO3 was investigated by electrochemical impedance spectroscopy. The Nyquist plots of the copper impedance described a small loop in the high-frequency range and a large locus in the low-frequency range. Additionally, the features of the impedance spectrum of the brass were similar to those of the copper.
This indicates that the copper-enriched layer formed on the brass surface due to the selective dissolution of the zinc from the surface. In addition, the rest potential and the anodic polarization curve for each sample were measured in order to discuss the selective dissolution of the zinc from the brass surface.
Keywords : Cu-Zn alloy, selective dissolution, dezincification, electrochemical impedance spectroscopy
†Corresponding author: [email protected]
Y. HOSHI, K. TABEI, I. SHITANDA, AND M. ITAGAKI
312 CORROSION SCIENCE AND TECHNOLOGY Vol.15, No.6, 2016
that the Zn is dissolved preferentially from the Cu-Zn al- loy at the initial stage, leading to the formation of a Cu-en- riched layer on the Cu-Zn alloy. The dissolution rate of the Zn is dropped to rates similar to that of the Cu dis-
solution under steady-state condition, demonstrating the simultaneous dissolution of Cu and Zn from the Cu-Zn alloy. The behaviour of the rest potential for Cu-Zn was in good agreement with the results of the binary Pt alloys in sulphuric acid solution17,18).
The anodic polarization curves of the Zn, the Cu, and the Cu-Zn alloy were shown in Fig. 2. The measurements of the anodic polarization curves were carried out just after the immersion of the samples. The Erest of each sample was –1.1, -0.26, and -0.19 V vs. SSE. The current density of the Zn was increased with increasing of the polarization potential, indicating the dissolution of Zn. The current density of the Cu was increased until 0.05 V vs. SSE, decreased slightly, and then increased again. In case of the Cu-Zn alloy, the behaviour of the anodic polarization curve was similar to that of the Cu. The current density of the Cu-Zn alloy was larger than that of the Cu until 0.17 V vs. SSE, indicating the dissolution of the Zn.
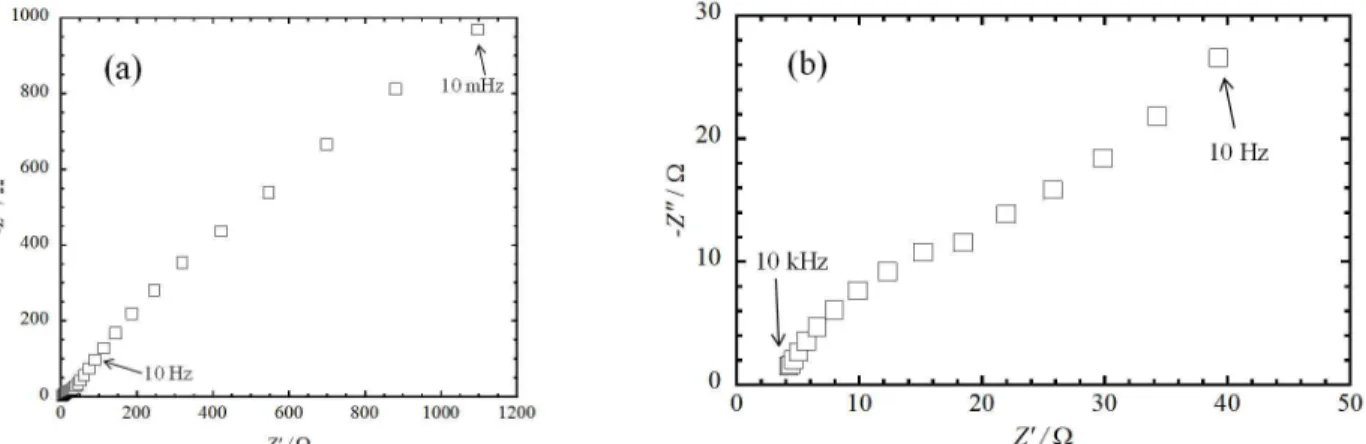
Fig. 3 shows the impedance spectrum of the Cu meas- ured at -0.10V vs. SSE. The full range of the impedance spectrum described the large locus in the low frequency range. In case of the expanded of the high frequency range shown in Fig. 3(b), the small loop was observed in the high frequency range. These results indicated that the high frequency loop and the low frequency locus were related to the electrode/solution interface and the Cu film formed on the surface, respectively. On the other hand, the im- pedance spectra of the Cu-Zn alloy measured at the Erest
was represented in Fig. 4. Before the impedance measure- ment, the galvanostatic polarization of the Cu-Zn alloy was conducted at 1.0 mA cm-2 for 24 h to form the Cu-en- riched layer on the surface. The electrolyte solution of 0.5 M NaCl containing 5 mM NaHCO3 was kept at 60 ˚C by thermostatic bath during the galvanostatic polarization.
The full range of the impedance spectrum in Fig. 4(a) showed the large locus in the low frequency range. The Fig. 1. Changes of the rest potential Erest of Cu, Zn, and
the Cu-Zn alloy during the immersion test.
Fig. 2. Anodic polarization curves of the Zn, the Cu, and the Cu-Zn alloy.
Fig. 3. Impedance spectrum of the Cu in 0.5M NaCl containing 5 mM NaHCO3 (a) Full range, (b) Expanded of the high frequency range.
ELECTROCHEMICAL IMPEDANCE STUDY FOR SELECTIVE DISSOLUTION OF A CU-ZN ALLOY
313 CORROSION SCIENCE AND TECHNOLOGY Vol.15, No.6, 2016
small loop appeared in the high frequency range in Fig.
4(b). These results demonstrated that the impedance spec- trum of the Cu-Zn alloy in Fig. 4(b) was similar to that of the Cu in Fig. 3(b). The discussion of the both results were following. The surface of the Cu-Zn alloy was fully covered with the Cu-enriched layer due to the selective dissolution of the Zn. At the rest potential Erest of the Cu-Zn, the rate of the Zn dissolution drops to the similar level of the Cu dissolution. In this stage, the dissolution of Zn was supressed by the Cu-enriched layer. According to the results of Fig. 4, the impedance spectrum of the Cu-Zn alloy was similar to that of the Cu in Fig. 3. It indicates that electrochemical properties of the Cu-Zn alloy could be discussed by that of the Cu in these conditions.
4. Summary
The selective dissolution of the Cu-Zn alloy was inves- tigated by monitoring of the rest potential Erest, measure- ment of the anodic polarization curve and EIS in 0.5M NaCl containing 5 mM NaHCO3. In the immersion test, values of Erest of the Cu-Zn alloy was shifted rapidly in the noble direction just after immersion. The value of Erest
for Cu-Zn alloy approached to that for the Cu, indicating the formation of the Cu-enriched layer on the surface of the Cu-Zn alloy. The anodic polarization curve of the Cu-Zn was similar to that of the Cu although the current density of the Cu-Zn was larger than that of the Cu. On the Nyquist plane, the plots of impedance of the Cu was describe the small loop in the high frequency range and the large locus in the low frequency range. The feature for the impedance spectrum of the Cu-Zn alloy was similar to that of the Cu, indicating that surface of the Cu-Zn alloy was fully covered with the Cu-enriched layer. Thus, these results implies that the conditions of the Cu-Zn alloy was
evaluated by that of the Cu using EIS.
References
1. H. W. Pickering, C. Wagner, J. Electrochem. Soc., 114, 698 (1967).
2. H. G. Feller, Corros. Sci., 8, 259 (1968).
3. H. W. Pickering, J. Electrochem. Soc., 115, 143 (1968).
4. H. W. Pickering, J. Electrochem. Soc., 115, 690 (1968).
5. H. W. Pickering, and P. J. Byrne, J. Electrochem. Soc., 116, 1492 (1969).
6. V. G. Ereneta, Corros. Sci., 19, 507 (1979).
7. A. P. Pchelnikov, A. D. Sitnikov, I. K. Marshakov, and V. V. Losev, Electrochim. Acta, 26, 591 (1981).
8. A. V. Polunin, A. P. Pchelnikov, V. V. Losev, and I. K.
Marshakov, Electrochim. Acta, 27, 467 (1982).
9. M. J. Pryor and K. K. Giam, J. Electrochem. Soc., 129, 2157 (1982).
10. M. J. Pryor and J. C. Fister, J. Electrochem. Soc., 131, 1230 (1984).
11. S. L. F. A. Dacosta, S. M. L. Agostinho, and K. Nobe, J. Electrochem. Soc., 140, 3483 (1993).
12. V. Maurice, L. H. Klein, H. H. Strehblow, and P. Marcus, J. Electrochem. Soc., 150, B316 (2003).
13. I. Milosev and H. H. Strehblow, J. Electrochem. Soc., 150, B517 (2003).
14. M. Itagaki, M. Tagaki, and K. Watanabe, Electrochim. Acta, 41, 1201 (1996).
15. M. Itagaki, M. Tagaki, and K. Watanabe, Corros. Sci., 38, 1109 (1996).
16. M. Itagaki, M. Tagaki, T. Mori, and K. Watanabe, Corros.
Sci., 38, 601 (1996).
17. Y. Hoshi, T. Yoshida, A. Nishikata, and T. Tsuru, Electrochim.
Acta, 56, 5302 (2011).
18. Y. Hoshi, R. Ozawa, E. Tada, A. Nishikata, and T. Tsuru, Corros. Sci., 65, 512 (2012).
Fig. 4. Impedance spectrum of the Cu-Zn alloy in 0.5M NaCl containing 5 mM NaHCO3(a) Full range, (b) Expanded of the high frequency range.