Vol. 17, No. 1 pp. 538-543, 2016
Data-based On-line Diagnosis Using Multivariate Statistical Techniques
Hyun-Woo Cho
1*1Department of Industrial and Management Engineering, Daegu University
다변량 통계기법을 활용한 데이터기반 실시간 진단
조현우1*
1대구대학교 산업경영공학과
Abstract For a good product quality and plant safety, it is necessary to implement the on-line monitoring and diagnosis schemes of industrial processes. Combined with monitoring systems, reliable diagnosis schemes seek to find assignable causes of the process variables responsible for faults or special events in processes. This study deals with the real-time diagnosis of complicated industrial processes from the intelligent use of multivariate statistical techniques. The presented diagnosis scheme consists of a classification-based diagnosis using nonlinear representation and filtering of process data. A case study based on the simulation data was conducted, and the diagnosis results were obtained using different diagnosis schemes. In addition, the choice of future estimation methods was evaluated. The results showed that the performance of the presented scheme outperformed the other schemes.
요 약 고품질의 제품과 조업 안전을 확보하기 위해서는 적절한 실시간 공정 감시 및 진단 시스템이 설치되어있는 것이 무엇보다 중요하다. 공정 감시 시스템과 결합된 신뢰도 높은 진단 시스템은 공정에서 발생한 특별한 사건이나 사고의 근본적 인 원인과 공정 변수를 알려준다. 본 연구에서는 다변량 통계 분석과 분류기법에 기반한 공정진단 체계를 제시한다. 이 진단 시스템은 비선형 데이터 표현과 필터링을 통한 지능적 데이터 표현으로 구성되어 있다. 진단 성능을 평가하기 위해 사례연구 를 수행하였으며 다른 방법론과의 결과를 비교하기 위하여 진단 결과와 미래값 추정 방법을 평가하였다. 그 결과 본 연구에 서 비교된 진단 방법론들에 비해 신뢰도 높은 진단 결과를 얻을 수 있었다.
Keywords : Diagnosis, Estimation, Filtering, Multivariate Statistical Methods, Process Data
This work was supported by the Daegu University Research Grant, 2011.
*Corresponding Author : Hyun-Woo Cho(Daegu University) Tel: +82-2-850-6540 email: hwcho@daegu.ac.kr
Received September 22, 2015 Accepted January 5, 2016
Revised January 4, 2016 Published January 31, 2016
1. Introduction
In terms of productivity and quality improvement, fault diagnosis of industrial processes is one of the important tasks. It seek to identify an assignable cause of the detected abnormal event. Then, operating personnel often take remedial actions based on diagnostic decisions provided.[1] Among many diagnosis approaches developed multivariate statistical
approaches have been frequently utilized in an real-time bassis because they are easy to implement using process measurement data. It is mainly attributed to the recent advances in big data acquisition and sensor technologies.[2]
The selection of linear/nonlinear techniques in solving fault diagnosis depends on the nature of target processes. In general, the utilization of linear techniques in nonlinear case may not yield satisfactory
results. On the other hand, it may need noise filtering during the processing of raw process data because all data points don’t have same importance in determining assignable causes. It means that the execution of filtering can help analyze and interpret the diagnosis process data of interest. It may also lead to the storage reduction and performance improvement in the on-line diagnosis of processes.[3]
The objective of this paper is to present the use of nonlinear discriminant analysis combined with filtering of raw data for diagnosing batch processes. For this end, referenced diagnosis model is constructed using process data obtained from past batch operation, based on which diagnostic decisions of new batches are made on-line for further monitoring of future operations. The adoption of nonlinear and filtering techniques is expected to decrease the data size in handling original data sets and to produce efficient representation of the measurement data that is suitable for differentiating different fault groups.
The performance of the diagnostic scheme is demonstrated using a case study of an industrial batch process. In general, batch processes are frequently used in the production of high value-added products, but are difficult to monitor and control due to the complicated nonlinearity of process measurement data. This paper is organized as follows. First, relevant theoretical aspects and diagnostics are given, and then a case study is conducted to demonstrate the performance of the diagnostics. Finally, concluding remarks are given.
2. Method
Discriminant analysis is one of statistical methods to classify various groups of data. It is necessary to find certain directions w, along which the latent groups are discriminated as clearly as possible. Mathematically, this direction is determined by maximizing the ratio of between-group covariance matrix Cb against within-group covariance matrix Cw. Actually, w is
given by solving [4]:
0 w C
C − ) =
( b λ w (1)
For a two class example, linear discriminant analysis is formulated as linear projection of data as follows:
x w
x T
f( )= (2)
Here, w is chosen to maximize the following Rayleigh coefficient
w C w
w C w w
w T
b T
J( )=
(3) Principal component analysis (PCA) and Fisher discriminant analysis (FDA) are well-known linear representation methods for handling massive data sets.
PCA is based on the decomposition of correlated variables into an independent set of reduced variables.
On the other hand, FDA seeks to find a lower-dimensional representation of data in that several groups can be discriminated as clearly as possible.
Figure 1 shows, for example, a difference between the two methods, in which with two variables and two classes displayed and the two different groups are better separated by FDA than PCA.[5]
Fig. 1. Graphical description of PCA and FDA
Kernel Fisher’s discriminant analysis (KFDA) executes linear FDA resulting in a set of nonlinear discriminant vectors. These discriminant vectors can be obtained by maximizing
ψ S ψ
ψ S ψ ψ Φ
t Φ Φ b
J ( )= TT
(4) where SΦband SΦt is between-class and total scatter matrixes, respectively. Finally, optimal discriminant
vectors are given by solving ψ
S ψ SΦ Φt
b =λ (5)
There exist coefficients bi such that Hα
x
ψ ∑
= =
=M
k bkΦ k
1 ( ) , (6)
where H=
[
Φ(x1),...,Φ(xM)]
and α=(b1,...,bM)T. In this work the objective of preprocessing or filtering based on orthogonal signal correction (OSC) is to remove from the data X unwanted variation orthogonal to response variable matrix Y. It can selectively get rid of the largest variation of the data without the correlation with response variables. It calculates the first principal score vector t from X. The score vector t is then orthogonalized with respect to Y, producing the following actual correction vector t*:. } ) (
{ 1
* I Y Y Y Y t
t = − T − T (7)
Then it is necessary to compute weight vector w such that Xw=t*, which is followed by obtaining a new score vector, t=Xw. These processes are repeated until t has converged. Finally, a loading vector p is computed, and the correction term tpT is subtracted from X giving a residual. The next components can be calculated in such a way.[6]
In this work, a reference diagnosis model should be constructed off-line, based on which diagnostic decisions for a new on-going batch are made in an real-time basis. Thus the off-line KFDA diagnosis model is built to provide its assignable cause by classifying a new batch into one of predefined fault groups. Given an unfolded training data z and its mapped observation Φ(z), the discriminant score vector s is obtained:
) (z Ψ
s= TΦ (8)
By projecting the mapped observation Φ z( i) of zi
onto Ψ an off-line KFDA score vector si is given as follows:
)
T (
i
i ΨΦ z
s = (9)
( ,..., ) ,..., ( (1),..., ( ))T ( )
T
1 T 1
1 I i
r r
d Φz Φz Φz
β
β ⎟⎟
⎠
⎞
⎜⎜
⎝
= ⎛
λ γ λ γ
where β and λ are a set of eigenvectors and eigenvalues of St−1Sb and γ are orthonormal eigenvectors of K.
When a fault is detected during the new batch operation, the next task is to do real-time diagnostic decision-making, which is done iteratively during the new batch. To this end, it is consider the nature of batch data. Unlike continuous process data, batch process data is three-dimensional. It means that the new batch is not complete until the end of the operation. Thus future observations of the new batch data should be estimated somehow. There are several different approaches to estimating the future observations of batch data.[7] Let xnew(k*) be the completed new batch data at the fault detection time of the new batch k*. Then it consists of the observed part until k* and the estimated part of the unmeasured data after k*.
For the diagnosis of a new batch on-line an on-line score vector snew(k*) for xnew(k*) can be obtained by projecting the mapped observation Φ(xnew(k*)) of xnew(k*) onto the off-line discriminant vectors obtained before:
)) ( ( )
(k* TΦ new k*
new Ψ x
s = (10)
Then it is necessary to calculate the distance between the on-line and the off-line score vectors. As a result, the fault group with the minimum distance is selected as the assignable cause of the fault at k*. This process can be repeated for further diagnostic decisions.
3. Results
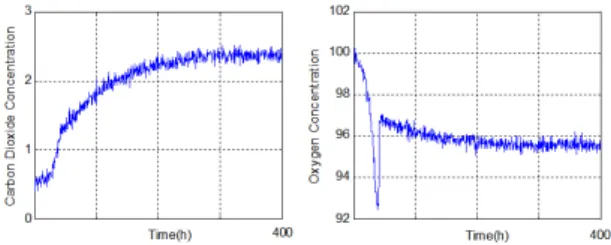
The performance of the proposed diagnostic method is demonstrated in this section using a case study of an industrial process. We utilized simulation data obtained from a penicillin process.[8] The penicillin process operates in a batch-wise manner and under closed-loop control. A total of fourteen process variables are
measured and utilized in this case study, in which some measurement noises are added to simulated data.
The trajectories of two process variables are shown in figure 2.
Fig. 2. Trajectories of two process variables
To evaluate the performance of the proposed diagnosis method, a total of 48 fault batches for four fault groups were generated. There are ten batch runs in each fault group for the case study. Each fault group has twelve fault batches, and then diagnostic model is constructed using a training data of a total of 40 batch runs (i.e., 10 runs from each of the four groups). This leads to the use of the eight batch runs as test data for this case study. First, a diagnosis model for the case study was built in an off-line basis using the training data. Here, the initial conditions of the simulation are as follows: reactor temperature(K) 297-300, pH 4.5-5.5, generated heat(cal) 0, CO2 concentration (mmol/l) 0.5-1.0, penicillin concentration(g/l) 0, biomass concentration(g/l) 0, dissolved oxygen concentration(mmol/l) 1.12-1.20, and substrate concentration(g/l) 14-19.
Fig. 3. Process variables
It is necessary, as shown in the introduction of KFDA, to select an appropriate kernel function for the process. Here it turned out that the second-order polynomial kernel is better to explain the nonlinearity of the data. Moreover, the fault library estimation approach was applied to produce the future values of the test data. In this work, different diagnosis schemes are compared and evaluated using the same test data.
Table 1. Results without filtering
Run PCA FDA KPCA
1 0.61 0.76 0.62
2 0.64 0.75 0.68
3 0.66 0.81 0.75
4 0.68 0.84 0.78
5 0.59 0.75 0.63
6 0.70 0.76 0.66
7 0.64 0.72 0.69
8 0.65 0.71 0.68
avg. 0.65 0.76 0.69
Table 1 shows the diagnosis results for the eight test batches. It listed the proportion of the observations correctly diagnosed so that higher values indicate better diagnosis results. For a various comparison purpose, these results were obtained from different three diagnostic schemes with no filtering: PCA, FDA, and KPCA-based methods. No filtering means that no preprocessing of the measurement data of this case study is executed before off-line model building and on-line diagnostic decision making at all. Additional diagnosis results with the filtering of the data will be given later.
Table 2. Results with filtered data
Run KPCA FDA KFDA
1 0.68 0.86 0.92
2 0.73 0.85 0.95
3 0.83 0.91 0.94
4 0.85 0.89 0.88
5 0.72 0.87 0.90
6 0.66 0.79 0.91
7 0.76 0.80 0.92
8 0.70 0.86 0.89
avg. 0.74 0.85 0.91
As shown in Table 1, the FDA-based diagnostic
scheme showed the best diagnosis performance in that it yielded the highest diagnosis success rate for all test batches. In terms of the average diagnosis success rate over the test batches, the FDA method outperforms the other methods of PCA and KPCA: 0.76 vs 0.69 (KPCA) and 0.65 (PCA). It should be noted that the FDA method outperforms linear and nonlinear PCA-based methods. It may be attributed to the fact that FDA seeks directions that are optimal for discrimination of different data groups. That is, it provides an efficient lower dimensional representation of data, in which different groups of data can be discriminated as clearly as possible.
Table 2 shows the diagnosis results of the test data sets based on KPCA, FDA, and KFDA. The difference between Table 1 and Table 2 is whether or not the filtering of the data is performed before the building of the diagnosis model. That is, in Table 2, preprocessing of the data is executed first, and then the subsequent tasks are done as stated earlier. As shown in Table 2, it turned out that the KFDA-based diagnosis scheme with filtering yielded the best diagnosis performance except run number 4 (i.e., 0.89 of FDA-based method vs. 0.88 of KFDA-based method). It is also observed that the average diagnosis success rate of the KFDA-based scheme is higher than those of the others (0.91, 0.85, and 0.74).
It is quite interesting to compare the results of Table 1 with those of Table 2 in terms of filtering effects.
For example, when the FDA-based method is used, the use of filtering of the data significantly improved diagnosis performance from 0.76 (Table 1) to 0.85 (Table 2): from 0.69 to 0.74 in case of KPCA. Thus the use of filtering of the data improves diagnosis performance in this case study. It should be also noted that the filtering step combined with the use of the nonlinear KFDA technique, as shown in the third column of Table 2, yielded the best diagnosis performance among them: from 0.76 (Table 1) to 0.91 (Table 2). Overall, FDA and nonlinear diagnosis schemes rather than PCA and linear ones produced
better performance for this case study.
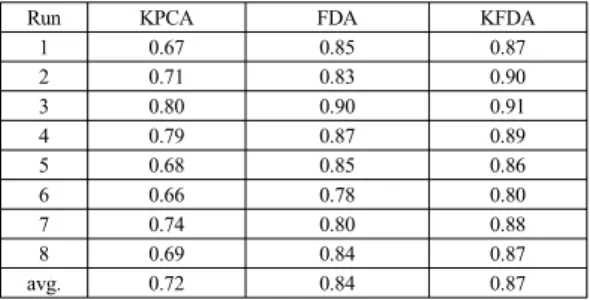
Table 3. Results using deviation values
Run KPCA FDA KFDA
1 0.67 0.85 0.87
2 0.71 0.83 0.90
3 0.80 0.90 0.91
4 0.79 0.87 0.89
5 0.68 0.85 0.86
6 0.66 0.78 0.80
7 0.74 0.80 0.88
8 0.69 0.84 0.87
avg. 0.72 0.84 0.87
On the other hand, Table 3 shows the diagnosis performance for the same test data, but at this time the different future estimation approach of current deviation is used to predict future measurements. As mentioned earlier, fault library approach was applied in case of Table 1 and Table 2.
Compared with Table 2, the diagnosis results of Table 3 degraded in most test runs of the test data. It means that the fault library approach for the estimation of future measurements is better than the current deviation approach in this case study. However, Table 3 (i.e., filtering and current deviation approach used) yielded better diagnosis performance than Table 1 (i.e., no filtering and fault library approach used). It is learned that the use of filtering is more critical in diagnosis performance in this case study rather than the choice of an appropriate future estimation approach.
4. Conclusion
In this work the use of process data combined with KFDA and filtering methods was presented and demonstrated. It turned out that the use of FDA produced better diagnosis performance than PCA.
Moreover, compared with linear techniques, the nonlinear technique of KFDA showed enhanced results for the test process data. The refinement of raw process data using the filtering step improved diagnosis results.
It was also found that the selection of estimation
method for the future values of batch data is critical.
As mentioned before, the identification of an assignable cause of faults is quite critical in terms of the prevention of overall failure of entire processes.
Thus it should be one of essential parts of the operational tasks for product quality and productivity.
Based on such reliable quality monitoring systems the diagnostic decisions helps operating personnel to take appropriate control actions in an real-time basis.
References
[1] S. Bersimis, S. Psarakis, and J. Panaretos, "Multivariate statistical process control charts: an overview", Quality and Reliability Engineering International, 23 (5), pp. 517 –543, 2007.
DOI: http://dx.doi.org/10.1002/qre.829
[2] S. J. Qin, "Survey on data-driven industrial process monitoring and diagnosis", Annual Reviews in Control, 36, pp. 220-234, 2012.
DOI: http://dx.doi.org/10.1016/j.arcontrol.2012.09.004 [3] S. J. Qin, "Statistical process monitoring: basics and
beyond", Journal of Chemometrics, 17, pp. 480–502, 2003.
DOI: http://dx.doi.org/10.1002/cem.800
[4] L. H. Chiang, E. L. Russell, and R. D. Braatz, "Fault diagnosis in chemical processes using Fisher discriminant analysis, discriminant partial least squares, and principal component analysis", Chemometrics and Intelligent Laboratory Systems, 50, pp. 243-252, 2000.
DOI: http://dx.doi.org/10.1016/S0169-7439(99)00061-1 [5] G. Baudat and F. Anouar, Generalized discriminant
analysis using a kernel approach. Neural Computation, 12, pp. 2385–2404, 2000.
DOI: http://dx.doi.org/10.1162/089976600300014980 [6] J. A. Westerhuis, S. Jong, and A. K. Smilde, “Direct
orthogonal signal correction”, Chemometrics and Intelligent Laboratory Systems, 56, pp. 13-25, 2001.
DOI: http://dx.doi.org/10.1016/S0169-7439(01)00102-2 [7] X. Meng, A. J. Morris, and E. B. Martin, “On-line
monitoring of batch processes using PARAFAC representation”, Journal of Chemometrics, 17, pp. 65– 81, 2003.
DOI: http://dx.doi.org/10.1002/cem.776
[8] G. Birol, C. Ǘndey, and A. Cinar, “A Modular simulation package for fed-batch fermentation: penicillin production”, Computers and Chemical Engineering, 26, pp. 1553-1565, 2002.
DOI: http://dx.doi.org/10.1016/S0098-1354(02)00127-8
Hyun-Woo Cho [Regular member]
•Aug.2003 : POSTECH., Industrial Eng., PhD
•Aug.2003 ∼ Aug.2007 : GIT/UT, Research Associate
•Sep. 2007 ∼ Feb. 2011 : SEC, Senior Engineer
•Mar. 2011 ∼ Current : Daegu Univ., Dept. of Industrial. &
Management Eng., Professor
<Research Interests>
Intelligent Process Monitoring, Data Mining
![Figure 1 shows, for example, a difference between the two methods, in which with two variables and two classes displayed and the two different groups are better separated by FDA than PCA.[5]](https://thumb-ap.123doks.com/thumbv2/123dokinfo/5379136.202876/2.799.482.645.613.777/figure-example-difference-methods-variables-displayed-different-separated.webp)