EQUILIBRIUM, MASS CONSERVATION,
AND KINETICS
Contents
1 Concentration
2 Species Mass Balance
(Mass Conservation)
3 Equilibrium
4 Chemical Kinetics:
Generation or Depletion of a Mass Species
5 Chapter Summary
Equilibrium, Mass Conservation, and Kinetics
1 Concentration
The subject of mass transfer involves movement of one mass species through one or more other species.
The quantity of a certain species is described by its concentration, which is defined as the amount of substance per unit mass or volume.
Thus, the two concentrations can be interchanged using the relation
Where MA is the molecular weight of component A.
Concentration in a Gaseous Mixture
In a mixture of perfect gases, the concentrations of individual gases can be calculated from their partial pressures. Using the ideal gas law for a mixture of gases of total volume V at temperature T, we can write for the component A
Where PA is the partial pressure of gas A for which there is nA moles are present and Rg is the gas constant.
Thus, concentration of any gas species i can be written as
The total concentration c is written as
Example 1 Concentration of Individual Gases in air
Consider an air-water vapor mixture at a total pressure of 1 atm and a temperature of 60℃ having 20% water vapor, 17% oxygen, and 63% nitrogen.
Calculate the molar and mass concentrations of each of the three gases in air.
Analysis: Molar concentration as
Mass concentration as
The total molar concentration of gases is given by
and the total molar concentration of gases is given by
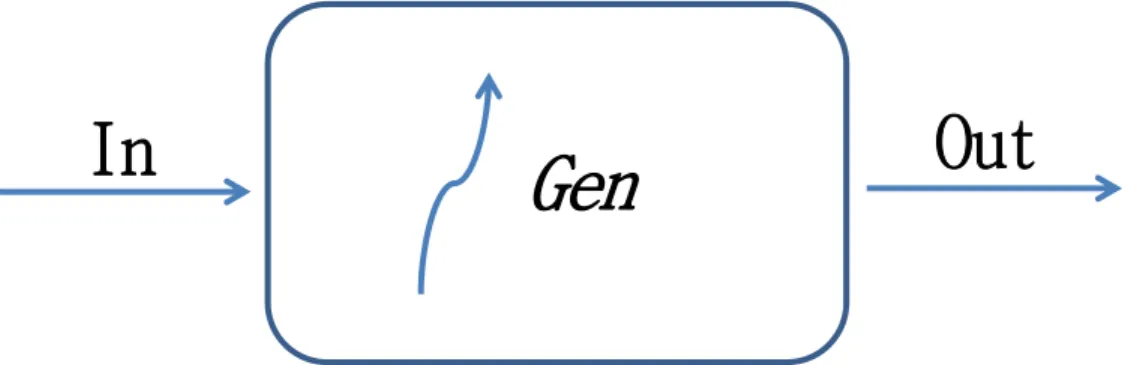
2 Species Mass Balance
(Mass Conservation)
In Out
Gen
Like total energy, total mass is conserved. For example, though chemical reactions.
Figure 1. A control volume for mass conservation showing different components.
A word equation for mass conservation of a species can be written from this figure as
3 Equilibrium
The transfer of mass within a phase or between two phases requires a departure from equilibrium.
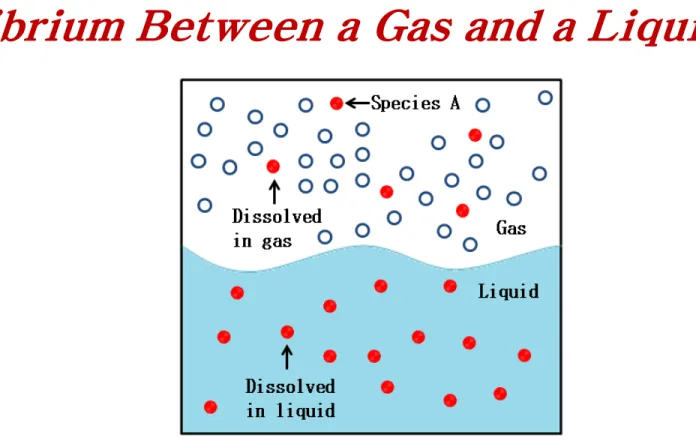
Equilibrium Between a Gas and a Liquid
Figure 2. Schematic of equilibrium between a gas and a liquid phase.
An example of equilibrium between gas and liquid is water saturated with dissolved oxygen in contact with air, as shown in Figure 9.3. Such
equilibrium between a gas and a liquid phase can be described by the well known Henry’s law:
Where pA is the partial pressure of species A in gas phase at equilibrium.
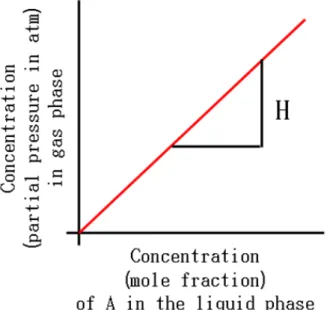
xA is the concentration of species A in liquid phase at equilibrium, and H is the Henry’s constant. Equation 9.6 is illustrated in Figure 9.5
Figure 3. Equilibrium relationship between a gas phase and a liquid phase following Henry’s law.
Henry’s constant for several gases in water are given in Figure 9.4.
Figure 4. Henry’s constant, H, for gases slightly soluble in water. Data abridged from Foust et al.(1960)
Example 2 Oxygen Concentration in Water in Equilibrium with Air
Water at 5℃ is in contact with a large volume of ordinary air at a total pressure of 1 atmosphere 1)How much oxygen is dissolved in the water in mgO2/liter of water? 2)What is the new amount of
oxygen dissolved in the same units? 3)What happens is water at 25℃
and having initially an amount of oxygen 10mg O2/liter of water?
Analysis:
1) pO2 = 0.21atm. Using Henry’s law to find the concentration
of oxygen in the water, xO2 , at equilibrium at 5 ℃:
2) Similarly, the amount of oxygen dissolved in water at 25℃ is
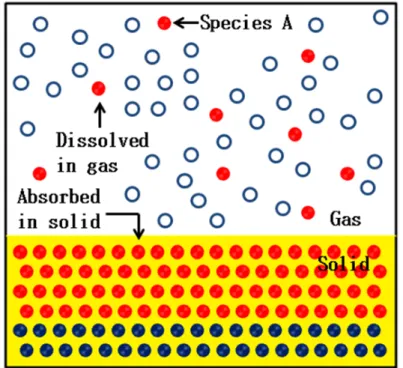
Equilibrium Between a Gas and a Solid (with Adsorbed Liquid)
The common example of a solid coming in equilibrium with a gas is the potato chip typically becoming soggy when left out of the package. The moisture in the potato chip comes to equilibrium with typically higher amount of water vapor in the outside air than inside the package.
Figure 5. Schematic of equilibrium between a gas and a solid phase.
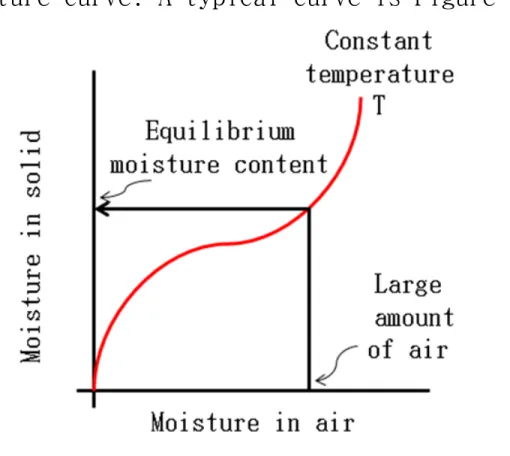
The relationship between the concentration of moisture in air and the
corresponding equilibrium moisture content of a solid can be expressed as an equilibrium moisture curve. A typical curve is Figure 6.
Figure 6. Typical equilibrium moisture isotherm.
Example of an empirical equation used to represent the equilibrium moisture content curve is:
Where RH is the relative humidity, b1 and b2 are constants, and w is the equilibrium moisture content(%).
Hygroscopic and non-hygroscopic solids
The moisture in air would come to equilibrium with moisture in the solid, as illustrated in Figure 6. This equilibrium relative humidity of the air is also called the water activity of the solid at its moisture content.
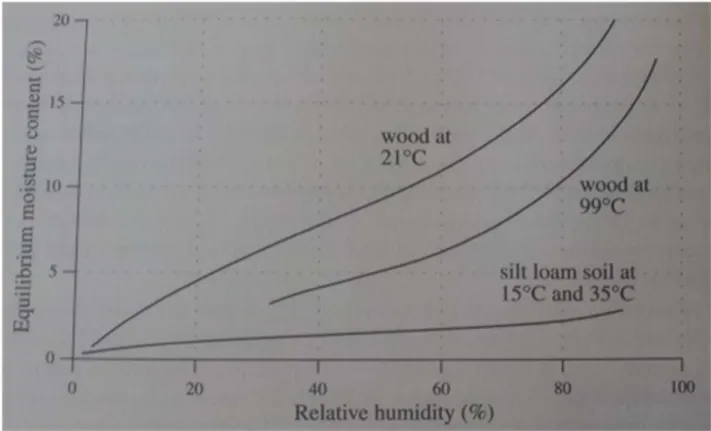
The equilibrium moisture isotherms in Figure 7 show that the relative
humidity and therefore the vapor pressure of air surrounding a solid in a closed system is function of both moisture content and temperature of the solid.
Figure 7. Moisture isotherm.
The vapor pressure above the surface as a function of temperature is given by the Clausius-Clapeyron equation:
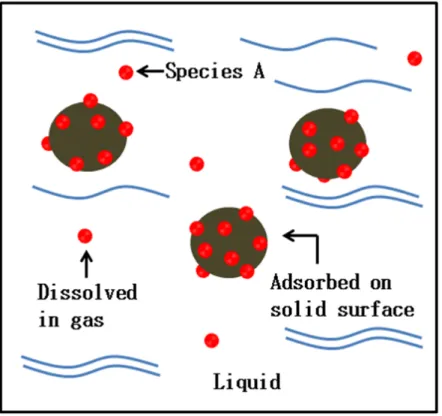
Equilibrium Between a Solid and a liquid in Adsorption
Consider a solid surface in contact with a liquid that has a dissolved species. As illustrated in Figure 9.10, some of the dissolved solute will bind to the solid surface, instead of remaining in solution.
Figure 8. Equilibrium between dissolved and surface adsorbed species.
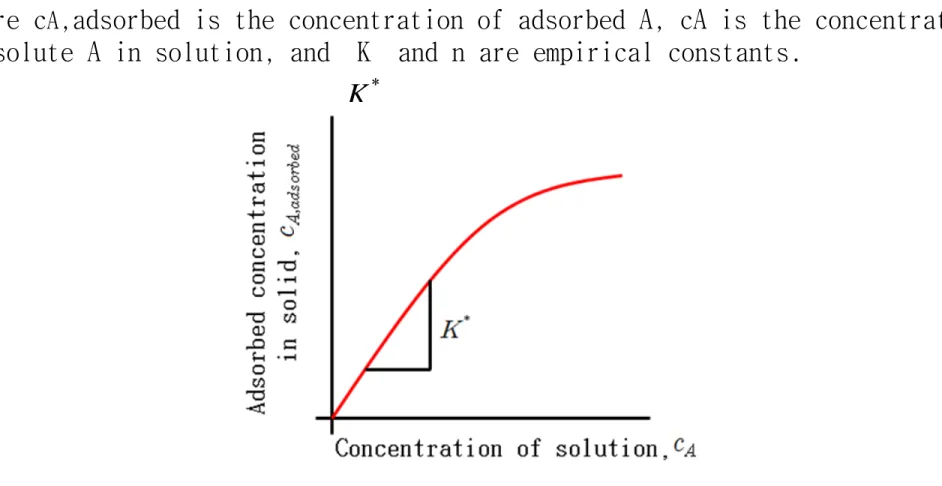
The isotherm shown in Figure 10 can be represented mathematically as
Where cA,adsorbed is the concentration of adsorbed A, cA is the concentration of solute A in solution, and K and n are empirical constants.
K
*Figure 10. Freundlich isotherm.
Chemical Kinetics is the study of the rate and mechanism by which one chemical species is converted to another species.
The rate of a chemical reaction is defined by
4 Chemical Kinetics:
Generation of Depletion of a Mass Species
Rate laws describe the dependence of the reaction rates on concentration.
Consider an irreversible reaction:
< are stoichiometric coefficient >
Rate law of Homogeneous Reactions
The rate of disappearance of A
a : the order of reaction with respect to A b : the order of reaction with respect to B a+b : the overall order of reaction
k'' : the reaction rate constant
※ While many variables may affect the reaction, temperature is the most important.
A reaction is of zeroth order when the rate of reaction is independent of the concentration of the species
Integrating, and noting that c can never becoming negative
Zeroth Order Reaction
Linear change in concentration for a zeroth order reaction..
The dashed line in the figure signifies that the zeroth order reaction may not continue all the way.
A reaction is first order when the rate of reaction is linearly related to the concentration of the species.
First Order Reaction
※ Exponential change in concentration for a first order reaction.
※ The concentration never actually reaches zero even though it becomes very small.
Half life for a first order reaction is a convenient alternative description of reaction rate that is used widely in practice.
※ Half-life :
defined as the time to change concentration by 50%.
Pesticide t1/2 in soil (days)
Health advisory level (μg/L or ppb)
Aldicarb 30 10
Atrazine 60 3
Carboxin 7 700
For example )
→
Half life of some important pesticides.Here the health advisory level is the concentration level of a substance which is considered safe to be consumed daily throughout a person’s lifetime.
Concentration change with time (due to decay) for the pesticides listed in Table.
When the mechanism of a reaction is not known, we often attempt to fit the data with an nth order rate equation of the form
Integrating :
Putting the limits and rearranging :
which provides concentration c as a function of time, t, for a nth order reaction.
nth Order Reaction
※ Higher temperature speeds up most reactions.
※ k0'' is called the frequency factor, Ea is called the activation energy (J/mole), Rg is the gas constant (J/mole·K), T is the absolute temperature in K.
Effects of Temperature.
▲ Equilibrium
1. Equilibrium between a gas and a liquid is described by Henry’s law.
2. Equilibrium between gas and a solid is described by isotherms.
3. Equilibrium between a solid and liquid in absorption.
Chapter Summary – Equilibrium, Mass Conservation, and Kinetics
▲ Kinetics of Chemical Reactions
1. A reaction where the rate is constant is called a zeroth order reaction.
2. A reaction is called first order whenever the reaction rate is proportional to the concentrationof a single reactant.
3. temperature dependency of reaction rate for most reactions if given by Eqn.