http://dx.doi.org/10.3988/jcn.2015.11.1.73 J Clin Neurol 2015;11(1):73-79
A Low Baseline Glomerular Filtration Rate Predicts Poor Clinical Outcome at 3 Months after Acute Ischemic Stroke
Hyung Jik Kim,a Jwa-Kyung Kim,a Mi Sun Oh,b Sung Gyun Kim,a Kyung-Ho Yu,b Byung-Chul Leeb
aDepartments of Internal Medicine and Kidney Research Institute and bNeurology, Hallym University Sacred Heart Hospital, Hallym University College of Medicine, Anyang, Korea
Received June 19, 2014 Revised September 10, 2014 Accepted September 11, 2014 Correspondence Byung-Chul Lee, MD, PhD Department of Neurology, Hallym University Sacred Heart Hospital,
Hallym University College of Medicine,
22 Gwanpyeong-ro 170beon-gil, Dongan-gu, Anyang 431-796, Korea
Tel +82-31-380-3741 Fax +82-31-386-4659 E-mail [email protected]
Background and PurposezzChronic kidney disease (CKD) is an established risk factor for numerous cardiovascular diseases including stroke. The relationship between the baseline esti- mated glomerular filtration rate (eGFR) and clinical 3-month outcomes in patients with acute ischemic stroke were evaluated in this study.
MethodszzThis was a prospective cohort study involving a hospital-based stroke registry;
1373 patients with acute ischemic stroke were enrolled. Patients were divided into the follow- ing four groups according their eGFR (calculated using the CKD Epidemiology Collaboration equations): ≥60, 45–59, 30–44, and <30 mL/min/1.73 m2. The primary endpoint of poor func- tional outcome was defined as 3-month death or dependency (modified Rankin Scale score
≥3); secondary endpoints were neurological deterioration (increase in National Institutes of Health Stroke Severity score of ≥4 at discharge compared to baseline) during hospitalization and in-hospital mortality.
ResultszzThe overall eGFR was 84.5±20.8 mL/min/1.73 m2 (mean±SD). The distribution of baseline renal impairment was as follows: 1,218, 82, 40, and 33 patients had eGFRs of ≥60, 45–59, 30–44, and <30 mL/min/1.73 m2, respectively. At 3 months after the stroke, 476 (34.7%) patients exhibited poor functional outcome. Furthermore, a poor functional outcome occurred more frequently with increasingly advanced stages of CKD (rates of 31.9%, 53.7%, 55.0%, and 63.6% for CKD stages 1/2, 3a, 3b, and 4/5, respectively; p<0.001). Multivariate analysis re- vealed that a baseline eGFR of <30 mL/min/1.73m2 increased the risk of a poor functional out- come by 2.37-fold (p=0.047). In addition, baseline renal dysfunction was closely associated with neurological deterioration during hospitalization and with in-hospital mortality.
ConclusionszzA low baseline eGFR was strongly predictive of both poor functional outcome at 3 months after ischemic stroke and neurological deterioration/mortality during hospitaliza-
tion. J Clin Neurol 2015;11(1):73-79
Key Wordszz chronic kidney disease, functional outcome, mortality, stroke.
Open Access
cc This is an Open Access article distributed under the terms of the Cre- ative Commons Attribution Non-Commercial License (http://creative- commons.org/licenses/by-nc/3.0) which permits unrestricted non-com- mercial use, distribution, and reproduction in any medium, provided the ori- ginal work is properly cited.
Introduction
Decreased renal function is an independent risk factor for all- cause and cardiovascular mortality in the general population,1 as well as in various populations with comorbidities2,3 Most
patients with chronic kidney disease (CKD) are particularly vulnerable to multisystem organ dysfunction. In particular, the adequate management of acute stroke patients with CKD may be disrupted by difficulties associated with fluid management, drug prescription, electrolyte disturbance, and increased sus- ceptibility to cardiovascular events and infection. The com- bination of these factors may increase the risk of poor stroke outcomes in this population. However, the impact of low esti- mated glomerular filtration rate (eGFR) on the clinical out- comes of acute ischemic stroke remains controversial.4-7 A re-
cent Chinese study found that a decreased eGFR is closely linked to all-cause mortality and functional disabilities.8 Other data suggest that only proteinuria–and not a reduced eGFR–
is associated with adverse outcomes after ischemic stroke.9-11 In observational studies of the effect of renal dysfunction on stroke outcome, decreased renal function has usually been de- fined as an eGFR of <60 mL/min/1.73 m2 (i.e., CKD stage 3 or higher).6,10-13 However, whether stroke outcome is affected by the stage of CKD has not been well delineated. In fact, even in patients with renal dysfunction, the risk of an adverse outcome is quite markedly elevated when the eGFR falls be- low 45 mL/min/1.73 m2. For this reason, the Kidney Disease Improving Global Outcomes (KDIGO) Clinical Practice Guide- line divided CKD stage 3 (eGFR=30–59 mL/min/1.73 m2) into stages 3a (eGFR=45–59 mL/min/1.73 m2) and 3b (eGFR=
30–44 mL/min/1.73 m2).14 Moreover, the number of patients with advanced stages of renal dysfunction is increasing due to the aging population and the increase in CKD risk factors such as diabetes, hypertension, and obesity.
This study used the data from a hospital-based stroke regis- try to evaluate the effect of baseline eGFR on clinical outcomes at 3 months after acute ischemic stroke. In addition, the impact of CKD on neurological deterioration and mortality during hospitalization was determined.
Methods
Study population
This prospective study included 1,507 patients with acute ischemic stroke who were consecutively admitted to Hallym University Sacred Heart Hospital between July 2007 and July 2012. The inclusion criterion was patients with an acute isch- emic stroke within 7 days after symptom onset. The presence of stroke was confirmed in all patients by a computed tomog- raphy scan and/or magnetic resonance imaging. Among the initially enrolled 1,507 patients, 134 were excluded for the fol- lowing reasons: incomplete data at baseline (n=54), a pread- mission modified Rankin Scale (mRS) score of >2 (n=76), and undergoing dialysis (n=4). Consequently, data from 1,373 pa- tients were analyzed. This study was approved by the Institu- tional Review Board/Ethical Committee. Written informed consent to participate was obtained from each subject after re- ceiving a full explanation of the purpose and nature of the study.
Data collection
The baseline assessment comprised collecting demographic data and assessing risk factors, stroke severity, and stroke sub- type. The following risk factors were included: hypertension (blood pressure ≥140/90 mm Hg, or antihypertensive treat-
ment), diabetes (fasting glucose ≥126 mg/dL, random glucose
≥200 mg/dL, or treatment with insulin or oral hypoglycemic medications), dyslipidemia (serum total cholesterol ≥240 mg/
dL, low-density lipoprotein cholesterol ≥160 mg/dL, or use of a lipid-lowering agent), atrial fibrillation (Afib; confirmed by past electrocardiogram or detected during hospitalization), ischemic heart disease (myocardial infarction and unstable an- gina), clear history of stroke (symptoms with corresponding brain lesion confirmed by imaging), and smoking. Automated urinalysis was performed to detect proteinuria, and the results were scored as (-), (±), 1+, 2+, 3+, or 4+, whereby proteinuria was defined as 1+ or greater. However, quantification of pro- teinuria (e.g., urine protein-to-creatinine ratio or albumin-to- creatinine ratio) was not performed in this registry.
Stroke severity was assessed using the National Institutes of Health Stroke Scale (NIHSS) at admission and discharge.
However, the NIHSS score at discharge was missing in 39 pa- tients. Ischemic stroke subtypes were classified as large-artery atherosclerosis, small-vessel occlusion, cardiac embolism, stroke of other determined causes, or stroke of undetermined etiology, according to the Trial of Org 10172 in Acute Stroke Treatment classification. The use of intravenous tissue plas- minogen activator (tPA) was also recorded. Functional disabil- ity was assessed using the mRS scores at admission, discharge, and 3 months after the stroke onset.
Serum creatinine levels were measured on admission and then checked repeatedly during hospitalization. The eGFR, cal- culated using CKD Epidemiology Collaboration equations, was used to assess baseline renal function. In accordance with the 2012 KDIGO Clinical Practice Guidelines, patients were clas- sified into the following four groups based on their eGFR:
≥60 mL/min/1.73 m2, CKD stage 1 or 2; 45–59 mL/min/1.73 m2, CKD stage 3a; 30–44 mL/min/1.73 m2, CKD stage 3b; and
<30 mL/min/1.73 m2, CKD stage 4 or 5.
Follow-up and endpoints
Three-month outcomes were assessed by interviewing the pa- tients or their caregivers either in person or by telephone. The primary endpoint (i.e., poor functional outcome) was defined as 3-month death or dependency (mRS score ≥3), while the secondary endpoints were neurological deterioration during hospitalization or in-hospital mortality. Neurological deterio- ration was defined as an increase in NIHSS score of ≥4 points between admission and discharge.
Statistical analysis
The Kolmogorov-Smirnov test was used to analyze the nor- mality of the distribution of the parameters. Variables with normal distributions are expressed as mean±SD values. The statistical significance of observations was assessed using Stu-
dent’s t-test or one-way ANOVA. Nonparametric variables are expressed as median and interquartile range (IQR) values and were compared using the Mann-Whitney or Kruskal-Wallis test. Categorical variables are expressed as percentages and were compared using the chi-square test.
Event-free survival rates after a 3-month follow-up in the four baseline eGFR groups were derived using the Kaplan- Meier method. Intergroup differences in risk were assessed
using the log-rank test. Patients with an eGFR of ≥60 mL/
min/1.73 m2 served as the reference group. Independent fac- tors that were significant related to a poor functional outcome were identified using a multivariate model, with adjustments being made for variables with p<0.05 in univariate analysis.
The threshold for statistical significance was set at p<0.05, and all statistical analyses were performed using SPSS (version 18.0, SPSS Inc., Chicago, IL, USA).
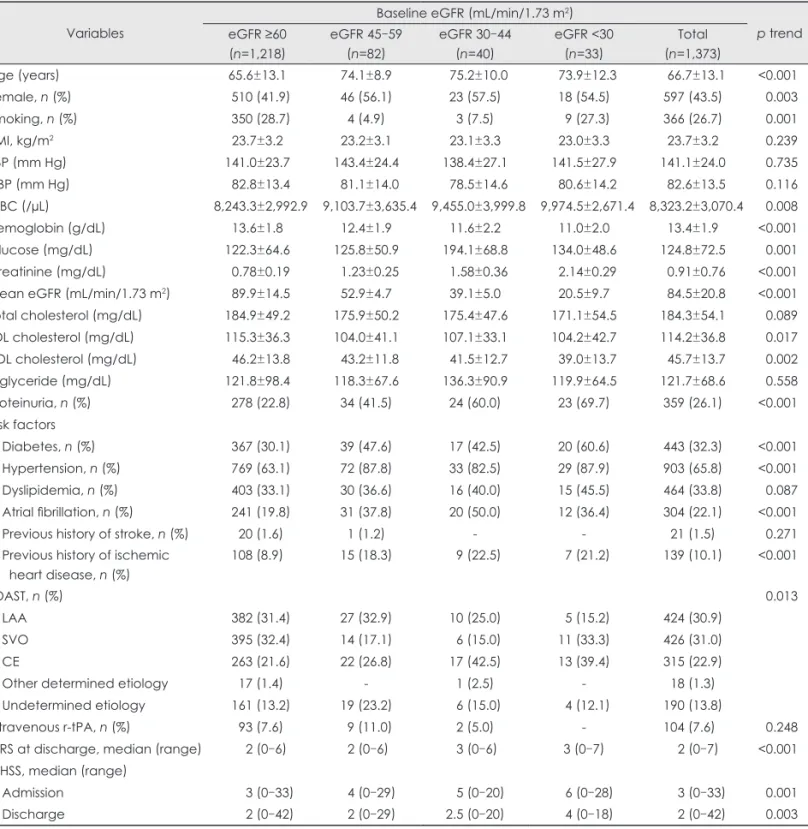
Table 1. Difference of clinical characteristics according to baseline renal function
Variables
Baseline eGFR (mL/min/1.73 m2)
p trend eGFR ≥60
(n=1,218)
eGFR 45–59 (n=82)
eGFR 30–44 (n=40)
eGFR <30 (n=33)
Total (n=1,373)
Age (years) 65.6±13.1 74.1±8.9 75.2±10.0 73.9±12.3 66.7±13.1 <0.001
Female, n (%) 510 (41.9) 46 (56.1) 23 (57.5) 18 (54.5) 597 (43.5) 0.003
Smoking, n (%) 350 (28.7) 4 (4.9) 3 (7.5) 9 (27.3) 366 (26.7) 0.001
BMI, kg/m2 23.7±3.2 23.2±3.1 23.1±3.3 23.0±3.3 23.7±3.2 0.239
SBP (mm Hg) 141.0±23.7 143.4±24.4 138.4±27.1 141.5±27.9 141.1±24.0 0.735
DBP (mm Hg) 82.8±13.4 81.1±14.0 78.5±14.6 80.6±14.2 82.6±13.5 0.116
WBC (/µL) 8,243.3±2,992.9 9,103.7±3,635.4 9,455.0±3,999.8 9,974.5±2,671.4 8,323.2±3,070.4 0.008
Hemoglobin (g/dL) 13.6±1.8 12.4±1.9 11.6±2.2 11.0±2.0 13.4±1.9 <0.001
Glucose (mg/dL) 122.3±64.6 125.8±50.9 194.1±68.8 134.0±48.6 124.8±72.5 0.001
Creatinine (mg/dL) 0.78±0.19 1.23±0.25 1.58±0.36 2.14±0.29 0.91±0.76 <0.001 Mean eGFR (mL/min/1.73 m2) 89.9±14.5 52.9±4.7 39.1±5.0 20.5±9.7 84.5±20.8 <0.001
Total cholesterol (mg/dL) 184.9±49.2 175.9±50.2 175.4±47.6 171.1±54.5 184.3±54.1 0.089
LDL cholesterol (mg/dL) 115.3±36.3 104.0±41.1 107.1±33.1 104.2±42.7 114.2±36.8 0.017
HDL cholesterol (mg/dL) 46.2±13.8 43.2±11.8 41.5±12.7 39.0±13.7 45.7±13.7 0.002
Triglyceride (mg/dL) 121.8±98.4 118.3±67.6 136.3±90.9 119.9±64.5 121.7±68.6 0.558
Proteinuria, n (%) 278 (22.8) 34 (41.5) 24 (60.0) 23 (69.7) 359 (26.1) <0.001
Risk factors
Diabetes, n (%) 367 (30.1) 39 (47.6) 17 (42.5) 20 (60.6) 443 (32.3) <0.001
Hypertension, n (%) 769 (63.1) 72 (87.8) 33 (82.5) 29 (87.9) 903 (65.8) <0.001
Dyslipidemia, n (%) 403 (33.1) 30 (36.6) 16 (40.0) 15 (45.5) 464 (33.8) 0.087
Atrial fibrillation, n (%) 241 (19.8) 31 (37.8) 20 (50.0) 12 (36.4) 304 (22.1) <0.001
Previous history of stroke, n (%) 20 (1.6) 1 (1.2) - - 21 (1.5) 0.271
Previous history of ischemic heart disease, n (%)
108 (8.9) 15 (18.3) 9 (22.5) 7 (21.2) 139 (10.1) <0.001
TOAST, n (%) 0.013
LAA 382 (31.4) 27 (32.9) 10 (25.0) 5 (15.2) 424 (30.9)
SVO 395 (32.4) 14 (17.1) 6 (15.0) 11 (33.3) 426 (31.0)
CE 263 (21.6) 22 (26.8) 17 (42.5) 13 (39.4) 315 (22.9)
Other determined etiology 17 (1.4) - 1 (2.5) - 18 (1.3)
Undetermined etiology 161 (13.2) 19 (23.2) 6 (15.0) 4 (12.1) 190 (13.8)
Intravenous r-tPA, n (%) 93 (7.6) 9 (11.0) 2 (5.0) - 104 (7.6) 0.248
mRS at discharge, median (range) 2 (0–6) 2 (0–6) 3 (0–6) 3 (0–7) 2 (0–7) <0.001 NIHSS, median (range)
Admission 3 (0–33) 4 (0–29) 5 (0–20) 6 (0–28) 3 (0–33) 0.001
Discharge 2 (0–42) 2 (0–29) 2.5 (0–20) 4 (0–18) 2 (0–42) 0.003
Exept where indicated otherwise, the data are mean±SD.
BMI: body mass index, CE: cardiac embolism, DBP: diastolic blood pressure, eGFR: estimated glomerular filtration rate, HDL: high-den- sity lipoprotein, LAA: large-artery atherosclerosis, LDL: low-density lipoprotein, mRS: modified Rankin Scale, NIHSS: National Institutes of Health Stroke Scale, r-tPA: recombinant tissue plasminogen activator, SBP: systolic blood pressure, SVO: small-vessel occlusion, TOAST:
Trial of Org 10172 in Acute Stroke Treatment, WBC: white blood cell.
Results
Baseline characteristics of patients
In total, 1,373 patients with acute ischemic stroke were ana- lyzed in this prospective cohort study. Their demographic and clinical characteristics, stroke subtypes, and severity are sum- marized in Table 1. The age of the entire cohort was 66.7±13.1 years, and 597 (43.5%) of the subjects were female. The eGFR was 84.5±20.8 mL/min/1.73 m2 (range, 10.0–152.0 mL/min/
1.73 m2). The distribution of baseline renal dysfunction was as follows: 1,218, 82, 40, and 33 patients had eGFRs of ≥60, 45–
59, 30–44, and <30 mL/min/1.73 m2, respectively. Compared to patients with an eGFR of ≥60 mL/min/1.73 m2, those with a low eGFR were older and had higher prevalence of protein- uria and several stroke risk factors such as smoking, diabetes, hypertension, and Afib.
Clinical outcomes and the prognostic value of baseline renal function
In this study, 476 (34.7%) patients had a poor functional out- come at 3 months after a stroke, and the median length of hos- pital stay was 8 days (IQR, 6–14). The primary endpoint oc- curred more frequently at more advanced stages of CKD (rates of 31.9%, 53.7%, 55.0% and 63.6% for CKD stages 1/2, 3a, 3b, and 4/5, respectively; p<0.001). The secondary end- point of neurological deterioration during hospitalization and in-hospital mortality also occurred more frequently at more advanced stages of CKD. Neurological deterioration was ob- served in 103 patients (7.7%), and the median increase in the NIHSS score was 6 (IQR, 4–8). In-hospital mortality was 3.9%
(Table 2).
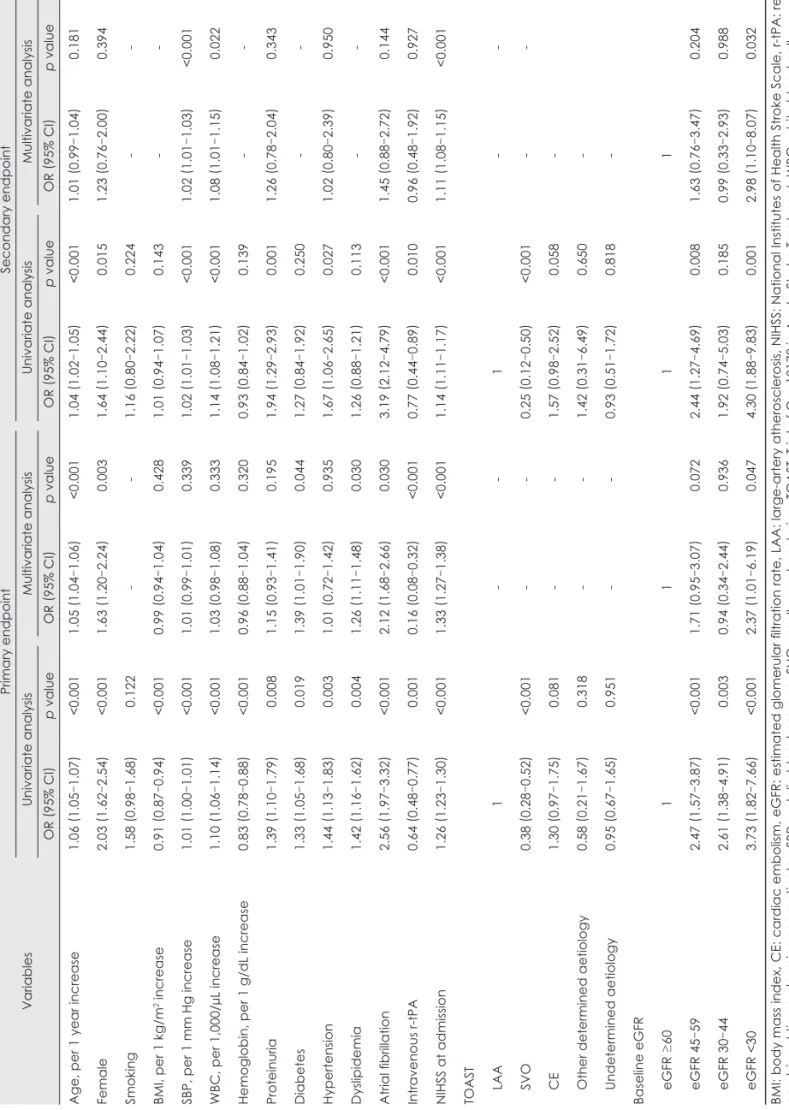
The clinical and biochemical predictors of stroke outcome are presented in Table 3. On univariate analysis, the odds ratio for the primary endpoint was 2.47 [95% confidence interval (CI), 1.57–3.87] for the eGFR=45–59 mL/min/1.73 m2 group, 2.61 (95% CI, 1.38–4.91) for the eGFR=30–44 mL/min/1.73 m2 group, and 3.73 (95% CI, 1.82–7.66) for the eGFR <30 mL/min/1.73 m2 group. On multivariate analysis, significant
predictors of the primary endpoint were being older, female gender, presence of diabetes, dyslipidemia, Afib, use of tPA, higher NIHSS score on admission, and an eGFR of <30 mL/
min/1.73 m2. In addition, increased systolic blood pressure, white blood cell count, higher baseline NIHSS score, and an eGFR of <30 mL/min/1.73 m2 were strongly predictive of neurological deterioration and mortality during hospitaliza- tion.
Discussion
Improvements in the management of acute ischemic stroke have highlighted the role of nonneurological comorbidities in determining stroke outcomes. Not surprisingly, nonneurologi- cal organ dysfunction is correlated with the severity of neuro- logical impairment, and contributes to increased risks of mor- bidity and mortality from acute stroke. The findings of this study show that a low baseline eGFR was strongly predictive of both poor functional outcome at 3 months after an acute ischemic stroke and neurological deterioration/mortality dur- ing hospitalization. In particular, we found that risks varied depending upon the degree of baseline renal dysfunction.
Severely decreased renal function (and particularly eGFR
<30 mL/min/1.73 m2) is prognostic of a poor outcome even in models adjusted for other stroke risk factors.
Decreased renal function is a well-known risk factor for all- cause and cardiovascular mortality in the general population, and in various populations with comorbidities. However, the impact of a low eGFR on stroke-related outcomes remains controversial. In a 7-year follow-up study, MacWalter et al.4 found that patients with reduced creatinine clearance and ele- vated serum creatinine and urea concentrations had a higher mortality risk. Yahalom et al.6 reported that CKD could be a strong and independent predictor of 1-year stroke mortality and poor outcome. However, Hao et al.7 found that the rela- tionship between a reduced eGFR and poor stroke outcome was only relevant in the case of hemorrhagic stroke, and not for ischemic stroke. Similarly, a recently published Chinese Table 2. Clinical outcomes of stroke according to baseline renal function
Variables
Stages of baseline renal function eGFR ≥60 p
(n=1,218)
eGFR 45–59 (n=82)
eGFR 30–44 (n=40)
eGFR <30 (n=33)
Total (n=1,373) Primary endpoint
Poor functional outcome (mRS 3–6), n (%) 389 (31.9) 44 (53.7) 22 (55.0) 21 (63.6) 476 (34.7) <0.001 Secondary endpoint
Neurological deterioration during hospitalization,* n (%)
79 (6.7) 11 (14.1) 5 (12.5) 8 (24.2) 103 (7.7) <0.001
In-hospital mortality, n (%) 39 (3.2) 6 (7.3) 4 (10.0) 4 (12.1) 53 (3.9) <0.001
*Defined as an increase in National Institutes of Health Stroke Scale score by 4 or more points at discharge compared to admission.
eGFR: estimated glomerular filtration rate, mRS: modified Rankin Scale.
Table 3. Multivariable analysis: predictors for poor clinical outcomes VariablesPrimary endpointSecondary endpoint Univariate analysisMultivariate analysisUnivariate analysisMultivariate analysis OR
(95% CI
)p valueOR
(95% CI
)p valueOR
(95% CI
)p valueOR
(95% CI
)p value Age, per 1 year increase1.06
(1.05
–1.07)<0.0011.05
(1.04
–1.06)<0.0011.04
(1.02
–1.05)<0.0011.01
(0.99
–1.04)0.181 Female2.03
(1.62
–2.54)<0.0011.63
(1.20
–2.24)0.0031.64
(1.10
–2.44)0.0151.23
(0.76
–2.00)0.394 Smoking1.58
(0.98
–1.68)0.122--1.16
(0.80
–2.22)0.224-- BMI, per 1 kg/m2 increase0.91
(0.87
–0.94)<0.0010.99
(0.94
–1.04)0.4281.01
(0.94
–1.07)0.143-- SBP, per 1 mm Hg increase1.01
(1.00
–1.01)<0.0011.01
(0.99
–1.01)0.3391.02
(1.01
–1.03)<0.0011.02
(1.01
–1.03)<0.001 WBC, per 1,000/µL increase1.10
(1.06
–1.14)<0.0011.03
(0.98
–1.08)0.3331.14
(1.08
–1.21)<0.0011.08
(1.01
–1.15)0.022 Hemoglobin, per 1 g/dL increase0.83
(0.78
–0.88)<0.0010.96
(0.88
–1.04)0.3200.93
(0.84
–1.02)0.139-- Proteinuria1.39
(1.10
–1.79)0.0081.15
(0.93
–1.41)0.1951.94
(1.29
–2.93)0.0011.26
(0.78
–2.04)0.343 Diabetes1.33
(1.05
–1.68)0.0191.39
(1.01
–1.90)0.0441.27
(0.84
–1.92)0.250-- Hypertension1.44
(1.13
–1.83)0.0031.01
(0.72
–1.42)0.9351.67
(1.06
–2.65)0.0271.02
(0.80
–2.39)0.950 Dyslipidemia1.42
(1.16
–1.62)0.0041.26
(1.11
–1.48)0.0301.26
(0.88
–1.21)0.113-- Atrial fibrillation2.56
(1.97
–3.32)<0.0012.12
(1.68
–2.66)0.0303.19
(2.12
–4.79)<0.0011.45
(0.88
–2.72)0.144 Intravenous r-tPA0.64
(0.48
–0.77)0.0010.16
(0.08
–0.32)<0.0010.77
(0.44
–0.89)0.0100.96
(0.48
–1.92)0.927 NIHSS at admission1.26
(1.23
–1.30)<0.0011.33
(1.27
–1.38)<0.0011.14
(1.11
–1.17)<0.0011.11
(1.08
–1.15)<0.001 TOAST LAA1--1-- SVO0.38
(0.28 –0.52)<0.001--0.25 (0.12
–0.50)<0.001-- CE1.30
(0.97
–1.75)0.081--1.57
(0.98
–2.52)0.058- Other determined aetiology0.58
(0.21
–1.67)0.318--1.42
(0.31
–6.49)0.650- Undetermined aetiology0.95
(0.67
–1.65)0.951--0.93
(0.51
–1.72)0.818- Baseline eGFR eGFR ≥601111 eGFR 45–592.47
(1.57
–3.87)<0.0011.71
(0.95
–3.07)0.0722.44
(1.27
–4.69)0.0081.63
(0.76
–3.47)0.204 eGFR 30–442.61
(1.38
–4.91)0.0030.94
(0.34
–2.44)0.9361.92
(0.74
–5.03)0.1850.99
(0.33
–2.93)0.988 eGFR <303.73
(1.82
–7.66)<0.0012.37
(1.01
–6.19)0.0474.30
(1.88
–9.83)0.0012.98
(1.10
–8.07)0.032 BMI: body mass index, CE: cardiac embolism, eGFR: estimated glomerular filtration rate, LAA: large-artery atherosclerosis, NIHSS: National Institutes of Health Stroke Scale, r-tPA: re- combinant tissue plasminogen activator, SBP: systolic blood pressure, SVO: small-vessel occlusion, TOAST: Trial of Org 10172 in Acute Stroke Treatment, WBC: white blood cell.
study revealed that low eGFR has no appreciable effects on death or disability.14 In the present study, lower levels of base- line eGFR were closely associated with composite events as well as functional disabilities at 3 months after ischemic stroke.
When the patients in this study were divided into four groups according to the severity of their disease based on the KDIGO guidelines (i.e., CKD stages 1/2, 3a, 3b, and 4/5), the risk of adverse events was shown to be highly dependent on the severity of renal impairment. In fact, it has been well doc- umented that the overall risk increases quite markedly when the eGFR falls below 45 mL/min/1.73 m2. Our data further demonstrate that aggravation of CKD stage is closely associ- ated with a significant increase in the risk of in-hospital mor- tality and poor functional outcomes. Univariate analysis re- vealed that patients with eGFRs of 45–59, 30–44, and <30 mL/min/1.73 m2 had 2.47-, 2.61-, and 3.73-fold higher risks of a poor outcome, respectively, compared to those with an eGFR of ≥60 mL/min/1.73 m2. When adjustments were made, the link between eGFR and stroke outcomes was significant only in patients with severely reduced renal function (i.e., eGFR
<30 mL/min/1.73 m2). We believe that this finding may ex- plain the inconsistencies in conclusions drawn in previous studies about the relationship between eGFR and stroke out- comes.
However, several conclusions that can be drawn from the unadjusted model should not be underestimated. In fact, it may be more relevant to recognize the effect of a reduced eGFR on stroke outcomes without adjustments for other risk factors, since the adjusted analysis may inappropriately under- estimate the relationship between levels of eGFR and out- comes.15,16 For example, a reduced eGFR generally results in more severe hypertension and dyslipidemia. Therefore, if in- cluded in statistical adjustments, one may overcorrect for the effects of these factors, resulting in a less definite association between decreased eGFR and outcomes. A valid interpretation of our finding may thus be that the presence of CKD, in and of itself, could be an important independent risk factor affecting cardiovascular disease outcomes. This study therefore adds to a growing body of evidence suggesting that kidney disease is an important independent risk factor for adverse stroke out- comes.
Another interesting finding of this study is that proteinuria was not a significant predictor for stroke outcome. Although the presence of proteinuria was associated with poor stroke outcomes in univariate analysis, it was not a significant factor in multivariate analysis. This finding contrast several previous reports that have emphasized the predictive importance of pro- teinuria.17 Many longitudinal studies have concluded that pro- teinuria, and even microalbuminuria, is an adverse prognostic indicator for clinical cardiovascular outcomes and all-cause
mortality.18-20 The Heart Outcomes Prevention Evaluation study found that the risk of a composite outcome of myocardi- al infarction, stroke, or cardiovascular mortality, as well as all- cause mortality was 1.97-fold higher in patients with microal- buminuria than in subjects without microalbuminuria.18 The negative finding of the present study in this regard may be at- tributable to our inability to distinguish CKD-associated pro- teinuria from acute illness-associate transient proteinuria. Pro- teinuria is a common problem in patients admitted to hospital and is caused by a wide variety of conditions, ranging from benign to lethal. In particular, the probability of transient pro- teinuria is very high in patients with an acute illness due to ischemic stroke. Repeated urinalysis is necessary to confirm the presence of persistent and pathologic proteinuria; however, urine tests were only performed once in the present cohort, and moreover, urine quantification was not performed. This situation made it impossible to identify and select patients with pathologic proteinuria associated with a low eGFR.
This study was subject to several limitations. First, it was performed in a single center and the analyzed data were har- vested from a hospital-based case series; the findings may therefore not be generalizable to the entire Korean population.
Furthermore, among the 1,373 cases analyzed in this study, the absolute number of patients with an eGFR of ≥60 mL/
min/1.73 m2 was much larger than that of patients with an eGFR of <60 mL/min/1.73 m2, which may have resulted in a low statistical power. Since this study was based on a prospec- tive hospital-based stroke registry, it was not possible to regu- late the number of patients in each category of eGFR. Large- scale prospective studies of patients with CKD (eGFR <60 mL/min/1.73 m2) are mandatory to evaluate the effect of ad- vanced-stage eGFR (<30 mL/min/1.73 m2) on clinical out- comes. Finally, since the assessment of urine protein was based on a single measurement, misclassification of urinary protein was possible.
In summary, within the limitations of this study it can be concluded that clinical outcomes after an ischemic stroke are closely associated with the baseline eGFR at the time of ad- mission. In particular, severely impaired renal function is strongly predictive of 3-month all-cause mortality and poor functional outcomes.
Conflicts of Interest
The authors have no financial conflicts of interest.
Acknowledgements
This study was partially supported by a grant from the Korea Healthcare Technology R&D Project, Ministry of Health and Welfare, Republic of Korea (grant no. HI10C2020).
REFERENCES
1. Chronic Kidney Disease Prognosis Consortium, Matsushita K, van der Velde M, Astor BC, Woodward M, Levey AS, et al. Association of es- timated glomerular filtration rate and albuminuria with all-cause and cardiovascular mortality in general population cohorts: a collaborative meta-analysis. Lancet 2010;375:2073-2081.
2. Sadeghi HM, Stone GW, Grines CL, Mehran R, Dixon SR, Lansky AJ, et al. Impact of renal insufficiency in patients undergoing primary angioplasty for acute myocardial infarction. Circulation 2003;108:
2769-2775.
3. Anavekar NS, McMurray JJ, Velazquez EJ, Solomon SD, Kober L, Rouleau JL, et al. Relation between renal dysfunction and cardiovas- cular outcomes after myocardial infarction. N Engl J Med 2004;351:
1285-1295.
4. MacWalter RS, Wong SY, Wong KY, Stewart G, Fraser CG, Fraser HW, et al. Does renal dysfunction predict mortality after acute stroke?
A 7-year follow-up study. Stroke 2002;33:1630-1635.
5. Tsagalis G, Akrivos T, Alevizaki M, Manios E, Stamatellopoulos K, Laggouranis A, et al. Renal dysfunction in acute stroke: an indepen- dent predictor of long-term all combined vascular events and overall mortality. Nephrol Dial Transplant 2009;24:194-200.
6. Yahalom G, Schwartz R, Schwammenthal Y, Merzeliak O, Toashi M, Orion D, et al. Chronic kidney disease and clinical outcome in patients with acute stroke. Stroke 2009;40:1296-1303.
7. Hao Z, Wu B, Lin S, Kong FY, Tao WD, Wang DR, et al. Association between renal function and clinical outcome in patients with acute stroke. Eur Neurol 2010;63:237-242.
8. Luo Y, Wang X, Wang Y, Wang C, Wang H, Wang D, et al. Association of glomerular filtration rate with outcomes of acute stroke in type 2 di- abetic patients: results from the china national stroke registry. Diabetes Care 2014;37:173-179.
9. Kumai Y, Kamouchi M, Hata J, Ago T, Kitayama J, Nakane H, et al.
Proteinuria and clinical outcomes after ischemic stroke. Neurology 2012;78:1909-1915.
10. Ovbiagele B, Sanossian N, Liebeskind DS, Kim D, Ali LK, Pineda S, et al. Indices of kidney dysfunction and discharge outcomes in hospi- talized stroke patients without known renal disease. Cerebrovasc Dis 2009;28:582-588.
11. Umemura T, Senda J, Fukami Y, Mashita S, Kawamura T, Sakakibara
T, et al. Impact of albuminuria on early neurological deterioration and lesion volume expansion in lenticulostriate small infarcts. Stroke 2014;
45:587-590.
12. Agrawal V, Rai B, Fellows J, McCullough PA. In-hospital outcomes with thrombolytic therapy in patients with renal dysfunction presenting with acute ischaemic stroke. Nephrol Dial Transplant 2010;25:1150- 1157.
13. Naganuma M, Koga M, Shiokawa Y, Nakagawara J, Furui E, Kimura K, et al. Reduced estimated glomerular filtration rate is associated with stroke outcome after intravenous rt-PA: the Stroke Acute Management with Urgent Risk-Factor Assessment and Improvement (SAMURAI) rt-PA registry. Cerebrovasc Dis 2011;31:123-129.
14. Levey AS, de Jong PE, Coresh J, El Nahas M, Astor BC, Matsushita K, et al. The definition, classification, and prognosis of chronic kidney disease: a KDIGO Controversies Conference report. Kidney Int 2011;
80:17-28.
15. Yang J, Arima H, Zhou J, Zhao Y, Li Q, Wu G, et al. Effects of low es- timated glomerular filtration rate on outcomes after stroke: a hospital- based stroke registry in China. Eur J Neurol 2014;21:1143-1145.
16. Sarnak MJ, Levey AS, Schoolwerth AC, Coresh J, Culleton B, Hamm LL, et al. Kidney disease as a risk factor for development of cardiovas- cular disease: a statement from the American Heart Association Coun- cils on Kidney in Cardiovascular Disease, High Blood Pressure Re- search, Clinical Cardiology, and Epidemiology and Prevention.
Circulation 2003;108:2154-2169.
17. Chen CH, Tang SC, Tsai LK, Yeh SJ, Chen KH, Li CH, et al. Protein- uria independently predicts unfavorable outcome of ischemic stroke patients receiving intravenous thrombolysis. PLoS One 2013;8:e80527.
18. Gerstein HC, Mann JF, Yi Q, Zinman B, Dinneen SF, Hoogwerf B, et al. Albuminuria and risk of cardiovascular events, death, and heart fail- ure in diabetic and nondiabetic individuals. JAMA 2001;286:421-426.
19. Stephenson JM, Kenny S, Stevens LK, Fuller JH, Lee E. Proteinuria and mortality in diabetes: the WHO Multinational Study of Vascular Disease in Diabetes. Diabet Med 1995;12:149-155.
20. Agewall S, Wikstrand J, Ljungman S, Fagerberg B. Usefulness of mi- croalbuminuria in predicting cardiovascular mortality in treated hyper- tensive men with and without diabetes mellitus. Risk Factor Interven- tion Study Group. Am J Cardiol 1997;80:164-169.