INTRODUCTION
Aplastic anemia (AA) is a potentially severe bone marrow (BM) disorder characterized by peripheral pancytopenia and BM that is largely devoid of hematopoietic cells and is re- placed by fatty tissue, while retaining the basic marrow archi- tecture or stroma (1). The treatment of choice for severe AA (SAA) in patients under the age of 40 yr is bone marrow trans- plantation (BMT), whereas patients with moderate AA, pa- tients with SAA who lack a compatible donor, and those over the age of 40 yr are treated with immunosuppressive agents (1, 2).
Magnetic resonance (MR) imaging is a noninvasive and relatively rapid method of BM study because of its exclusive ability to directly show a large volume of BM (3-5). MR imaging of BM in AA has been widely reported, but prog- nostic implication of MR imaging according to the treat- ment methods used has been only reported in a few series (6-9). The aim of this study was to investigate the features of MR imaging of BM for monitoring the therapeutic effects of BMT or immunosuppressive therapy in patients with SAA.
MATERIALS AND METHODS
MR imaging of BM was retrospectively reviewed in 16 patients (13 males and 3 females) who had attained complete clinical responses following allogeneic BMT or immuno- suppressive therapy with antilymphocyte globulin (ALG) and cyclosporine A. Response was defined as reaching com- plete independence of transfusions. The mean age of the pa- tients was 26 (range, 15-38) yr. Eight patients were treated with BMT and the others with ALG and cyclosporine A. The interval between MR examination of BM and treatment was about 33 (21 in BMT group and 59 in ALG group) weeks.
In two of eight patients with BMT and six of eight patients with immunosuppressive therapy, MR imaging of BM was performed prior to treatment.
MR imaging of BM was performed with a 0.5T (Gyroscan T5, Phillips, Eindhoven, Netherlands) or a 1.5T (Magnetom plus, Siemens, Erlangen, Germany) superconductive MR unit. Sagittal T1-weighted images (T1WI, TR/TE=560/30 msec at 0.5T or 500/12 msec at 1.5T) and short tau inver- sion recovery (STIR, TR/TE/TI=1,400/30/120 msec at 0.5T or 3,600/30/150 msec at 1.5T) images of the lumbar spine were obtained. Image factors were 5-mm slice thickness with
Jeong Mi Park, Hye Ahn Jung, Dong Wook Kim*, Jong Wook Lee*, Chun Choo Kim*, Seong Tae Hahn
Department of Radiology, Department of Internal Medicine*, St. Mary’s Hospital, College of Medicine, The Catholic University of Korea, Seoul, Korea
Address for correspondence Jeong Mi Park, M.D.
Department of Radiology, St. Mary’s Hospital College of Medicine, The Catholic University of Korea, 62 Youido-dong, Yongdungpo-gu, Seoul 150-713, Korea
Tel : +82.2-3779-2037, Fax : +82.2-783-5288 E-mail : [email protected]
725
Magnetic Resonance Imaging of the Bone Marrow After Bone Marrow Transplantation or Immunosuppressive Therapy in Aplastic Anemia
To compare magnetic resonance (MR) images of the bone marrow (BM) after bone marrow transplantation or immunosuppressive therapy in patients with aplas- tic anemia (AA), MR imaging of BM was reviewed retrospectively in 16 patients (13 males and 3 females, mean age 26 yr) with AA who completely responded clinically after transplantation or immunosuppressive therapy. The signal intensity (SI) of BM was classified into four patterns according to the increasing amount of cellular marrow, i.e., pattern I to IV. SI of MR imaging of BM exhibited an in- crease of cellular marrows following both transplantation and immunosuppres- sive therapy. Of the eight patients on transplantation, the SI of the lumbar spinal BM was pattern III in two patients and IV in six on T1-weighted and short tau inversion recovery (STIR) images. In the eight patients with immunosuppressive therapy, the SI of the lumbar spinal BM was pattern II in one, III in five, and IV in two on T1-weighted images and pattern II in one, III in four, and IV in three on STIR images. SI on MR imaging of the lumbar spinal BM showed a more cellu- lar pattern in patients on transplantation than in those on immunosuppressive therapy.
Key Words : Anemia, Aplastic; Bone Marrow; Bone Marrow Transplantation; Immunotherapy; Magnet- ic Resonance Imaging
Received : 16 March 2001 Accepted : 13 July 2001
726 J.M. Park, H.A. Jung, D.W. Kim, et al.
a 0.5-mm intersection gap, 205×256 matrix, four signal acquisitions, and 350-mm field of view on all pulse sequences.
Coronal T1WI of the pelvis (TR/TE=560/30 msec at 0.5T or 750/12 msec at 1.5T) with 6-mm slice thickness and 0.6- mm intersection gap were also obtained.
MR images were interpreted by two radiologists who reached a consensus. The signal intensity (SI) of BM from the first to fifth lumbar bodies and the pelvic bone on both T1WI and STIR images was summated visually and classi- fied into four types according to the increasing amount of cellular marrow. On T1WI, diffusely homogeneous, high SI was classified as pattern I, hyperintense background with less than 25% of low SI nodules as pattern II, extensive mixed high and low SI with a half or more area of high SI as pat- tern III, and diffuse low SI with scattered high SI nodules of less than 25% as pattern IV. On STIR with reversed SI, pat- tern I was defined as diffusely homogeneous low SI, pattern II hypointense background with less than 25% of high SI nodules, pattern III mixed patchy high and low SI with a half or less area of high SI, and pattern IV diffusely high SI with less than 25% of low SI area.
According to SI patterns seen on T1WI and STIR images, BM was categorized as follows: I, homogeneous fatty pat- tern; II, focal cellular pattern; III, mixed fatty and cellular pattern; and IV, cellular pattern with focal fatty nodules. On T1WI, low signal was equal to or less than the signal of par- avertebral muscle, and high signal was equal to the signal of subcutaneous fat. On STIR images with fat suppression, mar- row SI was rated as high or low in relation to the signal of
paravertebral muscle.
These SI patterns of MR imaging of lumbar spinal & pelvic BM were analyzed in patients with SAA following BMT or immunosuppressive therapy.
RESULTS
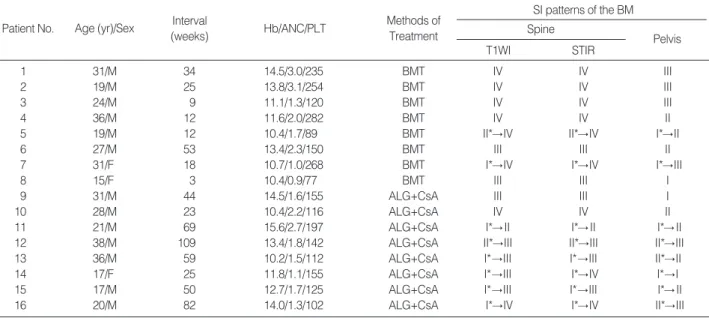
The clinical features and SI patterns of MR imaging of BM in 16 patients with SAA after BMT or immunosuppressive therapy are summarized in Table 1.
In eight patients who underwent MR imaging of BM before BMT or immunosuppressive therapy, SI pattern of spinal BM changed to represent higher cellularities (from patterns I and II to patterns III and IV). Likewise, the SI pattern of the pelvic BM changed from patterns I and II to patterns II and III.
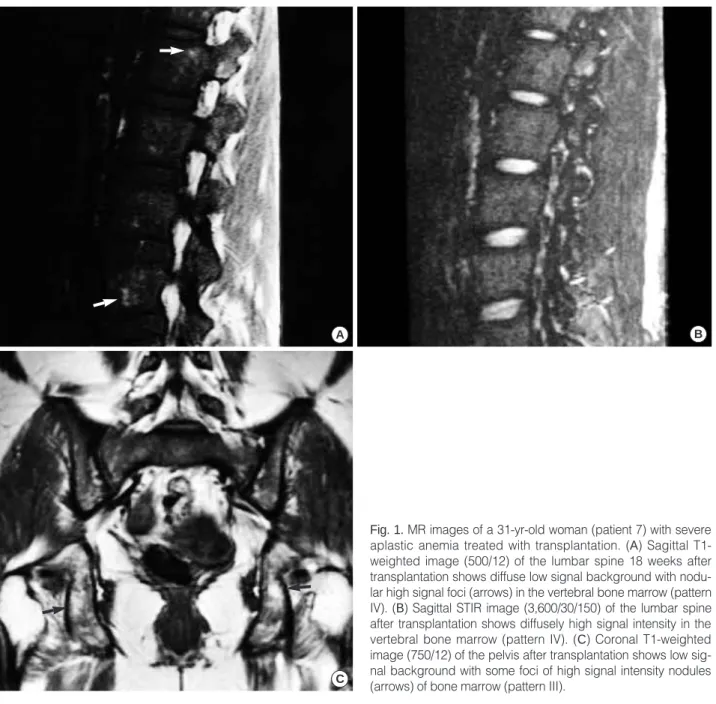
The SI patterns of MR imaging of the lumbar spinal BM after treatment were different depending on the modalities although complete responses were attained in both BMT and immunosuppressive therapy groups. Of the eight patients on BMT, SI of the lumbar spinal BM was pattern III in two patients and IV in six on TIWI and STIR images (Fig. 1).
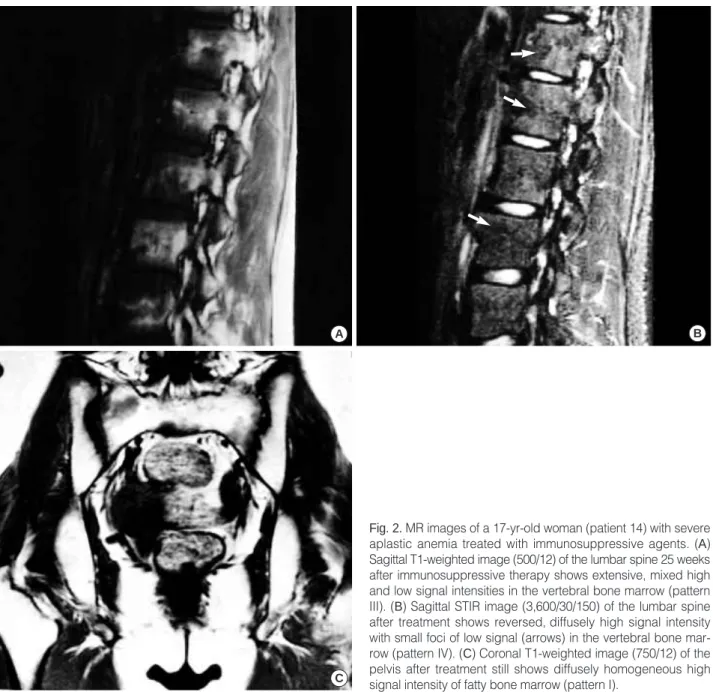
Of the eight patients on immunosuppressive therapy, SI of lumbar vertebral BM was pattern II in one patient, III in five, and IV in two on T1WI and II in one, III in four, and IV in three patients on STIR images (Fig. 2). The SI pattern of MR imaging of the lumbar spinal BM after BMT was more cellular, with small fatty portions, than that after immuno-
Patient No. Age (yr)/Sex Interval
(weeks) Hb/ANC/PLT Methods of
Treatment
T1WI STIR
Pelvis Spine
SI patterns of the BM
1 31/M 34 14.5/3.0/235 BMT IV IV III
2 19/M 25 13.8/3.1/254 BMT IV IV III
3 24/M 9 11.1/1.3/120 BMT IV IV III
4 36/M 12 11.6/2.0/282 BMT IV IV II
5 19/M 12 10.4/1.7/89 BMT II*→IV II*→IV I*→II
6 27/M 53 13.4/2.3/150 BMT III III II
7 31/F 18 10.7/1.0/268 BMT I*→IV I*→IV I*→III
8 15/F 3 10.4/0.9/77 BMT III III I
9 31/M 44 14.5/1.6/155 ALG+CsA III III I
10 28/M 23 10.4/2.2/116 ALG+CsA IV IV II
11 21/M 69 15.6/2.7/197 ALG+CsA I*→II I*→II I*→II
12 38/M 109 13.4/1.8/142 ALG+CsA II*→III II*→III II*→III
13 36/M 59 10.2/1.5/112 ALG+CsA I*→III I*→III II*→II
14 17/F 25 11.8/1.1/155 ALG+CsA I*→III I*→IV I*→I
15 17/M 50 12.7/1.7/125 ALG+CsA I*→III I*→III I*→II
16 20/M 82 14.0/1.3/102 ALG+CsA I*→IV I*→IV II*→III
Table 1. Clinical features and signal intensity patterns on magnetic resonance imaging of the bone marrow after bone marrow trans- plantation or immunosuppressive therapy in patients with aplastic anemia
Note-SI: signal intensity, BMT: bone marrow transplantation, T1WI: T1-weighted images, STIR: short tau inversion recovery images, Hb: hemoglobin, g/dL, ANC: absolute neutrophil count, 1×10⁹/L, PLT: platelet, 1×10⁹/L, ALG: antilymphocyte globulin, CsA: cyclosporine A, Interval: weeks from treat- ment to MR imaging. *: patterns of MR imaging of the BM before BMT or immunosuppressive therapy. I: Homogeneous fatty marrow. II: Fatty marrow with focal cellular nodules. III: Mixed fatty and cellular marrow. IV: Cellular marrow with focal fatty nodules.
suppressive therapy.
The lumbar spinal and pelvic BM after treatment showed different SI patterns: patterns III and IV were much more frequently seen in lumbar spinal BM (15 of 16 patients), whereas patterns I and II were common in pelvic BM (10 of 16 patients) on T1WI. The SI pattern on MR imaging of the pelvic BM after BMT or immunosuppressive therapy represented more fat than that of the spinal BM.
DISCUSSION
The application of MR techniques has become an impor- tant imaging modality for diagnostic and follow-up after
treatment of various hematologic diseases (3-5, 10). MR im- aging is complementary to BM biopsy in that although MR shows only the gross anatomy of the marrow, it can sample a large fraction of active marrow in a single, noninvasive clini- cal study.
In AA, findings of MR imaging and their roles in moni- toring patients have been reported (6-9, 11-13). In untreated stages, marrows demonstrate a diffuse, high SI, reflecting preponderance of fatty marrow and lack of hematopoietic marrow. After treatment, foci of low signal intensity, repre- senting islands of hematopoietically active tissue, appear in the yellow marrow. BMT is a well-established treatment of choice for patients with SAA who have HLA-matched donors.
The use of ALG alone or together with cyclosporine A is also
C
A B
Fig. 1.MR images of a 31-yr-old woman (patient 7) with severe aplastic anemia treated with transplantation. (A) Sagittal T1- weighted image (500/12) of the lumbar spine 18 weeks after transplantation shows diffuse low signal background with nodu- lar high signal foci (arrows) in the vertebral bone marrow (pattern IV). (B) Sagittal STIR image (3,600/30/150) of the lumbar spine after transplantation shows diffusely high signal intensity in the vertebral bone marrow (pattern IV). (C) Coronal T1-weighted image (750/12) of the pelvis after transplantation shows low sig- nal background with some foci of high signal intensity nodules (arrows) of bone marrow (pattern III).
728 J.M. Park, H.A. Jung, D.W. Kim, et al.
accepted as an effective form of treatment for patients with SAA who lack HLA-matched donors and who are over 40 yr of age.
In normal adults, the distribution of hematopoietic and fatty marrow relative to age has been extensively described (14-16). Since the hematopoietic marrow remains through- out life in the lumbar spine, the pelvis, and the intertroch- anteric area of the femur, these areas were assessed in our study.
The SI of MR images correlates with the density and the relaxation behavior of the protons in tissues. There are two considerable fractions of protons in normal red marrow, i.e., water and lipids. The separation and quantification of these protons within red marrow are important issues of MR imag-
ing of BM. BMT or immunosuppressive therapy in patients with AA results in an increasing fraction of water within BM by the regeneration of hematopoietic cells (8, 9). Our protocol included sagittal T1WI and STIR imaging of the lumbar spine and coronal T1WI of the pelvis. The short T1 relaxation time (higher SI) of the fatty marrow allows non- invasive assessment of the amount and distribution of the tissue by T1WI. STIR images characterize the yellow mar- row as SI being nullified and therefore appearing black. The T1 and T2 contrast of tissues other than fat is additive, and contrast sensitivity is thus greatly enhanced (3, 17, 18). Be- cause the fat signal is highlighted on T1WI, whereas the cellular portion is emphasized on STIR images, one (patient No. 14) of our patients was classified as pattern III on T1WI
C
A B
Fig. 2.MR images of a 17-yr-old woman (patient 14) with severe aplastic anemia treated with immunosuppressive agents. (A) Sagittal T1-weighted image (500/12) of the lumbar spine 25 weeks after immunosuppressive therapy shows extensive, mixed high and low signal intensities in the vertebral bone marrow (pattern III). (B) Sagittal STIR image (3,600/30/150) of the lumbar spine after treatment shows reversed, diffusely high signal intensity with small foci of low signal (arrows) in the vertebral bone mar- row (pattern IV). (C) Coronal T1-weighted image (750/12) of the pelvis after treatment still shows diffusely homogeneous high signal intensity of fatty bone marrow (pattern I).
but as IV on STIR images.
Our results showed that the patients on BMT had SI of more cellular pattern than the patients on immunosuppres- sive therapy, despite the complete responses in both groups.
However, two (No.10 and 15) of the eight patients on im- munosuppressive therapy recurred with pancytopenia 1 yr later. None of the eight patients on BMT experienced a relapse of the disease during the mean three (one to six) years of aver- age period of follow-up.
It is not well known where the initial BM recovery takes place following BMT or immunosuppressive therapy. Our results showed that SI on MR imaging of the lumbar spinal BM after therapy appeared to have a more cellular pattern than that of the pelvic BM, suggesting the earlier hemato- poietic recovery in the lumbar spinal marrow cavity.
There were several limitations in our study. Firstly, initial MR imaging was available in only two cases on BMT and six on ALG therapy. Therefore, changing patterns of SI on MR imaging with the treatment could not be clearly evalu- ated in all patients. Secondly, the SI pattern of BM was eval- uated visually, not quantitated. Lastly, all the patients stud- ied were complete responders and patients in whom BMT or immunosuppressive therapy had failed or just induced par- tial responses were not included, suggesting a selection bias.
In conclusion, MR imaging of BM showed slight differ- ences in its SI patterns, depending on the treatment modal- ities applied. The lumbar spinal BM showed a more cellular pattern in patients treated with BMT than in those treated
with immunosuppressive agents. Recovery of BM cellulari- ty in the lumbar spinal BM preceded that of the pelvic BM.
ACKNOWLEDGMENT
We thank Bonnie Hammi at Department of Radiology in University Hospitals of Cleveland, Cleveland, OH, for her editorial assistance in the preparation of the manuscript.
REFERENCES
1. Young NS. Aplastic anemia and related bone marrow failure syn- drome. In: Bennet and Plum: Cecil Textbook of Medicine 20th ed.
Vol.1 Philadelphia: W B Saunders Company 1996: 831-6.
2. Doney K, Leisenring W, Storb R, Appelbaum FR. Primary treatment of acquired aplastic anemia: outcomes with bone marrow transplan- tation and immunosuppressive therapy. Seattle bone marrow trans- plant team. Ann Intern Med 1997; 126: 107-15.
3. Vogler JB III, Murphy WA. Bone marrow imaging. Radiology 1988;
168: 679-93.
4. Steiner RM, Mitchell DG, Rao VM, Schweitzer ME. Magnetic res- onance imaging of diffuse bone marrow disease. Radiol Clin North Am 1993; 31: 383-409.
5. Moulopoulos LA, Dimopoulos MA. Magnetic resonance imaging of the bone marrow in hematologic malignancies. Blood 1997; 90:
2127-47.
A B
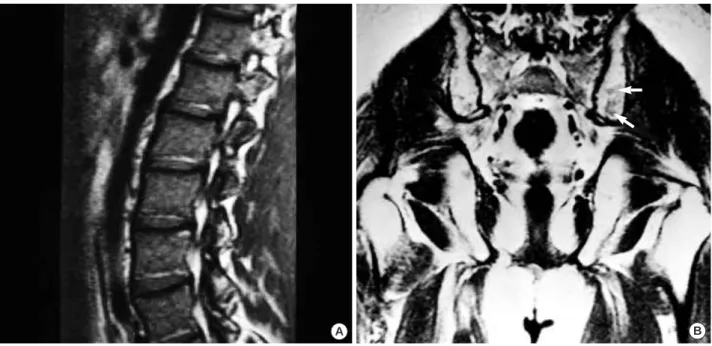
Fig. 3.MR images of a 19-yr-old man (patient 5) patient with severe aplastic anemia with bone marrow transplantation. (A) Sagittal T1- weighted MR image (560/30) of the lumbar spine 12 weeks after transplantation reveals homogeneous low signal intensity in the ver- tebral bone marrow (pattern IV). (B) Coronal T1-weighted MR image (525/25) of the pelvis after transplantation shows a hyperintense background with faint low signal intensity nodules (arrows) of the bone marrow (pattern II), compared to the signal intensity of the spinal bone marrow on figure A, indicating a delay in the recovery of pelvic bone marrow.
730 J.M. Park, H.A. Jung, D.W. Kim, et al.
6. Olson DO, Shields AF, Scheurich CJ, Porter BA, Moss AA. Magnet- ic resonance imaging of the bone marrow in patients with leukemia, aplastic anemia, and lymphoma. Invest Radiol 1986; 21: 540-6.
7. Kaplan PA, Asleson RJ, Klassen LW, Duggan MJ. Bone marrow patterns in aplastic anemia: observations with 1.5-T MR imaging.
Radiology 1987; 164: 441-4.
8. Yagisawa M, Iki S, Mitani K, Ohbayashi Y, Sato H, Urabe A.
Changes in bone marrow MRI patterns in aplastic anemia before and after successful treatment with ATG. Rinsho Ketsueki 1992; 33:
811-6.
9. Masumoto A, Yonekura S, Ogawa Y, Fukuda R, Fujiwara H, Watan- abe S, Satoh H, Kawada H, Umeda Y, Mishima K. Changes of bone marrow MRI pattern in aplastic anemia before and after bone mar- row transplantation. Rinsho Ketsueki 1993; 34: 1494-6.
10. Altehoefer C, Laubenberger J, Lange W, Kraus A, Allmann KH, Uhrmeister P, Langer M. Prospective evaluation of bone marrow signal changes on magnetic resonance tomography during high dose chemotherapy and peripheral blood stem cell transplantation in patients with breast cancer. Invest Radiol 1997; 32: 613-20.
11. Mckinstry CS, Steiner RE, Young AT, Jones L, Swirsky D, Aber V. Bone marrow in leukemia and aplastic anemia: MR imaging before, during, and after treatment. Radiology 1987; 162: 701-7.
12. Negendank W, Weissman D, Bey TM, de Planque MM, Karanes C, Smith MR, Ratanatharathorn V, Bishop CR, al-Katib AM, Sensen-
brenner LL. Evidence for clonal disease by magnetic resonance im- aging in patients with hypoplastic marrow disorders. Blood 1991;
78: 2872-9.
13. Amano Y, Kumazaki T. Proton MR imaging and spectroscopy eval- uation of aplastic anemia: three bone marrow patterns. J Comput Assist Tomogr 1997; 21: 286-92.
14. Dooms GC, Fisher MR, Hricak H, Richardson M, Crooks LE, Genant HK. Bone marrow imaging: magnetic resonance studies related to age and sex. Radiology 1985; 155: 429-32.
15. Ricci C, Cova M, Kang YS, Yang A, Rahmouni A, Scott WW Jr, Zerhouni EA. Normal age-related patterns of cellular and fatty bone marrow distribution in the axial skeleton: MR imaging study. Radi- ology 1990; 177: 83-8.
16. Moore SG, Dawson KL. Red and yellow marrow in the femur: age related changes in appearance at MR imaging. Radiology 1990;
175: 219-23.
17. Jones KM, Unger EC, Granstrom P, Seeger JF, Carmody RF, Yoshino M. Bone marrow imaging using STIR at 0.5 and 1.5T. Magn Reson Imaging 1992; 10: 169-76.
18. Mirowitz SA, Apicella P, Reinus WR, Hammerman AM. MR imag- ing of bone marrow lesions: relative conspicuousness on T1-weight- ed, fat-suppressed T2-weighted and STIR images. Am J Roentgenol 1994; 162: 215-21.