Development of Standard Digital Images for Pneumoconiosis
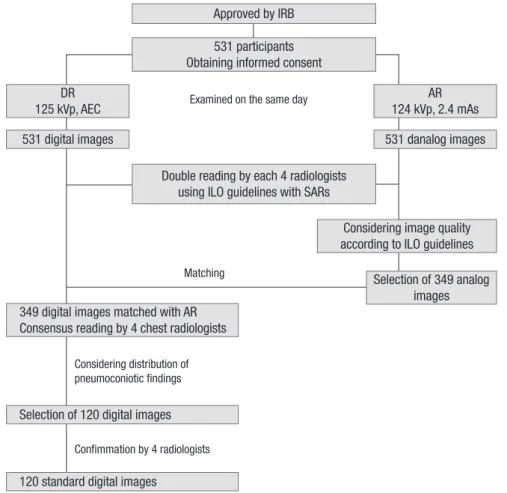
We developed the standard digital images (SDIs) to be used in the classification and recognition of pneumoconiosis. From July 3, 2006 through August 31, 2007, 531 retired male workers exposed to inorganic dust were examined by digital (DR) and analog radiography (AR) on the same day, after being approved by our institutional review board and obtaining informed consent from all participants. All images were twice classified according to the International Labour Office (ILO) 2000 guidelines with reference to ILO standard analog radiographs (SARs) by four chest radiologists. After consensus reading on 349 digital images matched with the first selected analog images, 120 digital images were selected as the SDIs that considered the distribution of pneumoconiosis findings. Images with profusion category 0/1, 1, 2, and 3 were 12, 50, 40, and 15, respectively, and a large opacity were in 43 images (A = 20, B = 22, C = 1). Among pleural abnormality,
costophrenic angle obliteration, pleural plaque and thickening were in 11 (9.2%), 31 (25.8%), and 9 (7.5%) images, respectively. Twenty-one of 29 symbols were present except cp, ef, ho, id, me, pa, ra, and rp. A set of 120 SDIs had more various
pneumoconiosis findings than ILO SARs that were developed from adequate methods. It can be used as digital reference images for the recognition and classification of
pneumoconiosis.
Key Words: Pneumoconiosis; Digital radiography; Analog radiography; ILO classification Won-Jeong Lee1, Byung-Soon Choi1,
Sung Jin Kim2, Choong-Ki Park3, Jai-Soung Park4, Seok Tae5 and Kurt Georg Hering6
1Occupational Lung Diseases Institute, Ansan;
2Department of Radiology, Chungbuk University Hospital, Cheongju; 3Department of Radiology, Hanyang University Guri Hospital, Guri; 4Department of Radiology, Soonchunhyang University Bucheon Hospital, Bucheon; 5Department of Radiology, Donghae Hospital, Donghae, Korea; 6Department of Radiology, Knappschaftskrankenhaus, Dortmund, Germany
Received: 18 May 2011 Accepted: 6 September 2011 Address for Correspondence:
Byung-Soon Choi, MD
Occupational Lung Diseases Institute, 87 Guryong-ro, Sangnok-gu, Ansan 426-858, Korea
Tel: +82.31-500-1801, Fax: +82.31-500-1811 E-mail: [email protected]
http://dx.doi.org/10.3346/jkms.2011.26.11.1403 • J Korean Med Sci 2011; 26: 1403-1408
INTRODUCTION
A patient with pneumoconiosis has to have a history of expo- sure to inorganic dust and certain distinctive features on simple chest radiographs (1, 2). Simple chest radiography is the princi- pal tool of monitoring, recognizing, and classifying pneumoco- niosis by the International Labour Office (ILO) classification (3, 4). With the standard analog radiographs (SARs) according to ILO guidelines, analog radiography (AR) has been widely used as the standard method for pneumoconiosis, due to relatively lower costs, good image quality, high spatial resolution, and the widely-accepted ILO classification.
We know the disadvantages of AR that include a limited ex- posure range, a rather high retake rate, and the inflexibility of image display and film management. Digital technology has developed an ability to offer an instant image display, a wide dynamic range, exposure latitude, and post-processing (5, 6), and previous studies showed a significant reduction of the radi- ation dose of more than 50% without loss of image quality com- pared with AR (7-9).
Digital radiography (DR) has gradually replaced AR in clini- cal practice, medical screening, public health surveillance, and epidemiological research as well as the recognition and classifi-
cation of pneumoconiosis. Although some studies concluded that DR could replace AR in the classification of pneumoconio- sis (10-13), the radiological findings of pneumoconiosis by DR may be different from those by AR because of differences in the examination methods and the image processing.
Digital images stored on Picture Archiving and Communica- tion System (PACS) from the screening of pneumoconiosis are difficult to compare with ILO SARs, thus, a study by Franzblau et al. (12) was used to the digitalized version of the ILO SARs. In this situation, digital reference images have not been developed until now that can replace the ILO SARs. Therefore, we devel- oped the standard digital images to be used for classifying pneu- moconiosis findings on chest radiograph.
MATERIALS AND METHODS Participants
Between July 3, 2006 and August 31, 2007, 531 retired male work- ers (mean age; 63.1 ± 7.9 yr, range; 42-84 yr), who were exposed to inorganic dust (mean; 19.5 ± 8.2 yr, range; 3-45 yr) participat- ed in this study after a special examination for pneumoconiosis by DR.
Radiological examinations
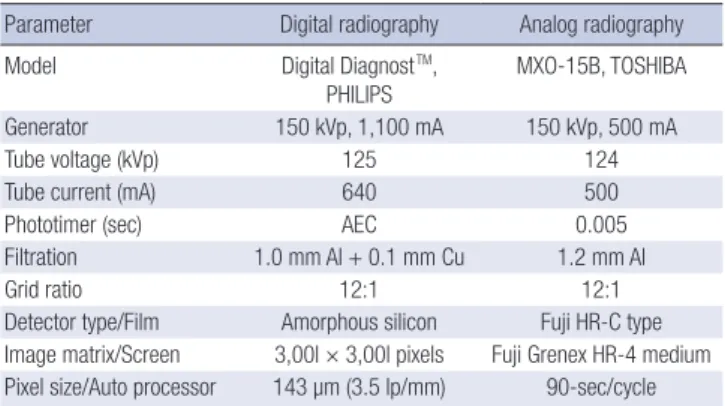
From July 3, 2006 through August 31, 2007, postero-anterior chest radiography on all participants were examined twice by DR and AR on the same day under almost identical technical conditions using a high voltage technique (120 kVp or more) in an erect position at a focus-detector distance of 180 cm. A moving grid (40 lines/cm, ratio 12:1) was used to reduce scatter (Table 1).
Digital images were captured based on the flat-panel amor- phous silicon digital detector of the Philips DR system (Digital DiagnostTM, The Netherlands), which has a pixel size of 143 µm (3.5 lp/mm) and a image matrix of 3,001 × 3,001 pixels (43 cm × 43 cm). The automatic exposure control (AEC) was adjusted to a 400-speed. The parameters of DR were 125 kVp, 500 mA, AEC mode, and a grid ratio of 12:1.
Analog radiographs were taken by a unit of Toshiba (MXO-15B, Tokyo, Japan), using an automatic film changer (CFC-B1000, CANON, Tokyo, Japan) combined with a wide-latitude asym- metric film-screen system (film; Fuji HR-C type, screen; Grenex HR-4 medium, size; 14 × 17 inch). The parameters of exposure were set to be similar to those of DR (124 kVp, 500 mA, and 0.005 sec); in addition, all films were developed by an automatic pro- cessor with a standard 90-sec cycle (PRO 20, DAESUNG, Seoul, Korea).
Readers and image readings
The pneumoconiosis findings on the individual digital and an- alog images obtained from the 531 participants were classified twice independently by four chest radiologists, with experience of more than 15 yr in the reading of pneumoconiosis, according to the ILO 2000 guidelines and SARs (2).
All images were masked for any clinical information includ- ing name, age, duration of dust exposure, and a second reading was performed about 3 months later to avoid bias. Digital im- ages that had been transferred to a PACS system were read on monitors with a 2,048 × 2,560 pixels, and analog images were displayed on a clean standard view box in a comfortable read- ing room (room lighting was controllable but subdued without direct daylight).
Selection of standard digital images
Of the 531 analog images, 349 analog images (66%) were select- ed first in consideration of image quality: 1 = Good, 2 = Accept- able, with no technical defect likely to impair classification of the radiograph for pneumoconiosis, 3 = Acceptable, with some technical defects, but still adequate for classification purposes, 4 = Unacceptable for classification purposes, according to the ILO 2000 guidelines from reading findings, after double reading by each of the four chest radiologists on all images obtained by DR and AR using the ILO 2000 guidelines with SARs (Fig. 1) . The pneumoconiosis findings of the 349 digital images matched with the first selected analog images were confirmed by a con- sensus reading of the four chest radiologists, as candidates for the standard digital images (SDIs).
From the results of the consensus reading, 120 SDIs were final- ly selected in consideration of the distribution of pneumoconi- osis findings such as profusion, location, and shape/size of small opacity, large opacity, pleural findings, and symbols. This also included an image quality using a 4-point scale: Excellent = absence of any defects, Good = some defects in position, Fair = presence of one or both scapula(e) in lung field, Poor = not com- pletely visible costophrenic angle. A set of 120 SDIs is included various parenchymal and pleural findings that the absence in ILO SARs (e.g. profusion 0/1, 1/0, 2/3, 3/2, 3/+, shape/size u, symbols aa, at, cn, co, cv, di, fr, kl, px, tb).
Ethics statement
This study was approved by the institutional review board (IRB) of the Occupational Lung Diseases Institute (Approval number:
2006-2, 2007-1). DR and AR were performed after obtaining writ- ten informed consent from all participants.
RESULTS Image quality
The 120 SDIs were of a fair grade or more using a 4-point scale for image quality. There were 85 excellent (70.8%), 11 good (9.2%), and 24 fair (20.0%) grade images.
Parenchymal findings
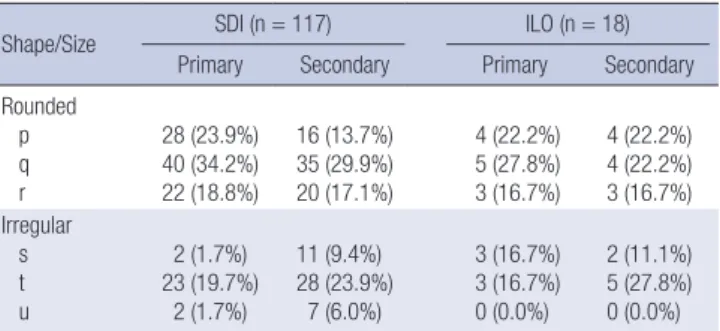
Of the 120 SDIs, 15 images had no definite pneumoconiotic find- ings and profusion Category 1, 2 and 3 were in 50, 40, and 15 images, respectively (Table 2). Images with large opacity were 43 (35.8%). Small opacities were distributed more frequently in the upper and middle lung than the lower lung (Table 3). In pri- mary small opacity, p, q and r for rounded opacity were 28, 40 and 22, and s, t and u for irregular opacity were 2, 23 and 2, re- spectively (Table 4). In secondary small opacity, p, q and r were 16, 35 and 20, and s, t and u were 11, 28 and 7, respectively. Irre- spective of primary or secondary, q and t was the most frequent in rounded and in irregular opacity, respectively.
Table 1. Digital and analog radiography used in this study
Parameter Digital radiography Analog radiography
Model Digital DiagnostTM,
PHILIPS
MXO-15B, TOSHIBA
Generator 150 kVp, 1,100 mA 150 kVp, 500 mA
Tube voltage (kVp) 125 124
Tube current (mA) 640 500
Phototimer (sec) AEC 0.005
Filtration 1.0 mm Al + 0.1 mm Cu 1.2 mm Al
Grid ratio 12:1 12:1
Detector type/Film Amorphous silicon Fuji HR-C type Image matrix/Screen 3,00l × 3,00l pixels Fuji Grenex HR-4 medium Pixel size/Auto processor 143 µm (3.5 lp/mm) 90-sec/cycle AEC, automatic exposure control.
Pleural findings
Of the 120 images, 31, 9, and 11 images showed pleural plaque (PP), diffuse pleural thickening (DPT), and costophrenic angle
(CPA) obliteration, respectively (Table 5). On the 31 images, we found 46 PPs on the either one or both sides of chest wall. PPs of the chest wall were more frequent on the right side (32 vs 14), and were accompanied by calcification in 4 cases. In addition, PPs shown as in profile were more frequent than that as face- on (38 vs 8). Three images had two PPs shown as in profile and face-on on the same side and extended up to 1/4 (3 images) and from 1/4 to 1/2 (1 image) of chest wall after summation.
On the 9 images, we found 12 DPTs on the either one or both sides of the chest wall. DPTs were more frequent on the right side (8 vs 4), and accompanied by calcification in 3 cases. In ad- dition, DPTs shown as in profile were more frequent than that Fig. 1. Work flow for developing the 120 standard digital images: IRB, Institutional Review Board; DR, digital radiography; AR, analog radiography; AEC, automatic exposure control; and SARs, ILO Standard Analog Radiographs.
Matching
Approved by IRB
Examined on the same day 531 participants Obtaining informed consent
Considering distribution of pneumoconiotic findings
Confimmation by 4 radiologists DR
125 kVp, AEC
349 digital images matched with AR Consensus reading by 4 chest radiologists
AR 124 kVp, 2.4 mAs
Selection of 349 analog images Considering image quality according to ILO guidelines 531 digital images
Selection of 120 digital images
120 standard digital images
531 danalog images
Double reading by each 4 radiologists using ILO guidelines with SARs
Table 2. Profusion of small opacity and category of large opacity
Profusion/Category SDI (n = 120) ILO (n = 20)
Small* 0 0/0
0/1
3 (2.5%) 12 (10.0%)
2 (10.0%) 0 (0.0%)
1 1/0
1/1 1/2
15 (12.5%) 21 (17.5%) 14 (11.7%)
0 (0.0%) 5 (25.0%)
1 (5.0%)
2 2/1
2/2 2/3
11 (9.2%) 16 (13.3%) 13 (10.8%)
1 (5.0%) 6 (30.0%)
0 (0.0%)
3 3/2
3/3 3/+
8 (6.7%) 5 (4.2%) 2 (1.7%)
0 (0.0%) 5 (25.0%)
0 (0.0%)
Large† 0
A B C
77 (64.2%) 20 (16.7%) 22 (18.3%)
1 (0.8%)
16 (80.0%) 2 (10.0%) 1 (5.0%)
1 (.0%) The sum of percentage may be not 100% due to rounding. *The category of profusion is based on comparisons with ILO standard analog radiographs, profusion of small opac- ities is classified into one of 12 ordered categories; †A large opacity is defined as an opacity having the longest dimension exceeding 10 mm, category A = sum of the lon- gest dimensions ≤ 50 mm, B = sum of the longest dimensions ≥ 50 mm & sum of the areas < right upper zone, C = sum of the areas > right upper zone. SDI, standard digital images; ILO, ILO standard analog radiographs excluding 2 composite radiographs.
Table 3. Distribution of small opacity
Zone SDI (n = 117) ILO (n = 18)
Right Upper 106 (90.6%) 16 (88.9%)
Left Upper 102 (87.2%) 15 (83.3%)
Right Middle 116 (99.2%) 18 (100.0%)
Left Middle 115 (98.3%) 18 (100.0%)
Right Lower 94 (80.3%) 16 (88.9%)
Left Lower 90 (76.9%) 16 (88.9%)
SDI, standard digital images (excluding 3 images with profusion subcategory 0/0);
ILO, ILO standard analog radiographs (excluding 2 composite radiographs and 2 ra- diographs with profusion subcategory 0/0).
as face-on (10 vs 2). Two images had two DPTs shown as in pro- file and face-on on the same side and extended more than 1/2 of the chest wall after summation. CPA obliteration was found more frequent on the right side (7 vs 4). Seven CPA obliterations were accompanied with diffuse pleural thickening (right 5 vs left 2). Calcification was found in 6 PPs of 4 images (chest wall 4 and diaphragm 2) and 3 DPTs of 2 images. They were more fre- quent on the right side (6 vs 3).
Symbols
Twenty-nine symbols are additional features related to dust ex- posure and other aetiologies, and use of symbols is obligatory.
The symbols are: atherosclerotic aorta (aa), significant apical pleural thickening (at), coalescence of small opacities (ax), bul- la (bu), cancer (ca), calcified non-pneumoconiotic nodules or nodes (cg), calcification in small pneumoconiotic opacities (cn), abnormality of cardiac size or shape (co), cor pulmonale (cp), cavity (cv), marked distortion of an intrathoracic structure (di), pleural effusion (ef), emphysema (em), eggshell calcification of hilar or mediastinal lymph nodes (es), fractured rib (fr), enlarge- ment of non-calcified hilar or mediastinal lymph nodes (hi),
honeycomb lung (ho), ill-defined diaphragm border (id), ill- defined heart border (ih), septal (Kerley) lines (kl), mesothelio- ma (me), plate atelectasis (pa), parenchymal bands (pb), pleu- ral thickening of an interlobar fissure (pi), pneumothorax (px), rounded atelectasis (ra), rheumatoid pneumoconiosis (rp), tu- berculosis (tb), other disease or significant abnormality (od).
Instead of 15 symbols on the ILO SARs, we found 21 symbols out of 29 symbols except cp, ef, ho, id, me, pa, ra, and rp on the 120 SDIs. The ax was found most frequently in 64 images (53.3%), and bu, tb, em, pb, cg, at, and aa were in 40, 35, 21, 19, 18, 14, and 10 images, respectively. Each of hi and kl in 8, and each of es and fr in 7, each of ca and cn in 6, each of ih and pi in 5, each of di and od was found in 4 images; however, co, cv, and px were found only in one image.
DISCUSSION
Simple chest radiography has traditionally been used for the recognition of pneumoconiosis in dust-exposed workers. Cur- rently, the ILO 2000 guidelines with 22 standard analog radio- graphs are used for classifying pneumoconiosis in the world.
The patient with pneumoconiosis has been increased a few each year in Korea although decline of the coal mining industry (14), and DR have being replaced instead of the AR for screen- ing pneumoconiosis.
Since DR was introduced in the early 1980s (15), it has been well accepted in clinical practice because of easy handling, less chemical waste, less space for storage, and better latitude as well as a possible reduction of the radiation dose without a loss of image quality compared to AR in chest radiology (8, 9, 16). Pre- vious studies demonstrated that DR can replace AR as the stan- dard method in the diagnosis and classification of pneumoco- niosis (10-13).
During the pneumoconiosis classification, the ILO requires that the patient’s radiograph should be compared side-by-side to the appropriate comparison images from the ILO standard reference set that consisted of 22 analog radiographs. However, it is very uncomfortable for reader to compare patient’s radio- graph to the multiple reference radiographs simultaneously or in turn. In addition, a reader using DR has to compare the digi- Table 4. Shape and size of small opacity
Shape/Size SDI (n = 117) ILO (n = 18)
Primary Secondary Primary Secondary Rounded
p q r
28 (23.9%) 40 (34.2%) 22 (18.8%)
16 (13.7%) 35 (29.9%) 20 (17.1%)
4 (22.2%) 5 (27.8%) 3 (16.7%)
4 (22.2%) 4 (22.2%) 3 (16.7%) Irregular
s t u
2 (1.7%) 23 (19.7%)
2 (1.7%)
11 (9.4%) 28 (23.9%)
7 (6.0%)
3 (16.7%) 3 (16.7%) 0 (0.0%)
2 (11.1%) 5 (27.8%) 0 (0.0%) The sum of percentage may be not 100% due to rounding. The shape and size of small opacities are recorded, two kinds of shape are recognized as rounded (p = diameters up to about 1.5 mm, q = diameters exceeding about 1.5 mm and up to about 3 mm, r = diameters exceeding about 3 mm and up to about 10 mm) and irregular (s = widths up to about 1.5 mm, t = widths exceeding about 1.5 mm and up to about 3 mm, u = widths exceeding about 3 mm and up to about 10 mm). Two letters must be used to record the shape and size, the letter for the predominant shape and size is recorded as primary, and as secondary for the less frequently occurring shape and size. SDI, standard digital images (excluding 3 images with profusion subcategory 0/0);
ILO, ILO standard analog radiographs (excluding 2 composite radiographs), and 2 ra- diographs with profusion subcategory 0/0 (One composite radiograph has 3 u/u).
Table 5. Distribution of pleural findings on the 120 standard digital images
PP/Calcification (31 images) DPT/Calcification (9 images)*
CPAO (11 images) Chest wall
Diaphragm No
Extent†
No Extent†
a b c
a b c
Left 14/1 11‡ 1 1 1/0 4/2 2 - 1‡ 4
Right 32/3 20‡ 6‡ 3 2/2 8/1 4 1 2‡ 7
Total 46/4 31 7 4 3/2 12/3 6 1 3‡ 11
All data are expressed as the number of each pleural finding. *DPT and calcification are considered only at the chest wall, †Extent category a; up to 1/4, b; from 1/4 to 1/2, c;
more than 1/2, ‡Extent of the individual PP or DPT shown as in profile and face-on on the same side of the chest wall was summed up and counted as one. PP, pleural plaque;
DPT, diffuse pleural thickening; CPAO, costophrenic angle obliteration.
talized pneumoconiosis findings to the ILO SARs because stan- dard digital images are not developed. However, it is impracti- cal to use a separate view box to display the ILO SARs because it degrades the workflow and alters the perception of the pneumo- coniosis findings.
First, it is improper to compare digital images with analog ra- diographs. Takashima et al. (11) reported that in the application of DR to the medical screening of dust-exposed workers, it is dif- ficult to compare subject’s images with the ILO SARs. It is even more difficult to read digital images on PACS compared to the ILO SARs directly. Franzblau and colleagues (12) demonstrated that the digitalized version of the ILO SARs may provide an ap- proach for the implementation of the ILO classification for digi- tal images; however, it could not ensure reliability and validity because pneumoconiosis findings could be different between the soft-copied and hard-copied image. Original analog images were more accurate than corresponding digitalized images (97%
vs 89%) in the diagnosis of interstitial lung diseases (17). In the study reported by Mannino et al. (18) the interpretation of digi- talized images for small opacities of pneumoconiosis was differ- ent from that of original analog images. In this situation, it is im- perative to develop the standard digital images for the classifi- cation of pneumoconiosis instead of the ILO SARs.
We tried to ensure the validity and reliability of digital images that can be used as standard for the classification of pneumo- coniosis. First, all digital images and analog radiographs were obtained according to the guidelines for chest radiography, such as high kVp (120 or more), short exposure time (below 0.03 sec), and grid ratio of above 10:1. Second, after digital images and an- alog radiographs were taken simultaneously from the same ex- aminee, pneumoconiosis findings on the all images were clas- sified twice according to the ILO guidelines and SARs by four chest radiologists with experience of more than 15 yr in the read- ing of pneumoconiosis findings. Third, 120 SDIs were selected to consider the distribution of pneumoconiosis findings on the corresponding analog radiographs by a consensus reading of the four chest radiologists.
Pneumoconiosis findings on a chest radiograph can be signif- icantly affected by the image quality (2, 6), and it is very impor- tant to acquire highly qualified images. An optimal image for the classification of pneumoconiosis should reveal the fine de- tail of parenchymal markings, clearly demonstrate the CPA, and show vascular markings through the cardiac and subdiaphrag- matic shadow. In addition, common quality faults include an under-exposure that is often associated with a tendency for the over-estimation of profusion and the over-exposure associated with the reverse tendency (3). We selected the 120 SDIs that had an image quality grade of fair or more. Therefore, they may have some defects in the examinee’s position or presence of scapula(e) in lung field. However, the ILO SARs also have some technical defects such as over or under exposure, invisible costophrenic
angle, and presence of scapula(e) in lung field.
Digital images can be produced from the various detector systems such as computed radiography based on the imaging plate (CR), a flat panel based on amorphous silicon (a-Si DR), a flat panel based on amorphous selenium (a-Se DR), and charge- coupled device (CCD). These systems have different basic im- age quality parameters to indicate the performance of the detec- tor such as a detective quantum efficiency (DQE) and modula- tion transfer function (MTF) (19, 20). In our study, digital images were produced by the detector based on a-Si DR to provide more superior image quality to other detector systems and to allow the potential of reduction in radiation dose (9, 16, 20, and 21).
Our set of 120 SDIs includes all categories of small and large opacity and has variable shape and size of small opacity, where- as ILO SARs have not some subcategory which is 0/1, 1/0, 2/3, 3/2, and 3/+. Our SDIs have more pleural findings than ILO SARs, except one composite radiograph with pleural findings.
In addition, they have symbols that are not in the ILO SARs (aa, at, cn, co, cv, di, fr, kl, px, and tb).
In a digitalized environment it is not problem that our SDIs have more reference images than the ILO SARs (120 vs 22), be- cause of the easy and rapid reference from a server or compact disc after storing the SDIs. The image quality of analog radio- graphs may deteriorate and change the pneumoconiosis find- ings over time; however, the stability of SDIs does not change over an extended period of time. The 120 SDIs are encoded in Digital Imaging and Communication in Medicine (DICOM) files to maximize the consistency of display on different workstations and to allow it to be stored within PACS. This study was performed independently with ILO.
A set of 120 SDIs have more various pneumoconiosis findings than ILO SARs and was developed from adequate methods. It can be used as the digital reference images for the recognition and classification of pneumoconiosis.
ACKNOWLEDGMENTS
The authors thank all retired workers who participated in this study.
REFERENCES
1. Banks DE, Parker JE. Occupational lung disease: the diagnosis of pneu- moconiosis and novel therapies. London: Chapman & Hall Publishing Company, 1998, p119-38.
2. International Labour Organization (ILO). Guidelines for the use of ILO international classification of radiographs of pneumoconioses, Revised edition 2000. Geneva: International Labour Office, 2002.
3. Wagner GR, Attfield MD, Parker JE. Chest radiography in dust-exposed miners: promise and problems, potential and imperfections. Occup Med 1993; 8: 127-41.
4. Pham QT. Chest radiography in the diagnosis of pneumoconiosis. Int J
Tuberc Lung Dis 2001; 5: 478-82.
5. Redlich U, Hoeschen C, Doehring W. Assessment and optimisation of the image quality of chest-radiography systems. Radiat Prot Dosimetry 2005; 114: 264-8.
6. Krupinski EA, Williams MB, Andriole K, Strauss KJ, Applegate K, Wyatt M, Bjork S, Seibert JA; ACR, AAPM, Society for Imaging Informatics in Medicine. Digital radiography image quality: image processing and dis- play. J Am Coll Radiol 2007; 4: 389-400.
7. Hosch WP, Fink C, Radeleff B, Kampschulte A, Kauffmann GW, Hans- mann J. Radiation dose reduction in chest radiography using a flat-pan- el amorphous silicon detector. Clin Radiol 2002; 57: 902-7.
8. Bacher K, Smeets P, Bonnarens K, De Hauwere A, Verstraete K, Thierens H. Dose reduction in patients undergoing chest imaging: digital amor- phous silicon flat-panel detector radiography versus conventional film- screen radiography and phosphor-based computed radiography. AJR Am J Roentgenol 2003; 181: 923-9.
9. Ganten M, Radeleff B, Kampschulte A, Daniels MD, Kauffmann GW, Hansmann J. Comparing image quality of flat-panel chest radiography with storage phosphor radiography and film-screen radiography. AJR Am J Roentgenol 2003; 181: 171-6.
10. Sen A, Lee SY, Gillespie BW, Kazerooni EA, Goodsitt MM, Rosenman KD, Lockey JE, Meyer CA, Petsonk EL, Wang ML, Franzblau A. Compar- ing film and digital radiographs for reliability of pneumoconiosis classi- fications: a modeling approach. Acad Radiol 2010 ; 17: 511-9.
11. Takashima Y, Suganuma N, Sakurazawa H, Itoh H, Hirano H, Shida H, Kusaka Y. A flat-panel detector digital radiography and a storage phos- phor computed radiography: screening for pneumoconioses. J Occup Health 2007; 49: 39-45.
12. Franzblau A, Kazerooni EA, Sen A, Goodsitt MM, Lee SY, Rosenman KD, Lockey JE, Meyer CA, Gillespie BW, Petsonk EL, Wang ML. Com-
parison of digital radiographs with film radiographs for the classifica- tion of pneumoconiosis. Acad Radiol 2009; 16: 669-77.
13. Laney AS, Petsonk EL, Wolfe AL, Attfield MD. Comparison of storage phosphor computed radiography with conventional film-screen radiog- raphy in the recognition of pneumoconiosis. Eur Respir J 2010; 36: 122-7.
14. Choi BS, Park SY, Lee JO. Current status of pneumoconiosis patients in Korea. J Korean Med Sci 2010; 25: S13-9.
15. Sonoda M, Takano M, Miyahara J, Kato H. Computed radiography uti- lizing scanning laser stimulated luminescence. Radiology 1983; 148:
833-8.
16. De Hauwere A, Bacher K, Smeets P, Verstraete K, Thierens H. Analysis of image quality in digital chest imaging. Radiat Prot Dosimetry 2005;
117: 174-7.
17. Bassignani MJ, Bubash-Faust L, Ciambotti J, Moran R, McIlhenny J. Con- version of teaching file cases from film to digital format: a comparison between use of a diagnostic-quality digitizer and use of a flatbed scanner with transparency adapter. Acad Radiol 2003; 10: 536-42.
18. Mannino DM, Kennedy RD, Hodous TK. Pneumoconiosis: comparison of digitized and conventional radiographs. Radiology 1993; 187: 791-6.
19. Granfors PR, Aufrichtig R. Performance of a 41 × 41-cm2 amorphous sili- con flat panel x-ray detector for radiographic imaging applications. Med Phys 2000; 27: 1324-31.
20. Schaefer-Prokop C, Neitzel U, Venema HW, Uffmann M, Prokop M.
Digital chest radiography: an update on modern technology, dose con- tainment and control of image quality. Eur Radiol 2008; 18: 1818-30.
21. Rong XJ, Shaw CC, Liu X, Lemacks MR, Thompson SK. Comparison of an amorphous silicon/cesium iodide flat-panel digital chest radiography systems with screen/film and computed radiography systems: a contrast- detail phantom study. Med Phys 2001; 28: 2328-35.
AUTHOR SUMMARY
Development of Standard Digital Images for Pneumoconiosis
Won-Jeong Lee, Byung-Soon Choi, Sung Jin Kim, Choong-Ki Park, Jai-Soung Park, Seok Tae and Kurt Georg Hering
Digital radiography (DR) is replacing conventional analog radiography (AR) in monitoring and classification for pneumoconiosis.
However, the radiological findings of pneumoconiosis by DR may be different from those by AR because of differences in the examination methods and the image processing. Here we developed the standard digital images for pneumoconiosis.