© Korean Powder Metallurgy Institute 1095
-1. Introduction
The ionic radius of Y3+ ion (0.09nm) is somewhere
between that of Ba2+ ion (0.14nm) and Ti4+ (0.06nm) ion.
Thus, Y3+ can be used on either cation site of BaTiO 3
sub-lattice, depending on the Ba/Ti ratio [1]. Recent results showed that Y3+ acts like a donor impurity when Y
2O3 is
added to the stoichiometric BaTiO3 (Ba/Ti=1) or
BaO-excess BaTiO3 [2-3]. Furthermore, according to our
recent results, Y2O3 addition to Ba-excess BaTiO3 showed a
donor-doped behavior at low levels of Y2O3 (≤1.0 mol%)
and an acceptor-doped behavior at higher levels (>1.0 mol%). This result imply that below 1 mol% Y, Y3+ ions
preferentially occupy Ba sites even in BaTiO3+
x(BaO+0.5Y2O3), with excess BaO.
In this paper, the effect of yttrium addition on electrical conductivities of Ti-excess BaTiO3 ((Ba+Y)/Ti =1) is
investigated. The occupancy of the [ ] site by yttrium will be discussed in terms of microstructure development, equilibrium electrical conductivity and lattice constant.
2. Experimental and Results
Samples were prepared by a conventional ceramic processing and using BaTiO3 (Sakai BT04), TiO2(Aldrich)
and Y2O3(NanoTek). These samples were sintered at 1300 oC for 3 h in air. The conductivity was measured at 1100 oC
using a four point d.c. method. The desired oxygen partial pressure was obtained by using N2-O2 and CO-CO2. The
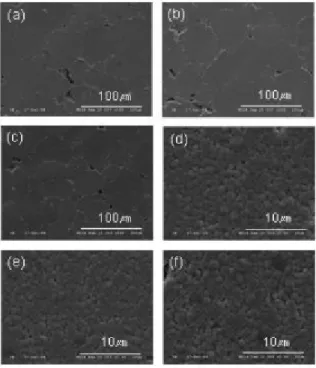
oxygen activity was measured using a closed-end tube of stabilized zirconia. Figure 1 shows the microstructures of specimens having nominal compositions of
BaTiO3+x(0.5Y2O3+TiO2) where x = 0, 0.002, 0.005, 0.01,
0.02, and 0.03. At lower levels of Y addition, larger grains were developed as shown Fig. 1(a) ~ (c), whereas the grain growth was suppressed at higher Y levels as shown in Fig. 1(d) ~ (f). A significant grain growth inhibition was observed at the doping level of 1.0 mol% Y, compared with 0.5 mol% Y. This result is similar to the window of grain growth inhibition threshold (GGIT) of donor doped BaTiO3
with TiO2 excess [2-5]. Figure 2 shows the electrical
conductivity profiles measured as a function of oxygen partial pressure at 1100 oC. The electrical conductivity
profiles of TiO2-excess BaTiO3 with 0.5 mol% or 1.0 mol%
Y showed a donor-doped behavior as in Fig. 2. When Y3+
ions used as donor in the Ba sites, YBa·is compensated either
by electrons or by cation vacancies [6-7]. The electrical conductivity at low Po2 (reduced atmosphere) increases
with Y contents, which indicates that YBa·is compensated by
electrons. At the ambient atmosphere, electrical conductivities follow the –1/4th power of Po
2 [6,8,9]. This
implies that Y3+ ions effectively substituted for Ba sites and
are compensated by cation vacancies at higher Po2. Figure 3
shows partial X-ray diffractograms for BaTiO3 doped with
various levels of Y2O3. As Y content was increases, (002)
and (200) peaks shift to higher angles, leading to the contraction of BaTiO3 unit cell. These samples were
quenched after sintering at 1300oC for 3 h, preventing significant diffusion and segregation of dopants and defects. Since the ionic radius of Y3+ ion (0.09nm) is somewhere
between that of Ba2+ ion (0.14nm) and Ti4+ (0.06nm) ion,
the lattice constant may decrease with increasing the yttrium substitution for Ba sites (YBa·). This result supports
that Y3+ ions replace Ba sites in BaTiO
3+x(0.5Y2O3+TiO2).
2006 POWDER METALLURGY World Congress
PC05-W-06
Effects of Y
2O
3Addition on the Microstructure and Electrical Property of
TiO
2-excess BaTiO
3
Jong Han Kim1,2,a and Young Ho Han1,b 1
Department of Advanced Material Engineering, Sungkyunkwan University, 300 Chunchun-dong, Jangan-gu, Suwon 440-746, Korea
2
Samsung Electro-mechanics, 314 Maetan3-dong, Youngtong-gu, Suwon 443-803, Korea
a
[email protected], bCorresponding author: [email protected] Abstract
When Y2O3 was added to Ti-excess BaTiO3 ((Ba+Y)/Ti =1), the area occupied by Y3+ion was confirmed by its microstructure
development, electrical conductivity behavior and lattice constant. Grain growth inhibition was observed when the content
of donor dopant exceeded a critical value (x≈0.01) in BaTiO3+x(0.5Y2O3+TiO2) system. A donor-doped behavior was
observed at various Y contents (0.2~3.0 mol% Y) when Y2O3 was added to TiO2-excess BaTiO3. As Y content was increased, (002) and (200) peaks shifted to higher angles and the lattice constant (a and c axis) decreased gradually.
© Korean Powder Metallurgy Institute 1096 -Fig. 2. Electrical conductivity at 1100 of ℃
BaTiO3+x(0.5Y2O3+TiO2)
This data is compatible with the equilibrium electrical conductivity behavior shown in Fig. 2, where the donor doped-behavior was clearly obvious.
3. Summary
The Y2O3 addition to Ti-excess BaTiO3((Ba+Y)/Ti =1)
showed a typical microstructure development; larger grains were observed at low levels(≤0.5 mol% Y) and small and uniform grain size distribution, at high levels(≥ 1.0 mol %). Equilibrium electrical conductivity data followed the –1/4th
sloped of oxygen partial pressure dependence at near ambient. As Y content was increased, (002) and (200) peaks
shifted to higher angles and the lattice constant (a and c axis) decreased gradually. These results confirms that Y3+ ions preferentially occupy Ba sites when Ba/Ti < 1.
Fig. 3. Partial X-ray diffractogram for BaTiO3+x(0.5Y2O3+TiO2) : (a) x = 0, (b) x = 0.01, (c) x = 0.02, (d) x = 0.03.
4. References
1. Y. Tsur, T. D. Dunbar and C. A. Randall : J. Electroceram. Vol.7 (2001), p. 25
2. L. A. Xue, Y. Chen and J. Brook : Materials Science and Engineering Vol. B1 (1988), p. 193
3. M. H. Lin and H. Y. Lu : Mater. Sci. Eng. Vol. A335 (2002), p. 101
4. C. J. Peng, and H. Y. Lu : J. Am Ceram. Soc. Vol. 71[1] (1988), p. C44
5. C. J. Ting, C. J. Peng, H. Y. Lu and S. T. Wu : J. Am Ceram. Soc. Vol. 73 (1990), p. 329
6. J. H. Jeong, M. G. Park and Y. H. Han : J. Electroceram. Vol. 13 (2004), p. 805
7. K. Takada, E. Chang and D. M. Smyth : Adv. in Cera. Vol. 19 (1986), p. 147
8. N. H. Chan, and D.M. Smyth : J. Am. Ceram. Soc. Vol. 67 (1984), p. 285
9. J. Daniels and K. H. Härdtl : Philips Res. Repts. Vol. 31 (1976), p. 489
Fig. 1. SEM photomicrographs of BaTiO3 + x (0.5Y2O3+TiO2) sintered at 1300oC for 3 h: (a) un-doped BaTiO3 (b) x = 0.002, (c) x = 0.005, (d) x = 0.01, (e) x = 0.02, (f) x = 0.03