논벼에서 관측된 태양 유도 엽록소 형광 자료:
나주에서 2020년 6월 10일부터 10월 5일까지
류재현1, 장선웅2, 김현기1,3, 문현동1, 신서호4, 이양원5, 조재일1,3* 1) 1전남대학교 농업생명과학대학 응용식물학과, 2(주)아이렘기술개발, 3전남대학교 IT-Bio융합시스템농업교육연구단, 4전남농업기술원 식량작물연구소, 5부경대학교 환경해양대학 공간정보시스템공학과 (2020년 12월 3일 접수; 2021년 1월 25일 수정; 2021년 2월 8일 수락)Sun-induced Fluorescence Data:
Case of the Rice Paddy Field in Naju
Jae-Hyun Ryu1, Seon Woong Jang2, Hyunki Kim1,3, Hyun-Dong Moon1, Seo-Ho Sin4, Yang-Won Lee5, Jaeil Cho1,3*
1Department of Applied Plant Science, Chonnam National University, 77 Yongbong-ro,
Gwangju 61186, Republic of Korea
2IREMTECH, Co., Ltd, 10-1, Dume-ro, Gijang-Gun, Busan 46079, Republic of Korea
3BK21 FOUR Center for IT-Bio Convergence System Agriculture, Chonnam National University, 77 Yongbong-ro,
Gwangju 61186, Republic of Korea
4Food Crop Research Center, Agricultural Research & Extension Services, 1508,
Senam-ro, Sanpo-myeon, Naju-si, Jeollanam-do 58213, Republic of Korea
5Department of Spatial Information Engineering, Pukyong National University,
45 Yongso-ro, Namgu, Busan 48513, Republic of Korea
(Received December 3, 2020; Revised January 25, 2021; Accepted February 8, 2021)
ABSTRACT
Sun-induced fluorescence (SIF) retrieval using remote sensing technique has been used in an effort to understand the photosynthetic efficiency and stress condition of vegetation. Although optical devices and SIF retrieval methodologies were established in order to retrieve SIF, the SIF measurements are domestically sparse. SIF data of paddy rice w as measured in Naju, South Korea from June 10, 2020 to October 5, 2020. The SIFs based red (O2A) and far-red
(O2B) w ere retrieved using a spectral fitting method and an improved Fraunhofer line depth,
and photosynthetically active radiation was also produced. In addition, the SIF data was filtered considering solar zenith angle, saturation conditions, the rapid and sudden change of solar irradiance, and sun glint. The provided SIF data can help to understand a SIF product and the filtering method of SIF data can contribute to producing high-quality SIF data. Key words: Sun-induced fluorescence, Improved Fraunhofer line depth, Spectral fitting method,
Paddy rice, FloX
* Corresponding Author : Jaeil Cho ([email protected])
I. 배경 및 요약
총일차생산량(Gross Primary Production, GPP)은 광 에너지로 유기물을 생산하는 일련의 광합성 기작에 사용된 식물의 이산화탄소 흡수량을 의미하며(Hong et al., 2011), 식물의 생육 및 생리적 특성과 육상생태 계와 대기 사이의 탄소 플럭스 교환을 파악하는데 유 용한 지표이다. 식생 군락의 GPP는 에디공분산(Eddy Covariance, EC) 시스템을 중심으로 한 이산화탄소 플 럭스 관측 사이트에서 획득된 순생태계 교환량(Net Ecosystem Exchange, NEE)과 생태계 호흡량(Ecosystem Respiration, Re)으로부터 추정할 수 있다. 하지만 에 디공분산 관측 시스템은 많은 비용과 지속적인 전문적 관리가 요구되며, 획득된 GPP는 공간적으로 한정된 관측 범위(Footprint)를 가진다(Lee et al., 2019). 이에 따라, 선행 연구자들은 기상과 원격탐사 자료를 융합 한 GPP 추정 기법을 이용하여 보다 확장된 공간 분포 와 변동 특성을 연구하고 있으나 여전히 많은 불확실 성을 가지고 있다(Sun et al., 2017). 태양 유도 엽록소 형광(Sun-Induced Fluorescence, SIF)은 광합성에서 광 에너지를 생화학적 에너지로 변 환한 광인산화반응(Photophosphorylation)의 부산물 인 엽록소 형광 방출량을 기반으로 하기 때문에 GPP 를 매우 유의하게 추정할 수 있는 새로운 원격탐사 산출물로 알려져 있다. SIF는 식물이 흡수한 광합성 유효 복사(Photosynthetically Active Radiation, PAR) 중 엽록소-a (Chlorophyll-a)에서 이용되지 않은 에너 지가 650∼800 nm 파장대에서 방출되는 전자기적 신 호이므로 식물의 PAR 포획량과 광합성 효율에 민감 하게 반응한다(Guanter et al., 2014). 이러한 장점에도 불구하고 식물이 방출하는 엽록 소 형광은 관측된 에너지의 1∼5% 정도로 매우 약하 기 때문에 관측하는데 어려움이 있다(Julitta et al., 2016). 선행연구의 SIF 관측기기 민감도 테스트 결과, SIF의 관측에는 0.5 nm 이하의 분광해상도(Spectral resolution)를 가지는 초분광계(Hyper-spectrometer) 가 요구된다(Julitta et al., 2016). 또한, SIF 계산을 위 해서는 태양복사조도(Solar irradiance)와 식생으로부 터의 복사휘도(Radiance)가 광섬유(Optical fiber)를 통해 서로 다른 시야각(Field Of View, FOV) 조건에 서 관측된다는 점도 고려해야 하며, SIF의 연속 관측 을 위해서는 태양복사조도의 변화에 따라 관측 기기의 노출시간(Integration time)을 재설정하여야 한다. 따 라서 국내외적으로 SIF 관측기기의 야외 설치 경험은 물론 관측 자료가 많지 않은 것이 현실이다. SIF 관측 기기 개발은 분광센서 기술의 발달과 함께 활발히 진행 중이며, 최근 SIF 산출 방법론을 비교한 결과(Cendrero-Mateo et al., 2019)가 발표되는 등 SIF 의 안정적인 관측과 산출을 위한 노력이 진행되고 있다. 본고에서는 나주에서 논벼를 대상으로 Fluorescence box (FloX, JB Hyperspectral Devices, Düsseldorf, Germany) 광학 관측 기기를 이용하여 2020년 재배기 간 동안 관측된 SIF 자료를 공개하였다. SIF 자료는 687 nm (O2B 흡수 밴드)와 760 nm (O2A 흡수 밴드)
대역에서의 관측값을 기반으로 Improved Fraunhofer line depth (iFLD) (Alonso et al., 2008)와 spectral fitting method (SFM) (Cogliati et al., 2015) 방법론을 통해 산출하였으며, 각각의 방법론을 비교하고 흡수 밴드에 따른 SIF의 특성을 이해하여 활용성을 높이는 데 목적이 있다.
II. 방 법
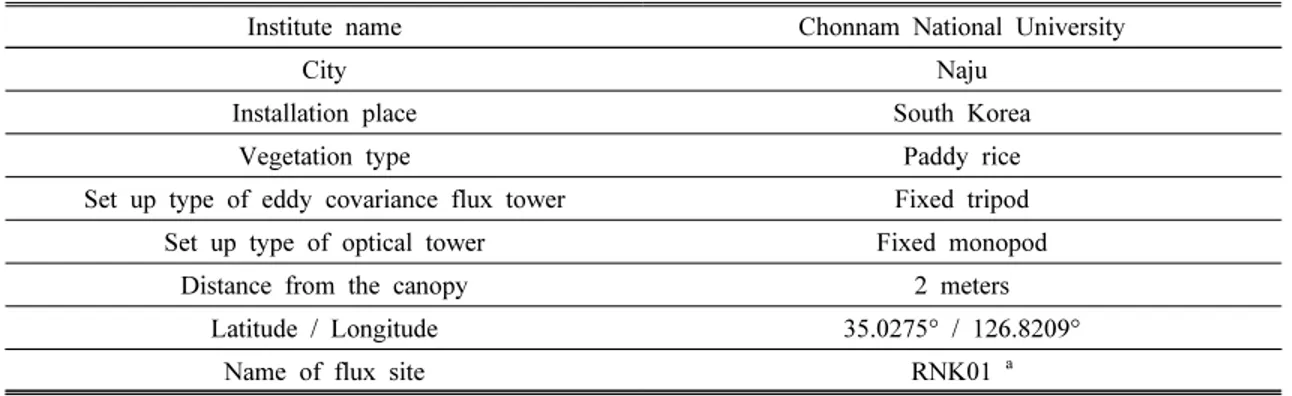
2.1. 태양 유도 엽록소 형광 관측 기기 설치 우리나라 대표적인 식량 작물인 벼의 SIF를 측정 하기 위하여 전라남도 나주시 산포면 전남농업기술 원 논 포장(위도: 35.0275°N, 경도: 126.8209°E)에 고정형 광학 관측 기기를 설치하였다(Table 1). JB Hyperspectral Devices 사의 SIF 관측기기 FloX는 2 개의 초분광계로 구성되어 있다. SIF 측정을 위한 초 분광계는 650∼880 nm 파장 대역을 0.17 nm SSI (Spectral sampling interval)로 관측하며 0.3 nm의 분 광해상도를 가진다. 가시광선부터 근적외선 대역을 관 측하는 초분광계는 400∼950 nm 파장 대역을 1.5 nm 의 분광해상도로 관측한다. 각각의 초분광계는 태양복 사조도와 식생 복사휘도를 측정하기 위한 광섬유들이 연결되어 있으며, 태양복사조도는 광섬유 말단에 코사 인 교정기(Cosine corrector)를 장착하여 180° 시야각 으로 측정되었다. 식생 복사휘도를 관측하는 광섬유 (bare optical fiber)의 시야각은 25°이며, 초관 (Canopy)으로부터 약 2 m 높이에 직하(Nadir)로 식생 을 바라보게 설치하였으며, 관측 반지름은 약 42.3 cm 이다(Fig. 1). 2020년 6월 10일부터 2020년 10월 5일까지 매일 오전 6시부터 오후 6시까지 12시간 동안 SIF 관측을 자동으로 수행하도록 설정하였다. SIF는 1∼2분 간격으로 관측되고 집록되는데, 관측 간격이 일정하지 않 은 이유는 태양복사조도 값에 따라서 초분광계가 광섬 유 센서를 통해 빛을 받아들이는 노출시간이 달라지도 록 설정되었기 때문이다. 광섬유 센서는 노출시간이 길수록 보다 강한 신호를 받아들이게 된다. 그러므로 맑은 날에는 과다 노출로 인한 초분광계의 광 포화한 계(saturation level)를 넘어설 가능성이 높으므로 흐린 날보다 상대적으로 노출시간이 짧고, 하루 동안 관측 된 자료의 수가 많다. 관측된 자료는 JB Hyperspectral Devices 사가 제작 한 R 프로그래밍 언어 기반의 GUI 프로그램(Version: 14.2)을 이용하여 처리하였다. 해당 프로그램에서는 SFM과 iFLD 방법(Cendrero-Mateo et al., 2019)을 선 택하여 SIF를 산출할 수 있으며, 본 연구에서는 두 가 지 방법론 모두를 사용하여 SIF를 산출하였다.
III. 자료 및 사용방법
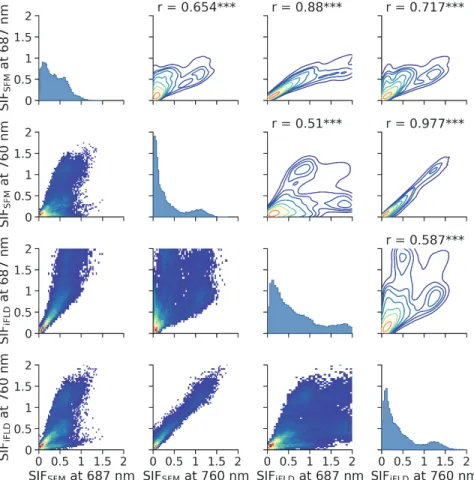
처리된 광학 자료는 저자가 운영하는 Github 사이 트(https://github.com/geoaura/KSAFM_Data_FloX) 에서 내려 받기가 가능하다. 자료의 변수명은 JB Hyperspectral Devices 사의 자료 처리 프로그램에서 명명한 이름을 따르며, 변수들에 대한 자세한 설명은 Table 2와 같다. 관측 시간(Datetime), 태양천정각 (Solar Zenith Angle, SZA), 광합성 유효 복사(PAR), 그리고 687 nm (O2B 흡수 밴드)와 760 nm (O2A 흡수 밴드) 대역의 자료를 2가지 방법론과 2가지 밴드를 이 용한 4개의 SIF 값과 함께 정리하였다. 자료는 csv (comma-separated value) 파일로 되어 있으며, text 편집기 및 프로그래밍 언어를 통해 이용 가능하다. 전 생육기간 동안의 자료가 모두 제공되므 로 벼의 영양생장기, 생식생장기, 그리고 등숙기 동안 의 SIF 시계열 변화를 볼 수 있다. Fig. 2는 두 가지 방법론으로 산출된 687 nm와 760 nm 대역의 SIF들에 대한 상호간의 상관관계를 나타낸 것이다. 760 nm 기반 SIFSFM과 SIFiFLD의 상관계수(Pearson correlation coefficient)는 0.977 (***, p-value < 0.001)로 높은 일치도를 보이며 방법론에 따른 값의 차이가 적었다. 반면, 687 nm 기반 SIF에서 Institute name Chonnam National University
City Naju
Installation place South Korea Vegetation type Paddy rice Set up type of eddy covariance flux tower Fixed tripod
Set up type of optical tower Fixed monopod Distance from the canopy 2 meters
Latitude / Longitude 35.0275° / 126.8209° Name of flux site RNK01 a a ‘RNK’ is an abbreviation of ‘Rice (Crop type), Naju (City), Korea (Nation)’.
Table 1. A summary of SIF measurement site.
Fig. 1. Drone-based NRG (Near-infrared, Red, Green) composite image. The vegetation type of study area is paddy rice, and the flux tower and the optical device in the site named RNK01 were installed in the paddy field. ‘RNK’ is an abbreviation of ‘Rice (Crop type), Naju (City), Korea (Nation)’.
Variable ID b Units Description (KOR) Description (ENG)
Datetime UTC 날짜 Datetime
SZA degree 태양천정각 Solar Zenith Angle SIF_A_ifld mW/m2/nm/sr iFLD 방법으로 산출된 O2A밴드(760
nm) 기반 태양 유도 엽록소 형광 Sun-induced Fluorescence at O(760 nm) using iFLD method c2A band
SIF_B_ifld mW/m2/nm/sr iFLD 방법으로 산출된 O2B밴드(687
nm) 기반 태양 유도 엽록소 형광 Sun-induced Fluorescence at O(687 nm) using iFLD method 2B band SIF_A_sfm mW/m2/nm/sr SFM 방법으로 산출된 O2A밴드(760
nm) 기반 태양 유도 엽록소 형광 Sun-induced Fluorescence at O(760 nm) using SFM method d2A band
SIF_B_sfm mW/m2/nm/sr SFM 방법으로 산출된 O2B밴드(687
nm) 기반 태양 유도 엽록소 형광 Sun-induced Fluorescence at O(687 nm) using SFM method 2B band PAR W/m2 광합성 유효 복사 Photosynthetically active radiation a Fluorescence box (FloX, JB Hyperspectral Devices, Düsseldorf, Germany), b The ID of variable was named
from FloX optical device, c iFLD: improved Fraunhofer line depth (FLD), d SFM: Spectral fitting method.
Fig. 2. Pair plot of four type’s sun-induced fluorescence (SIF) that is retrieved using a spectral fitting method (SFM) and improved Fraunhofer line depth (iFLD). The unit of SIF is mW/m2/nm/sr. The lower triangle part of pair plot is density scatter
plot and the upper triangle part is contour plot. The diagonal part indicates the distribution of data.
는 상대적으로 낮은 상관관계(r = 0.880, p-value < 0.001)가 나타났다. Cendrero-Mateo et al.(2019)에 의 하면 분광해상도와 신호잡음비(Signal to noise ratio, SNR)가 뛰어난 QE Pro (Ocean Optics, INC., Duendin, FL, USA) 초분광계의 경우 SIFiFLD 방법으
로 산출된 SIF는 4.7% (760 nm)과 13.8% (687 nm), 그리고 SIFSFM는 4.5% (760 nm)과 6.2% (687 nm)의 산출 에러를 보였다. 이와 같이 687 nm 기반 SIF 자료 품질이 각 두 산출 방법에서 낮은 경향을 보인 것은 Goulas et al.(2017) 결과와도 일치한다. 이렇게 687 nm 기반 SIF에서 760 nm 기반 SIF 보다 낮은 통계값 을 가진 이유는 밴드 특성에 의한 산출 에러 차이 때문 이라고 사료된다.
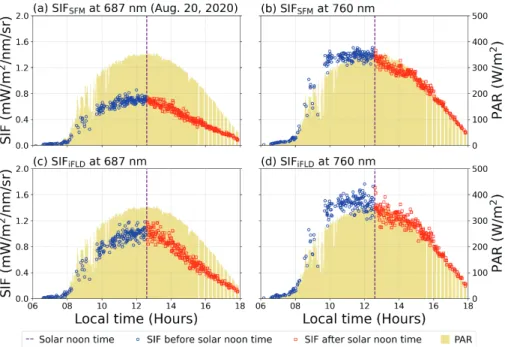
Fig. 3은 2020년 8월 20일(Sunny and closed canopy)에 SIF와 PAR의 하루 동안의 변화를 나타낸 그 래프이며, PAR에 반응하는 SIF의 특징이 나타나 있다. 하지만 SIF의 하루 동안의 변화는 맑은 날과 흐린 날의 태양복사조도 정도, 식생 피복률(Canopy fraction), 식 생의 스트레스 상태에 따라 다르게 반응할 수 있으므 로 분석 시 다양한 환경 조건을 함께 고려하여야 한다.
IV. 품질관리
SIF 자료 품질관리(Quality control, QC)를 위해서 SZA, 광 포화한계, 그리고 관측 순간의 광량 변화 정 도를 이용하여 다음과 같이 SIF 자료를 필터링하였다 Fig. 3. Diurnal changes of sun-induced fluorescence (SIF) and photosynthetically active radiation (PAR) in clear sky condition. (a) SIF at 687 nm retrieved using spectral fitting method (SFM), (b) SIF at 760 nm retrieved using SFM, (c) SIF at 687 nm retrieved using improved Fraunhofer line depth (iFLD), (d) SIF at 760 nm retrieved using iFLD. Blue circle indicates SIF measured before solar noon time and Red square indicates SIF measured after solar noon time.
Table 3. Quality control conditions of SIF data
Description of variable Condition
Solar Zenith Angle <70°
Saturation value; 0 = No saturation and 1 = Saturation 0 Percentage difference between first irradiance measurement and second irradiance measurement 1%
(Table 3). 첫째, SZA이 큰 값(>70°)을 가지는 경우 자료를 필터링 하였다. 이른 아침이나 해질녘은 태양 복사조도를 관측하는 코사인 교정기 표면에 입력되는 태양복사의 각도가 너무 크기 때문에 노이즈가 발생할 수 있다. 둘째, 광 포화한계 이상으로 복사 에너지가 관측된 자료를 필터링 하였다. 매우 짧은 시간 동안 태양광이 급격하게 증가하는 경우는 설정된 노출시간 동안 센서에 입력된 복사 에너지가 포화되어 버린다. 이 경우 측정된 태양복사조도 값은 신뢰할 수 없다. 셋째, 관측 순간 태양광이 급격하게 변화한 경우 필터 링 하였다. 설치한 SIF 관측 기기(제품명: FloX)는 태 양복사조도, 관측 대상의 복사휘도, 그리고 다시 태양 복사조도를 관측하는 순서를 가지는데, 이를 1회 관측 이라고 정의한다. 이때 태양복사조도의 첫번째와 두번 째 관측값 차이가 1%를 초과하는 경우 제외하였다. 이러한 필터링 작업은 저자가 작성한 Python 프로그 래밍 언어를 통해 이루어 졌다. 필터링 코드에는 SIF 값이 음수인 경우를 제외하는 것도 포함되어 있다. 3가지 필터링 조건과 별도로 논에서 식생피복이 덮 이지 않은 경우에 논물(Paddy water)로부터 태양광이 반사되는 태양광 정반사(Sun-glint) 현상이 발생할 수 있으므로 주의해야 한다. Fig. 4는 2020년 6월 15일 SIFSFM at 760 nm의 일 변화를 나타낸 것으로 하루 중 태양의 고도가 가장 높은 시점 전후에 SIF 값이 비정상적으로 급격히 증가한다(Fig. 4(b)). 이는 논물 의 태양광 정반사 영향으로 추정되며, 정오에 관측된 드론 영상에서도 태양광 정반사를 확인할 수 있다(Fig. 4(a)). 따라서 논에서 피복률이 낮을 때에는 SIF 관측 자료에서 태양광 정반사 영향을 주의 깊게 살펴봐야 한다. 태양광 정반사 영향은 태양고도, 지표상태, 그리 고 센서의 각도에 따라서 상이할 것이며, 본 연구에서 는 이러한 영향을 최소화하기 위해 SZA<20° 조건에 서 자료를 필터링하였다. Github에 업로드된 파일은 앞서 소개한 필터링 방 법으로 품질 관리된 SIF 자료이며, 태양광 정반사 영 향을 받은 것으로 보이는 자료는 제거되었다. 2020년 7월 7일, 8월 5일, 8월 19일 자료는 파일 집록 문제로 존재하지 않으며, 8월 10일 오후∼8월 14일 오전은 과전류로 인해 기기 내 퓨즈가 끊어져 관측 자료가 존재하지 않는다. 다양한 기상 조건과 각 생육 단계별 지표 상태에서 고품질의 SIF 자료 획득을 위해 1.5주 간격으로 현장을 점검하는 등의 집중 관리를 하였으나 태생적인 관측 에러 및 노이즈가 포함될 수 있다. 따라 서 1∼2분 간격의 원자료(Raw data)가 아닌 30분, 한 시간, 하루 간격의 자료로 평균하여 연구 목적에 맞춰 사용할 것을 권장한다.
적 요
원격탐사 기법을 이용하여 산출된 태양 유도 엽록 소 형광(Sun-Induced Fluorescence, SIF)을 통해 식생 의 광합성 효율 및 스트레스 상태를 이해하기 위한 노력이 세계적으로 진행되고 있다. 최근 SIF 관측을 위한 광학 기기 개발과 SIF 산출 방법론이 정립되고 Fig. 4. Sun glint impact for optical measurements. (a) Relationship between solar zenith angle (SZA) and a spectral fitting method (SFM)-based sun-induced fluorescence (SIF) on June 15, 2020. The inserted image is near-infrared band-based sun glint picture captured from a drone. (b) Diurnal changes of SIF and photosynthetically active radiation (PAR). Blue circle indicates SIF measured before solar noon time and Red square indicates SIF measured after solar noon time. ‘EC’ is an abbreviation of ‘Eddy Covariance’.있으나 아직 국내에서는 SIF 관측이 드물며 관측 자료 의 수도 적다. 본고에서는 나주에서 2020년 6월 10일 부터 2020년 10월 5일까지 벼 생육기간 동안 광학 기 기를 이용하여 관측된 SIF 자료를 공개하였다. SFM 방법과 iFLD 방법으로 O2A과 O2B 흡수 대역의 SIF를
산출하였으며, 광합성 유효 복사량에 대한 정보도 제 공하였다. 또한, 태양천정각, 센서의 광 포화상태, 관 측 순간의 태양광의 급격한 변화, 태양광 정반사 영향 등을 고려하여 품질이 낮은 SIF 자료를 필터링하였다. 본 자료를 통해 연구자들이 SIF에 대한 이해를 높이고, 제안된 SIF 자료 필터링 방법으로 SIF 산출물 품질관 리에 도움이 될 것으로 기대한다.
감사의 글
이 논문은 기상청의 기상⋅지진See⋅At기술개발연 구(KMI2018-05510)의 지원을 받아 수행되었으며, 이 에 감사 드립니다.REFERENCES
Alonso, L., L. Gomez-Chova, J. Vila-Frances, J. Amoros-Lopez, L. Guanter, J. Calpe, and J. More- no, 2008: Improved fraunhofer line discrimination method for vegetation fluorescence quantification. IEEE Geoscience and Remote Sensing Letters 5 (4), 620–624.
Cendrero-Mateo, M. P., S. Wieneke, A. Damm, L. Alonso, F. Pinto, J. Moreno, L. Guanter, M. Celesti, M. Rossini, N. Sabater, S. Cogliati, T. Julitta, U. Rascher, Y. Goulas, H. Aasen, J. Pacheco-Labrador, and A. M. Arthur, 2019: Sun- induced chlorophyll fluorescence III: Benchmarking retrieval methods and sensor characteristics for proximal sensing. Remote Sensing 11(8), 962pp. Cogliati, S., W. Verhoef, S. Kraft, N. Sabater, L.
Alonso, J. Vicent, J. Moreno, M. Drusch, and R.
Colombo, 2015: Retrieval of sun-induced fluore- scence using advanced spectral fitting methods. Remote Sensing of Environment 169, 344–357. Guanter, L., Y. Zhang, M. Jung, J. Joiner, M. Voigt,
J. A. Berry, C. Frankenberg, A. R. Huete, P. Zarco-Tejada, J.-E. Lee, M. S. Moran, G. Ponce-Campos, C. Beer, G. Camps-Valls, N. Buchmann, D. Gianelle, K. Klumpp, A. Cescatti, J. M. Baker, and M. S. Moran, 2014: Global and time-resolved monitoring of crop photosynthesis with chlorophyll fluorescence. Proceedings of the National Academy of Sciences 111(14), E1327- E1333.
Goulas, Y., A. Fournier, F. Daumard, S. Champagne, A. Ounis, O. Marloie, I. Moya, 2017: Gross primary production of a wheat canopy relates stronger to far red than to red solar-induced chlorophyll fluorescence. Remote Sensing 9(1), 97. Hong, J. Y., C. S. Shim, M. J. Lee, G. H. Baek,
W. K. Song, S. W. Jeon, and Y. H. Park, 2011: Net primary production changes over Korea and climate factors. Korean Journal of Remote Sensing 27(4), 467-480.
Julitta, T., L. Corp, M. Rossini, A. Burkart, S. Cogliati, N. Davies, M. Hom, A. Mac Arthur, E. M. Middleton, U. Rascher, A. Schickling, and R. Colombo, 2016: Comparison of sun-induced chlo- rophyll fluorescence estimates obtained from four portable field spectroradiometers. Remote Sensing 8(2), 122.
Lee, B., E. Kim, J. H. Lim, M. Kang, and J. Kim, 2019: Application of machine learning algorithm and remote-sensed data to estimate forest gross primary production at multi-sites level. Korean Journal of Remote Sensing 35(6_2), 1117-1132. Sun, M., C. H. Cho, Y. Kim, J. Lee, K. O. Boo,
and Y. H. Byun, 2017: Response of the terrestrial carbon exchange to the climate variability. Atmosphere 27(2), 163-175.