2-2 / H.J. Lee
• IMID 2009 DIGEST Abstract
A hybrid model has been developed which adopts a fluid model for electrons and a particle-in-cell (PIC) model for ions. Using the hybrid simulation, the discharge characteristics are investigated with the diagnostics for the electric field and the wall charge profile, density distributions of charged and excited particles, distributions of ultraviolet lights on phosphor, and the visible lights emitted from the PDP cell. Also, energy and angle distributions of the ions at the MgO protective layer are obtained for the analysis of material effect. The comparison of hybrid simulation results with experimental results as well as that with the conventional fluid simulation shows that the new model is more adequate for the simulation of PDP cells.
1. Introduction
Numerical simulation is a very useful tool to investigate discharge phenomena in a plasma display panel (PDP) cell. Among many simulation methods, particle-in-cell (PIC) simulation is most accurate, because PIC simulation has less approximation than other simulation methods. However, its computation cost is too heavy; it takes too long time to reach a steady state. For example, in case of XOOPIC code developed by UC Berkley group [1], it takes one month for two-pulse simulation. So, fluid simulation is normally used to observe the inside physics of a PDP cell. Fluid simulation consists of three governing equations, the continuity equation, the momentum conservation equation, and Poisson’s equation.
In high pressure regime, drift-diffusion approximation is used instead of full momentum conservation equation. Also, energy equation is not solved but local field approximation is used. Equation (1) is changed like Eq. (2), when drift diffusion approximation is applied to the momentum equation.
This approximation is right on the condition of high pressure gas discharge, especially, the lamp discharge
at the steady state. However, an AC-PDP is somewhat different from a steady state lamp discharge. PDP uses
micro pulse waveforms for getting a high luminance and adjusting gray levels. Thus, the ions motions are seldom at a steady state during the operation time.
u mn T nk qnE dt du mn = −∇( B )− νm (1) nE q n Di i i i =− ∇ +sgn( )μ Γ (2)
In the next section, we explain whether drift diffusion approximation is reasonable or not in a PDP simulation and show the hybrid simulation results compared with fluid simulation result.
2. Results and discussion
We investigated the saturation time of particles using a 0-D particle code in order to find out the adequacy of the drift diffusion approximation in a fluid simulation. In the 0-D particle code, only velocity domain is simulated under a constant electric field applied to the plasma particles such as electrons, Ne and Xe ions which has Maxwellian distribution initially. Due to the collisions with neutrals, the steady state velocity distribution function and mean energy are changed with the applied electric field, and we measured the saturation time. After getting a new distribution function, we increase the applied electric field slightly, and measure the saturation time again. By doing this, it is possible to measure the saturation time for the electron and the ion motions. If this saturation time is longer than the time step used in the simulation, drift diffusion approximation can not be used. In a fluid simulation, time step is normally tens or hundreds of pico seconds.
In Fig 1 (a), the saturation time of electrons is a few tens of pico seconds which becomes shorter as electric field becomes larger. The saturation time of electrons is almost similar to the time step of fluid simulation.
Analysis of luminous efficacy of a PDP cell using a hybrid simulation with an electron-fluid and ion-particle model
Hae June Lee, Seung Bo Shim, In Cheol Song, Ho-Jun Lee and Chung-Hoo Park
Dept. Of Electrical Engineering, Pusan National University, Pusan 609-735, Korea Tel.:82-51-510-3516, E-mail: [email protected]
2-2 / H.J. Lee
IMID 2009 DIGEST •
Thus, electrons do not have any problem to adopt the drift diffusion approximation in a fluid simulation. However, the saturation time of ions, as shown in Fig 1(b), is long. For Ne ions, it is a few nano seonds. This time does not change much although electric field is changed. In the case of Ne ions, the drift-diffusion approximation is not proper because Ion motion can not reach the steady state in one time step. In the case of Xe ions, it is more serious because it is heavier than Ne ions. It takes more time for Xe ions to reach the steady state than Ne ions. Therefore, the ion motion in the fluid simulation is not accurate if we use drift diffusion approximation. Ion motion is overestimated in the drift-diffusion approximation. Discharge occurs in a shorter time than that measured in experiment result. Especially, with high Xe contents, this problem is more serious, because the number of Xe ions increases in the PDP cell. Thus, ion motions need to be solved by particle in cell (PIC) simulation.
(a)
(b)
Fig. 1. 0-D Particle simulation results for the saturation times of (a) electrons, (b) Ne ions
Fig 2 is the flow chart of the hybrid simulation model suggested in this study. It is based on the previous fluid code [2-5]. We do not solve all of ion motions because of the limited ollision cross section
data. Particle in cell and Monte carlo collision
(PIC-MCC) method is used for Ne+ ion and Xe+ motion.
The rest of charged particles and excited particles are calculated using fluid simulation. In PIC–MCC
simulation for Ne+ ion and Xe+, at first, existing
particles in the PDP cell have the velocity described by Eq. (3) according to the electric field intensity,
t m qE v
v= 0 + Δ . (3)
Next, handle the particles which cross the boundary. Particles are weighted to each grid in order to calculate the density of ions. We consider charge exchange collision (CX) and elastic scattering collision (SC) between Ne and Xe ions.
Fig. 2. Flow chart of a hybrid simulation
2-2 / H.J. Lee
• IMID 2009 DIGEST
Figure 3 shows the simulation domain and the applied waveforms. The cell size is the same as that of 50 inch FHD pixels. 500 Torr, Ne based Xe 10% gas are used.
(a) (b) (c)
Fig. 4. Density of charged particles in the hybrid
simulation for (a) electrons (b) Ne+, and (c) Xe+
(a) (b) (c)
Fig. 5. Density of charged particle in a fluid simulation for (a) electrons (b) Ne+ (c) Xe+.
One pulse with a voltage of 250 V is given for the ignition of the discharge, and the sustain voltage of 220 V is given continuously at 50 KHz, with a duty ratio of 50%. The address electrode is biased by half applied voltage at the sustain voltage.
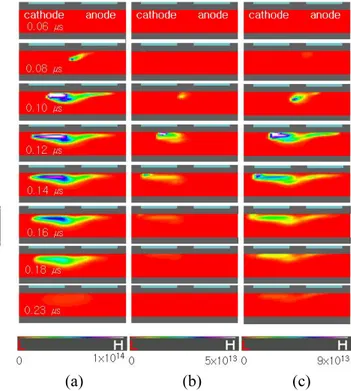
Figures 4 and 5 show the density distribution of the charged particles. Fig. 4 is from the hybrid simulation and Fig. 5 is from the fluid simulation. A discharge begins at the anode edge and spreads to the cathode region. Ne ions almost do not exist on the anode region. The tendency of discharge process is almost the same between the fluid and the hybrid simulations. However, the particle motion of the hybrid simulation is much slower than that of the fluid simulation.
Figure 6 shows the density of Xe**. In experiment, an IR image using ICCD is used in order to observe discharge phenomena indirectly. Its total emitting time is 240 ns. In the simulation, we estimates IR emission time using density of Xe** particles. In fluid code, it is about 80 ns. It is very shorter than experimental results. However, in hybrid simulation, the total time for the Xe** state is 150 ns. It is longer than that of fluid code almost twice, although it is still shorter than experiment.
(a) (b)
Fig. 6. Shown are the time evolution of the density of Xe** particles for (a) hybrid simulation, and (b) a fluid simulation.
2-2 / H.J. Lee
IMID 2009 DIGEST •
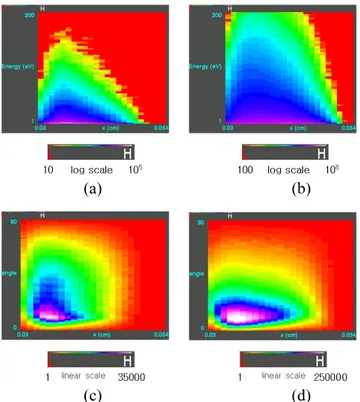
Figure 7 shows energy and angle distribution function of the ions impinging on the cathode surface. Using this data, we can estimate the reaction between ions and MgO on the surface. Secondary electron emission coefficient (SEEC) is affected by the ion energy distribution function (IEDF) and the ion angle distribution function (IADF) of the incident ions. As of now, SEEC was set constant in our code, but we can change SEEC as a function of energy and angle using this energy and angle data.
(a) (b)
(c) (d)
Fig. 7. IEDF, IADF of hybrid simulation (a) IEDF
of Ne+ (b) IEDF of Xe+ (c) IADF of Ne+ (d) IADF of
Xe+
4. Summary
The drift-diffusion approximation in a fluid simulation is not suitable for heavy ions to simulate pulse-driven discharges even in a high pressure. In our
hybrid simulation, Ne+ and Xe+ are calculated with
particle-in-cell and Monte Carlo collision (PIC-MCC) method. The time of light emission becomes longer in the hybrid simulation than that of a fluid simulation, which agrees well with experiments. Using a hybrid simulation, energy and angle distributions can be obtained on the boundary. Using IEDF and IADF, We can get a erosion data on the MgO surface.
Acknowledgement
This research was supported by LG electronics, Co.
5. References
1. J.P. Verboncoeur, A.B. Langdon, and N.T.Gladd: Computer physics communication 87 (1995) pp.199
2. Young Kyo Shin, Chae Hwa Shon, Woong Kim, and Jae Koo Lee: IEEE Trans. on Plasma Sci., 27, 5 (1999) pp.1366
3. Hae June Lee, Hyun Chul Kim, Sung Soo Yang, and Jae Koo Lee: Phys. Plasmas, 9, 6 (2002) pp.2822
4. S. S. Yang, S. M. Lee, F Iza, and J K Lee: J. Phys. D: Appl. Phys. 39 (2006) pp.2775
5. H.C. Kim, M.S. Hur, S.S. Yang, S.W. Shin, and J.K. Lee : J. Appl. Phys. 91, 12 (2002) pp.9513
![Fig 2 is the flow chart of the hybrid simulation model suggested in this study. It is based on the previous fluid code [2-5]](https://thumb-ap.123doks.com/thumbv2/123dokinfo/4874987.33615/2.892.97.394.528.999/chart-hybrid-simulation-model-suggested-study-based-previous.webp)