P1-61 / H.-W. Nam
IMID 2009 DIGEST •
Abstract
In this paper, we proposed fence electrode structures. The experimental structures change cross-bar length as 145,105, 65 and 30 µmto improve the electro-optical characteristics. The proposed structures improve the addressing time and luminous efficacy compared with the T145 structure which has the cross-bar length of 145µm as the reference. Especially, in the case of the T30 structure with cross-bar length of 30µm, it gains lower power consumption by 34%, and higher luminous efficacy by 20% than those of the reference structure.
1. Introduction
Many display devices including PDP, LCD, DLP, CRT, and OLED are competing each other in the large-sized home TV market to become a market leader. AC PDPs have recently achieved good performance and their image quality can compete with
that of cathode ray tubes (CRTs) and LCD. [1, 2] However, the improvement of luminous efficacy,
image quality, and cost-reduction is still necessary to compete with display devices. [3, 4, 5] Currently, in order to solve the problems, many researches on improvement of luminous efficacy, such as new designs of cell geometry, new driving techniques and optimization of discharge gas composition, have been intensively studied for several years.
In this study, in order to improve the electro-optical characteristics of AC PDP, the new proposed fence structuresinstead of ITO are suggested and fabricated in 4-inch test panel which is applied for a Xe15% content gas mixture. Compared with the reference structure, the electro-optical characteristics are measured from the test panel.
.
2. Experimental
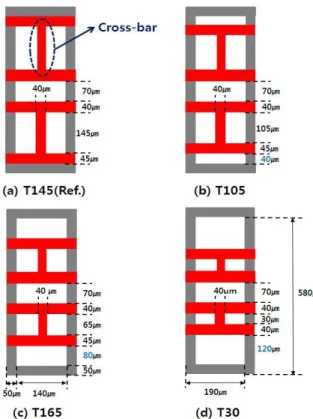
Figure 1. The proposed fence electrode structures are shown for (a) fence structure with cross-bar length of 145 µm(Ref.), (b) with cross-bar length of 105 µm, (c) with cross-bar length of 65 µm, and (d) with cross-bar length of 30 µm
Fig. 1 shows the experimental structures in 50-inch AC-PDP with FHD resolution. Fig. 1 (a) shows the
Effect of Cross-bar Length on Luminous Efficacy in AC-PDP
with Fence Electrode Stricture
Hyung-Woo Nam*, Yong-Suk Choi, Hyo-won Bae ,Yun-gi Kim, Jung-Woo
Ok, Dong-Hyun Kim, Ho-Jun Lee, Hae June Lee, Chung-Hoo Park
Department of Electrical Engineering, Busan National University, Busan, Korea Tel.:82-51-510-1544, E-mail: [email protected]
P1-61 / H.-W. Nam
• IMID 2009 DIGEST
T145 structure which has cross-bar length of 145µm. This structure is adopted as the reference structure. Fig. 1 (b), (c) and (d) show the top view of the proposed fence electrode structures.
A vertical pitch of the one cell is 580µm and its horizontal pitch is 190µm. The ribs are formed in the shape of a box with its width of 50µm. The discharge gap is fixed as 70 µm and the cross-bar length is varied as 105, 65, and 30 µm. The discharge gas condition is 15% of a Xe concentration in Ne gas. The new proposed fence structures are fabricated in 4-inch
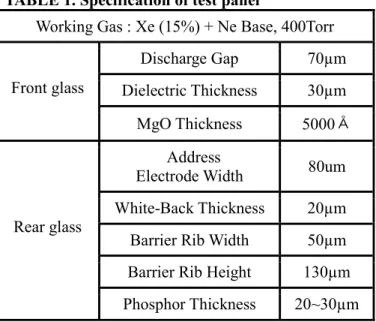
test panel and evaluated the experiment. [6, 7] Table 1. shows the specification of the test panel with
the proposed structure.
TABLE 1. Specification of test panel
Working Gas : Xe (15%) + Ne Base, 400Torr Discharge Gap 70µm Dielectric Thickness 30µm Front glass
MgO Thickness 5000Å Address
Electrode Width 80um White-Back Thickness 20µm Barrier Rib Width 50µm Barrier Rib Height 130µm Rear glass
Phosphor Thickness 20~30µm
The electro-optical characteristics of the test panel were measured in terms of firing voltage, sustain voltage and memory coefficients. The frequency of sustain pulse is 25 kHz. In addition, the IR images are taken by ICCD high-speed camera and the discharge time lag is measured using ADS driving circuit.
3. Results and discussion
3-1. Luminance and power consumption characteristic The luminance characteristic of the reference and proposed structure is shown in Fig. 2. Compared with the reference structure, the luminance of T105, T65 and T30 are relatively lower by 8%, 14% and 20%, respectively. As the discharge is started, the plasma density is distributed along the area of the electrode. Thus, the long cross-bar in length is more efficient for
the discharge. [8] In the case of T145 structure with the longest cross-bar length, the luminance is higher than those of all the suggested structures. It can be concluded that the cross-bar length is closely related to luminance increase.[8]
Figure 2. Luminance characteristic of the reference and proposed structures
Figure 3. Power Consumption of the reference and proposed structures
Fig. 3 shows the experimental data for the reference and proposed structures with respect to the sustain voltage. In the case of 260V of the sustain voltage, the power consumption of the T105, T65 and T30 structure is improved, compared with the reference structure. When the cross-bar length is decreased, the electrode area is decreased and therefore, the lower power consumption is obtained in the same voltage. As a result, the power consumption of T120 structure
190 200 210 220 230 240 250 260 270 280 0 200 400 600 800 1000 1200 1400 1600 1800 2000 Lum inanc e
[
cd /m 2]
Voltage[V] T145 T105 T65 T30 190 200 210 220 230 240 250 260 270 280 0.0 0.4 0.8 1.2 1.6 2.0 2.4 2.8 3.2 Po wer[W] Voltage[V] T145 T105 T65 T30P1-61 / H.-W. Nam
IMID 2009 DIGEST • has the lowest value of all proposed structures. The
decrement of the power consumption is caused by decreasing the electrode area.
3-2. Luminous efficacy characteristic
Fig. 4 shows the luminous efficacy of the reference and proposed structures. The luminous efficacy of T105 and the reference structure are almost the same, and the T65 and T30 structure are higher than that of the reference. Especially, in the case of T30, the luminous Efficacy is improved by 20%, compared with the reference structure at the same voltage.
Figure 4. Luminous Efficacy of the reference and proposed structures
3-3. The discharge time lag in addressing period and ICCD images
The discharge time lag of the reference and proposed structures is shown in Fig. 5. The applied addressing voltage is 100V and the sustain voltage is 231V. In this figure, T65 and T30 structures have almost the same formative time lag which is the shortest one of all the structures. On the other hand, the statistical time lag of the reference structure is shorter than those of T105, T65, and T30 structures. In the case of T105, T65 and T30 structure, the total time lag is almost same and shorter than that of the reference structure. As a result, the proposed structures improve the discharge time lag compared with the reference structure.
Figures 5. The discharge time lag of the reference and proposed structures
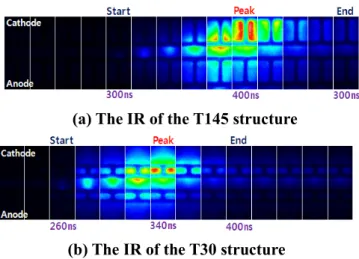
(a) The IR of the T145 structure
(b) The IR of the T30 structure
Figure 6. The IR image of the suggested structures. Fig. 6 shows the ICCD images of discharge propagation of T145 and T30 structures in one cell. These images are measured by using an intensified CCD camera. Experimental conditions are sustain voltage 260V and gate delay time 20ns. In this figure, the discharge is started near the edge of the anode. After avalanche breakdown, the discharge is spreading along the cross-bar and then strong emission is found in the cathode region. Under the same condition, the discharge start time of T145 structure is delayed by 40ns but discharge duration time measured from initiating discharge point to peak discharge point is longer than that of T30 structure.
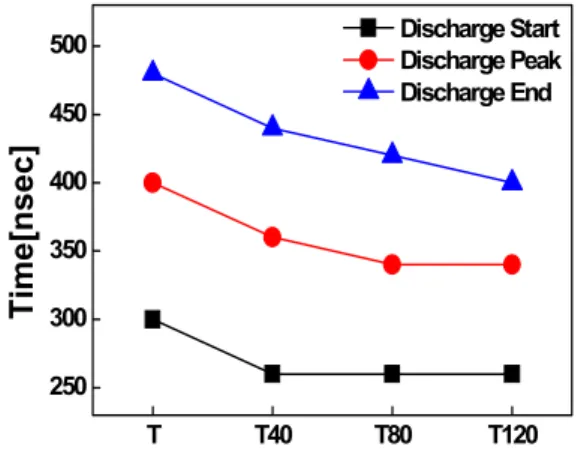
Fig. 7 shows the discharge time of the reference and the proposed structures. When the cross-bar length is decreased, the discharge time gets fast. On the other hand, discharge duration time is shorter than that of the reference structure.
190 200 210 220 230 240 250 260 270 280 0.0 0.4 0.8 1.2 1.6 2.0 2.4 2.8 3.2 L u m ino u s E ffi ca cy [lm /W ] Voltage[V] T145 T105 T65 T30
P1-61 / H.-W. Nam
• IMID 2009 DIGEST
Figure 7. Discharge time of the reference and proposed structures
4. Summary
In this work, new fence electrode structures with three different cross-bar lengths are suggested. The electro-optical and addressing time characteristics of the proposed structures are compared with the reference structure. As a result, in the case of T30 structure, the luminous efficacy is about 20% higher than that of the reference structure and the addressing time is the fastest of all the proposed fence structures. Consequently, the shorter cross bar length is improved in the luminous efficacy and the addressing time, compared with the reference structure.
5. References
1. L.F. Weber, SID, Vol. 16, no. 12, pp. 16–20 (2000)
2. T.Kurita, H.Murakami, SID’00 Digest,pp70-73 (2000)
3. C.H. Park et al, IEEE Tran.Plasma Science, Vol. 48, no. 6,pp. 1082-1086 (2001)
4. J.W. Ok, Appl.Phys.Lett., Vol. 89, p.11181501 (2006)
5. M.Sawa at el, SID’99 Digest, pp284-289 (1999) 6. T.Akiyama et al, Journal of the SID 16/8,
pp835-844(2008)
7. N.Kosugi et al, IMID’08DIGEST, pp57-60 (2008) 8. I.C.Song et al, IMID’08DIGEST, pp404-407 (2008)
T T40 T80 T120 250 300 350 400 450 500 T ime[n sec ] Discharge Start Discharge Peak Discharge End