Evolutionary Bioinformatics 2013:9 251–261
doi: 10.4137/EBO.S12160
This article is available from http://www.la-press.com.
© the author(s), publisher and licensee Libertas Academica Ltd.
This is an open access article published under the Creative Commons CC-BY-NC 3.0 license.
Open Access
Full open access to this and thousands of other papers at
http://www.la-press.com. O r i g i N A L r E S E A r C h
effective encoding for DnA sequence Visualization Based
on nucleotide’s Ring structure
A.T.M. golam Bari1, Mst. rokeya reaz1, A.K.M. Tauhidul islam1, ho-Jin Choi2 and Byeong-Soo Jeong1 1Department of Computer Engineering, Kyung hee University, gyeonggi-do, Yongin-si, republic of Korea. 2Department of
Computer Science, Daejeon, KAiST, republic of Korea.
Corresponding authors email: [email protected]; [email protected]; [email protected]; [email protected]; [email protected]
Abstract: Effective representation of DNA sequences is one of the important tasks in the study of genome sequences. In this paper, we
propose a graphical representation of DNA sequences based on nucleotide ring structure. In the proposed representation, we convert DNA sequences into 16 dinucleotides on the surface of the hexagon so that it can preserve nucleotide’s chemical property and positional information. Our approach can provide capability of efficient similarity comparison between DNA sequences and also high comparison accuracy. Furthermore, our approach satisfies uniqueness and no degeneracy of DNA sequences. In the experimental study, we use phy-logeny analysis for evolutionary relationship among different species. Extensive performance study shows that the proposed method can give better performance than existing methods in comparison with the degree of similarity.
Introduction
The rapid growth of biological sequences, such as of DNA, RNA, and protein, has demanded effec-tive analysis methods for large biological sequences. Additionally, the analysis results are very helpful to biological researchers for predicting genes’ struc-ture and function, as well as similarity comparison between genes and different species.
For biological sequence analysis, two approaches have been mainly used: (i) sequence alignment method and (ii) non-sequence alignment method. The first approach obtains a degree of similarity between DNA sequences by comparing alignment scores of two sequences. This approach suffers from expen-sive computational cost as the length of sequences grows exponentially. The second approach analyzes DNA sequences by establishing a statistical model or a graphical representation model, or some machine learning model of DNA sequences. Recently, this approach is popularly studied due to the fact that it can give better accuracy and low computational overhead.
In the case of non-sequence alignment method, effective DNA sequence representation or feature selection from DNA sequences is essential for DNA sequence analysis, in areas such as gene prediction, similarity comparison between genes of different species, and finding gene structure and function. For this purpose, several graphical representations have been proposed according to chemical structures of 4 nucleotides, reflecting their distribution with different chemical structure and allowing numerical characterization. As for feature selection, several machine learning techniques are effectively applied such as principal component analysis (PCA), neural network, and several classification models.
In this paper, we propose a graphical represen-tation of DNA sequences based on nucleotide ring structure. In the proposed representation, we convert DNA sequences into 16 dinucleotides on the sur-face of the hexagon so that the nucleotide’s chemi-cal property and positional information is preserved. Our approach satisfies uniqueness and no degeneracy of DNA sequence is observed. It can also provide capability of efficient similarity comparison between DNA sequences in addition to high comparison accu-racy. Extensive performance study shows that the proposed method can give better performance than
existing methods in comparison with the degree of similarity.
Related Works
Graphical technique of DNA sequences was first initiated by Hamori and Ruskin.1 Afterwards, many
advances in 2D,2–5,14,15 3D,6,7 4D,8 5D,9 and 6D10
rep-resentations of DNA sequences were developed. In this type of graphical presentation, nucleotides, dinucleotides, or tri-nucleotides are given a Car-tesian coordinate in 2D through to 6D. Then DNA sequences are mapped into a set of Cartesian points and are plotted.
Additionally, there is some research which compares DNA sequences based on several mathematical invariants. For example, Wu et al11
proposed 10 correlation factors: 4 mononucleotide and 6 dinucleotide factors. Qi et al12 proposed a graph
theory based representation for DNA sequences recently. Word-based measure13 is one of the most
widely used alignment-free approaches for sequence comparison where each sequence is mapped into an n-dimensional vector according to its k-word frequencies/probabilities. Randić et al14,15 have
con-sidered kinds of condensed matrices. Genomic rules are proposed by Castro-Chavez21 to compare
biologi-cal sequences and to find compatible genomes. The classic circular genetic code is used to present the practical aspect of the code rules of variation.
Castro-Chavez22,23 proposed natural patterns of
symmetry and periodicity for tetrahedral representa-tion of the genetic code. The method is applied to defragged I Ching genetic code and compared to Nirenbeg’s 16 × 4 codon table. Those two properties (ie, symmetry and periodicity) act as the harmony between the chosen geometry and the biological reality. Graphical representation of DNA sequences based on mono, di, trinucleotides, etc. need to con-sider this harmony. Otherwise, it would merely be an instance of displaying the nucleotides (eg, mono-nucleotide, dimono-nucleotide, codon) which have little biological sense.
When representing DNA sequences graphically, it must be ensured that there is no loss of information due to overlapping, loop, etc. and that the conversion from DNA sequence to graph and graph to DNA sequence should be one to one. However, some representa-tions do not meet these criteria. Therefore, a graphical
representation containing uniqueness and no degen-eracy is another contribution in the era of DNA sequence visualization.
On the other hand, methods which are based on non-graphical representation must also ensure that no information is lost. If not, the result would be compat-ible but not precise with other methods that have no loss in conversion. In this paper, we converted DNA sequences into DNA curves without any loss of infor-mation and degeneracy.
DnA sequence Visualization
by Hexagonal structure
Chemical structure and classification
of DNA bases
As stated previously, DNA sequences are the strings of four bases, that is, A, T, C and G. The core of these bases is heterocyclic organic compound, which forms ring in their chemical structure. Of them purines (A and G) have two rings while pyrimidines (C and T) have one. The chemical ring structures of those four bases are depicted in Figure 1.
The element of these cycles are carbon and nitro-gen, hydrogen and oxygen. In Figure 1, sky balls are carbon and blue balls are nitrogen. The hexagonal cycle has nitrogen in positions 1 and 3, and carbon in positions 2, 4, 5, and 6. Other than carbon and nitro-gen, the bases have oxygen and hydrogen bonded with carbon and nitrogen in different number. Hence, the bases differ in molecular weight. The molecular weight of A, T, C and G are 135.13, 112.1, 111.1 and 151.13 respectively. Their ascending order in terms of molecular weight is C→T→A→G.
The bases also differ by heterogenic cycle, func-tionality, and their bonding with hydrogen. A and C fall into the amino category while G and T are in the keto group, based on their functionality. A and T are bonded by three hydrogen bonds, and hence are in strong-H group while G and C are in weak-H group as they are bonded by only two hydrogen bonds.
Proposed DNA encoding
The proposed encoding of dinucleotides for DNA sequence visualization is solely based on ring struc-ture of DNA bases and their molecular weight. The bases are paired to make dinucleotides in such a way that their ascending/descending order in terms of molecular weight remains intact. The dinucleotides are placed on the 6 end of the heterocyclic hexagon as well as at the midpoint of each arm of the hexagon. The six dinucleotides which are placed on the 6 ends of the hexagon are in ascending order. The midpoint dinucleotides are positioned by descending order of molecular weight.
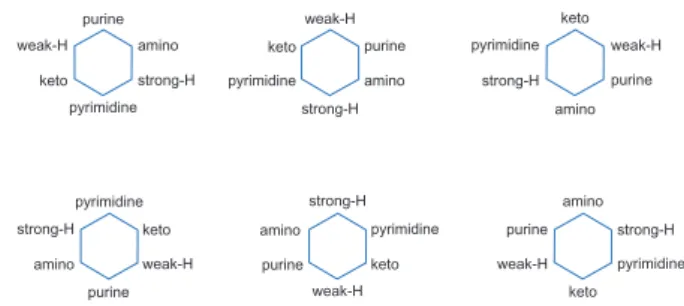
We place six ordered dinucleotides on opposite ends of the heterogenic cycle. The opposite ends are 1–4, 2–5, and 3–6. Any class (purine, pyrimidine; amino, keto; strong-H, weak-H) can be positioned at either end of the hexagon. Therefore, there are six possible combinations, as shown in Figure 2. The names of these combinations are Cycle 1, Cycle 2, Cycle 3, Cycle 4, Cycle 5, and Cycle 6 respectively.
In Cycle 1, purines and pyrimidines are positioned at ends 1 and 4 of the hexagon respectively. A and G, the purines, form two dinucleotides: AG and GA. We keep AG on end 1 as it retains the sequence C→T→A→G. For the same reason, CT are placed on end 4, and CA (amino) and TG (keto) are placed on the 2 and 5 ends, respectively, and CG (strong-H) and TA (weak-H) are positioned on the 3 and 6 ends of the hexagon, respectively.
Conversely, midpoint of 2–3, 3–4 and 4–5 arms are determined by the following rule: take the uncommon nucleotides and form a dinucleotide with them such that descending order (G→A→T→C) of molecular weight prevails. As for example, the midpoint of 2–3 arms is GA because the commonality between CA and CG is C. So, G and A are uncommon. This rule is
a) Adenine(A) b) Thymine (T) c) Guanine (G) d)Cytosine (C) Figure 1. heterogenic cycle of four bases.
purine purine purine purine purine purine weak-H weak-H weak-H weak-H weak-H weak-H keto keto keto keto keto keto pyrimidine pyrimidine pyrimidine pyrimidine pyrimidine pyrimidine strong-H strong-H strong-H strong-H strong-H strong-H amino amino amino amino amino amino
different for the midpoint of 5–6, 6–1 and 1–2 arms: take the common nucleotide as well as the other which is not available on both ends. For example, the midpoint of 5–6 arms is TC because T is common between TA and TG, while C is neither in TA nor in TG. We follow these simple rules to position the 12 dinucleotides on the hexagon (six dinucleotide on six ends + six dinucleotide on midpoint of each arm of the hexagon). Based on the above discussions, Cycle 1 is drawn in the 2D Cartesian space, shown in Figure 3.
From Figure 3, we can derive the set of position coordinates of 16 dinucleotide: (0, 1.5) → AG, (0.5, 1.25) → AT, (1, 1) → CA, (1, 0) → GA, (1, -1) →
CG, (0.5, -1.25) → GT, (0, -1.5) → CT, (-0.5, -1.25) → GC, (-1, -1) → TG, (-1, 0) → TC, (-1, 1) → TA, (-0.5, 1.25) → AC, (0, 1) → AA, (-0.5, 0) → CC, (-1, 0) → GG, (0.5, 0) → TT.
Let S = {s1, s2, …, sN} be a DNA sequence where si ∈∑ = {A, T, C, G} and i = 1, 2, 3, …, N. S is mapped into a series of points P1, P2, …, PN-1. We introduce a map function φ such that S can be formulated as S = φ(sisi+1)φ(si+1si+2) … φ(sN-1sN) where,
Pi = ϕ (si si+1, i) = ϕ (xi, yi, i)
=ϕ (xsisi+1, ysisi+1, i), i 1, 2, 3, , N-1= ... xsisi+1, ys si i+1 and i represent the x-coordinate,
y- coordinate, and z-coordinate respectively. Thus, we connect the N-1 points from the first one and derive a 3D curve.
To locate the local and global features of the 3D curve as well as to visualize the 3D representation of this curve, we take another numerical representation. Let Xi =k 1= x , Yk i =k 1= yk
i i
∑ ∑ , we derive another mapping function for cumulative feature of the 3D curve such that
( )
s si i+1 (X ,Y , i), where i 1, 2, 3, ..., N-1.i iλ = =
Connecting N-1 points from the first one, we get the proposed novel 3D zigzag curve.
AC 1 Y AG(0,15) TT(0.5,0) (0,0) GG CC AA AT CA (1,1) 2 6 5 3 4 X GA(1,0) CT(0,−1.5) CG(1,−1) TG(−1,1) TC(−1,0) TA(−1,1) GT GC
Figure 3. Cartesian coordinates of 16 dinucleotide in a hexagon.
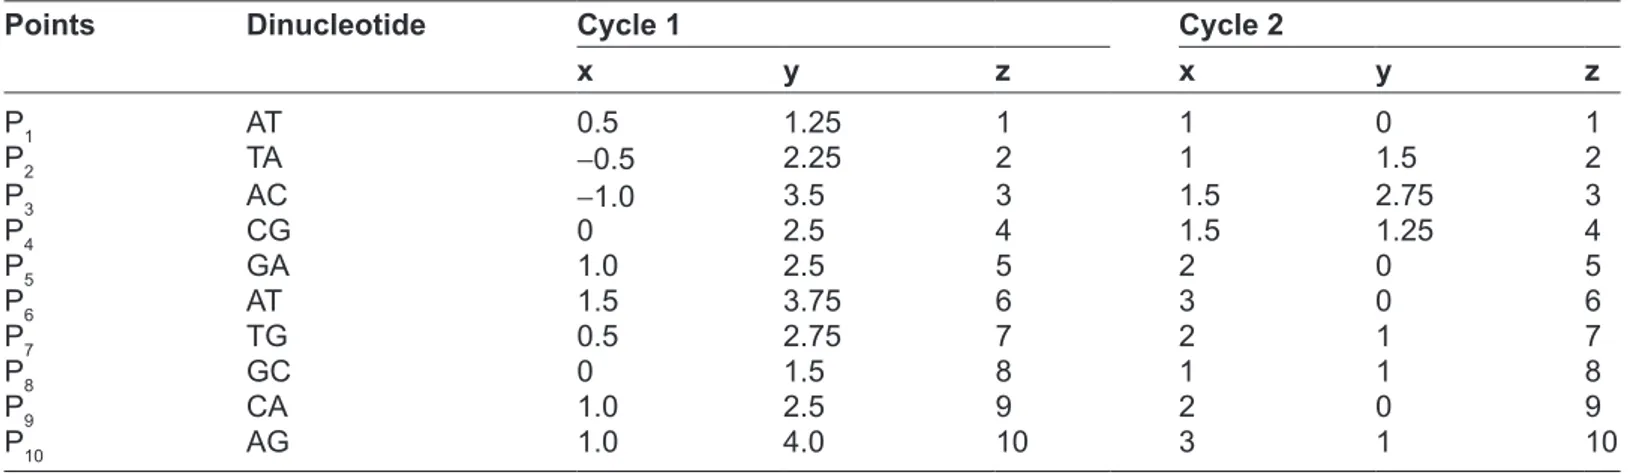
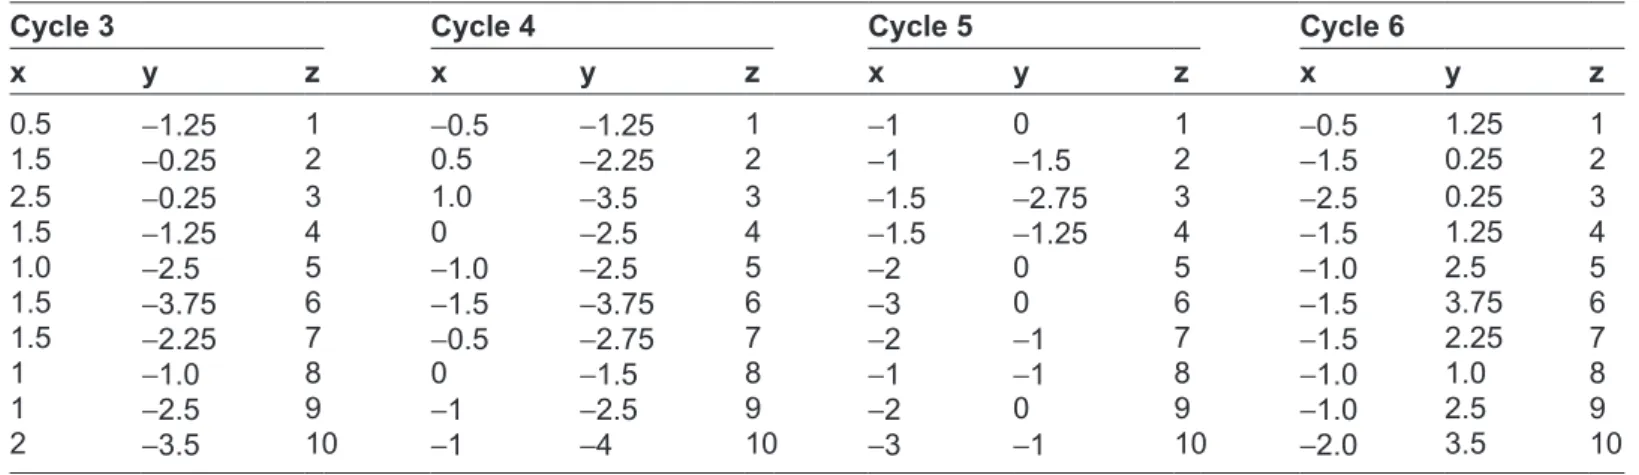
Table 1. 3D coordinates of ATACgATgCAg based on the proposed method.
points Dinucleotide cycle 1 cycle 2 cycle 3 cycle 4 cycle 5 cycle 6
x y z x y z x y z x y z x y z x y z P1 AT 0.5 1.25 1 1 0 1 0.5 -1.25 1 -0.5 -1.25 1 -1 0 1 -0.5 1.25 1 P2 TA -0.5 2.25 2 1 1.5 2 1.5 -0.25 2 0.5 -2.25 2 -1 -1.5 2 -1.5 0.25 2 P3 AC -1.0 3.5 3 1.5 2.75 3 2.5 -0.25 3 1.0 -3.5 3 -1.5 -2.75 3 -2.5 0.25 3 P4 Cg 0 2.5 4 1.5 1.25 4 1.5 -1.25 4 0 -2.5 4 -1.5 -1.25 4 -1.5 1.25 4 P5 gA 1.0 2.5 5 2 0 5 1.0 -2.5 5 -1.0 -2.5 5 -2 0 5 -1.0 2.5 5 P6 AT 1.5 3.75 6 3 0 6 1.5 -3.75 6 -1.5 -3.75 6 -3 0 6 -1.5 3.75 6 P7 Tg 0.5 2.75 7 2 1 7 1.5 -2.25 7 -0.5 -2.75 7 -2 -1 7 -1.5 2.25 7 P8 gC 0 1.5 8 1 1 8 1 -1.0 8 0 -1.5 8 -1 -1 8 -1.0 1.0 8 P9 CA 1.0 2.5 9 2 0 9 1 -2.5 9 -1 -2.5 9 -2 0 9 -1.0 2.5 9 P10 Ag 1.0 4.0 10 3 1 10 2 -3.5 10 -1 -4 10 -3 -1 10 -2.0 3.5 10
11 different species. The graphical representation clearly shows that:
i. DNA curves of human, gorilla, chimpanzee and lemur are closely similar;
ii. Mouse and rat have also same DNA curves, so as rabbit’s DNA curve;
iii. Goat and bovine are similar; and that iv. Gallus and opossum seem to be outliers.
experimental Analysis
Performance metric, dataset
and experimental environment
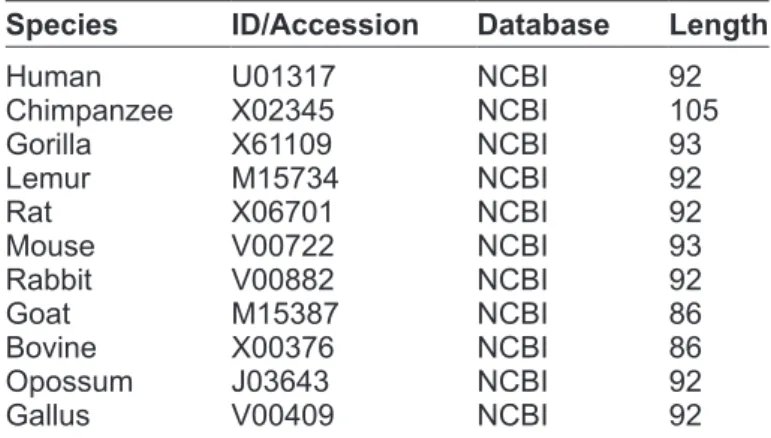
To evaluate the performance, we illustrate the use of the proposed method with an examination of simi-larities/dissimilarities among the β-globin gene of 11 different species, listed in Table 2, which were also previously studied.16–20 The table shows the different
important characteristics of the dataset. First, we show the overall performance of the proposed method. To do this, two features are extracted from the DNA curves: (i) geometric center and (ii) mathematical descriptor. Each DNA sequence is finally represented by their mathematical descriptors. These descriptors form six dimensional feature vectors. After that, the Euclidian distance is calculated among feature vec-tors of the DNA sequences. Secondly, we draw the phylogenic tree from similarity/dissimilarity matrix using UPGMA method in PHYLIP package. Finally, we compare the proposed method with the already mentioned research works16–20 to show its superiority
to others.
Table 1. 3D coordinates of ATACgATgCAg based on the proposed method.
points Dinucleotide cycle 1 cycle 2 cycle 3 cycle 4 cycle 5 cycle 6
x y z x y z x y z x y z x y z x y z P1 AT 0.5 1.25 1 1 0 1 0.5 -1.25 1 -0.5 -1.25 1 -1 0 1 -0.5 1.25 1 P2 TA -0.5 2.25 2 1 1.5 2 1.5 -0.25 2 0.5 -2.25 2 -1 -1.5 2 -1.5 0.25 2 P3 AC -1.0 3.5 3 1.5 2.75 3 2.5 -0.25 3 1.0 -3.5 3 -1.5 -2.75 3 -2.5 0.25 3 P4 Cg 0 2.5 4 1.5 1.25 4 1.5 -1.25 4 0 -2.5 4 -1.5 -1.25 4 -1.5 1.25 4 P5 gA 1.0 2.5 5 2 0 5 1.0 -2.5 5 -1.0 -2.5 5 -2 0 5 -1.0 2.5 5 P6 AT 1.5 3.75 6 3 0 6 1.5 -3.75 6 -1.5 -3.75 6 -3 0 6 -1.5 3.75 6 P7 Tg 0.5 2.75 7 2 1 7 1.5 -2.25 7 -0.5 -2.75 7 -2 -1 7 -1.5 2.25 7 P8 gC 0 1.5 8 1 1 8 1 -1.0 8 0 -1.5 8 -1 -1 8 -1.0 1.0 8 P9 CA 1.0 2.5 9 2 0 9 1 -2.5 9 -1 -2.5 9 -2 0 9 -1.0 2.5 9 P10 Ag 1.0 4.0 10 3 1 10 2 -3.5 10 -1 -4 10 -3 -1 10 -2.0 3.5 10
Example of the proposed method
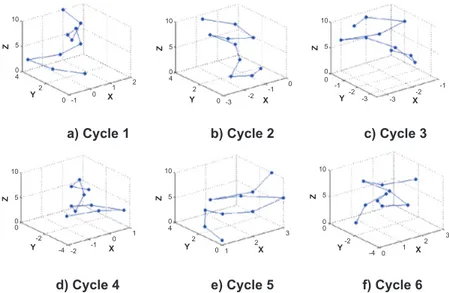
The following example is used with the arbitrary DNA sequence ATACGATGCAG. The length of the string is 11, hence there are 10 dinucleotide. The 3D coordinate for all cycles of the sequence is shown in Table 1.
As for graphical representation, the 10 points P1, P2, …, P10 are plotted in 3D space for the exam-ple sequence ATACGATGCAG. The six possible DNA curves for the example sequence are shown in Figure 4.
In this way, each DNA sequence is converted into a series of points. Then DNA curves are drawn from those points. Connecting N-1 points from the first one, we get the proposed novel 3D zigzag curve in the 3D space. The DNA curve is helpful to easily dis-tinguish among different species.
It can easily be seen that the example graphical representation does not hold any overlapping or loop. This property will be retained for any DNA sequence because the value of “i” in the proposed method is unique in every point.
graphical representation of the proposed
method
The proposed model is useful to show the hidden properties of long DNA sequences which are not seen from the sequence. The pictorial presentation of the proposed method proves that it is very useful to understand the evolutionary similarity/dissimilarity of different species. Figure 5 shows the 3D zigzag curve based on Cycle 1 of first exon of β-globin for
5 Z Y Y Y Y Y Y X X X X X X 10 0 4 5 Z 10 0 4 5 Z 10 0 0 5 Z 10 0 0 0 0 2 2 3 1 5 Z 10 0 4 5 Z 10 0 0 -2 -2 -4 -1 0 1 2 2 0 0 0 -3 -2 -3 -3 -2 -2 -4 1 2 3 -2 -1 -1 -1 -1
a) Cycle 1 b) Cycle 2 c) Cycle 3
f) Cycle 6 e) Cycle 5 d) Cycle 4 1 0 2
Figure 4. The graphical representation of the proposed model for the example sequence ATACgATgCAg.
a) Human b) Chimpanzee c) Gorilla
f) Rat e) Mouse
d) Lemur
g) Rabbit h) Goat i) Bovine
j) Gallus k) Opossum 100 50 Z Y X Y X 50 -50-10 -5 -50-10 5 0 100 50 Z 500 100 50 Z 500 0 0 Y -50 0 0 -5 5 0 X -10 -5 5 0 100 50 Z 500 Y -50 0 X -20 -10 10 0 100 50 Z 500 Y -50 0 X -20 -10 10 0 100 50 Z 500 Y -50 0 X -10 -5 5 0 100 50 Z 500 Y -50 0 X -20 -10 10 0 100 50 Z 500 100 50 Z 20 -20 -10 -5 5 0 Y -50 0 X Y0 X 0 -10 -5 5 0 100 50 Z 500 Y -50 0 X -10 -5 5 0 100 50 Z 500 Y -50 0 X -10 -5 5 0
Table 2. The first exon of β-globin gene of 11 different
species.
species ID/Accession Database Length
human U01317 NCBi 92
Chimpanzee X02345 NCBi 105 gorilla X61109 NCBi 93 Lemur M15734 NCBi 92 rat X06701 NCBi 92 Mouse V00722 NCBi 93 rabbit V00882 NCBi 92 goat M15387 NCBi 86 Bovine X00376 NCBi 86 Opossum J03643 NCBi 92 gallus V00409 NCBi 92
Our programs were written in Python 2.7, and run with the Windows XP operating system on a Pentium dual-core 2.13 GHz CPU with 2 GB main memory. We used BioPython 1.60 for sequence parsing and also ACD/ChemSketch for drawing the ring structure of nucleotides.
Numerical analysis of the proposed
method
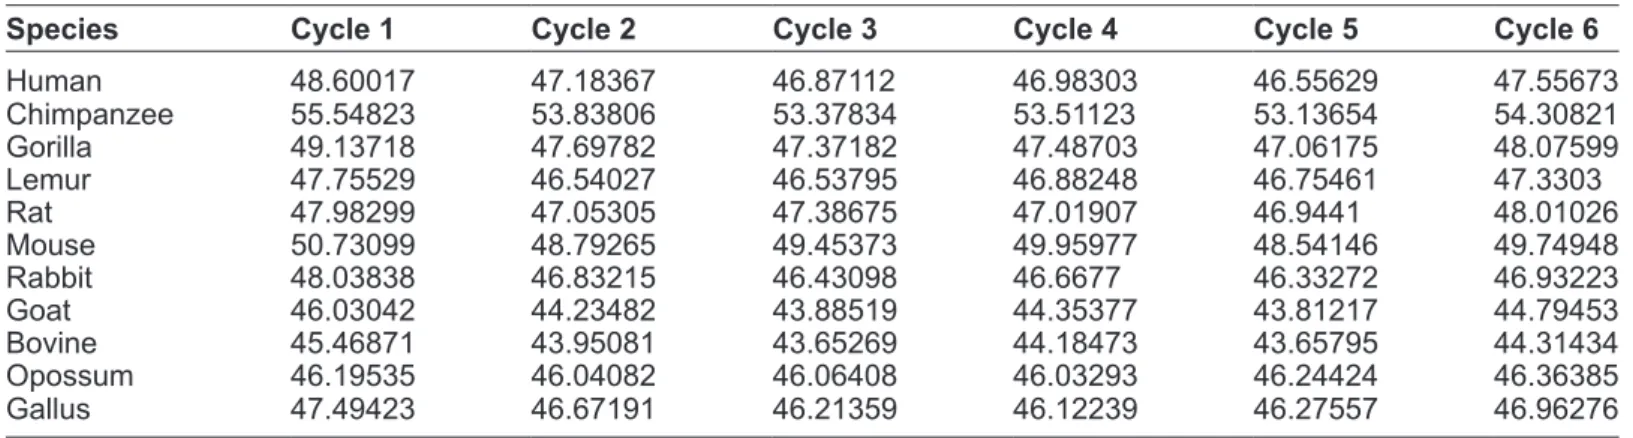
As stated earlier, features from DNA curves are extracted two ways. Firstly, the geometric centers of the curves are calculated using the following equations. Table 3 shows the geometric center of 11 DNA curves.
u 1 N x , u N1 y , u N1 z x i i 1 N y i i 1 N z i i 1 N = = = = = =
∑
∑
∑
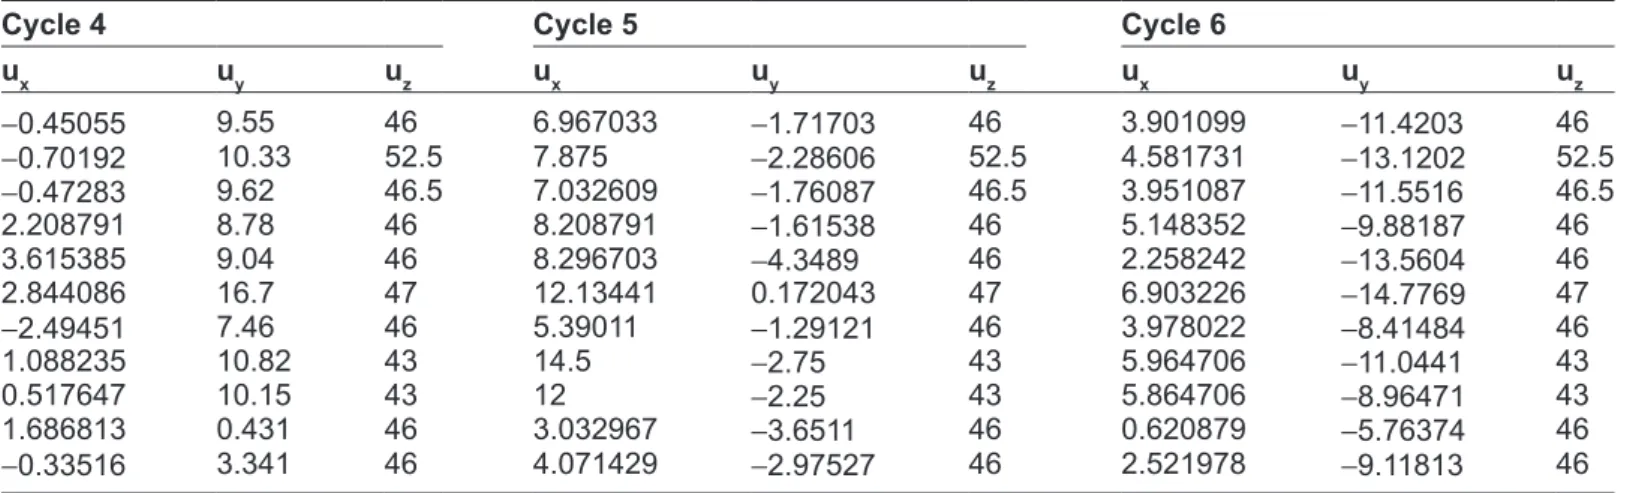
The significance of the geometric center is that it shows the average value of x, y and z coordinate. Normally, if the geometric centers are plotted, then similar species fall into same cluster. So, the geomet-ric center is an important feature of the DNA curves for the analysis of evolutionary relationship among different species.
To make our system unbiased, we take all the pos-sible rotations (such as Cycle 1, Cycle 2, …, Cycle 6) of hexagonal ring structure and extract the geometric center for each combination.
Secondly, mathematical descriptors are obtained from the first feature, the geometric center, using the following equation. Table 4 shows the mathematical descriptor of the 11 curves.
ρ = ux2 +uy2 +uz2
We use the Euclidian distance for similarity measurement. Let two different species be i and j. The mathematical descriptor of i are p1i, p2i, p3i, p4i, p5i and p6i. The same descriptors for species j are p1j, p2j, p3j, p4j, p5j and p6j. The Euclidian distance of i and j are then calculated using the following equation: Di,j 1i N 1 1j N 1 2i N 1 2j N 1 3i N 1 3 = ρ + -ρ + + ρ + -ρ + + ρ + -ρ 2 2 jj N 1 4i N 1 4j N 1 5i N 1 5j N 1 6i + + ρ + -ρ + + ρ + -ρ + + ρ 2 2 2 N N 1 6j N 1 + -ρ + 2
The similarity/dissimilarity matrix found from the above Euclidian distance metric is shown in Table 5.
Some observations are vividly depicted from Table 5 which are also consistent with the graphical representation portrayed in Section 3.4. They are as follows:
i. The smallest entry is 0.0002 for the pair (human, gorilla), showing that human and gorilla are almost same in terms of evolution-ary characteristics. The same is applied for the pair (human, chimpanzee) = 0.0020. There-fore, human, chimpanzee and gorilla are similar species; 0 50 40 30 20 10 0 -10 -4 -3 -2 -1 0 X1 Y Z 2 3 4 5 Human Chimpanzee Gorilla Lemur Rat Mouse Rabbit Goat Bovine Opossum Gallus 10 20 30 40 50 60
Table 4. Mathematical descriptor of 11 different species.
species cycle 1 cycle 2 cycle 3 cycle 4 cycle 5 cycle 6
human 48.60017 47.18367 46.87112 46.98303 46.55629 47.55673 Chimpanzee 55.54823 53.83806 53.37834 53.51123 53.13654 54.30821 gorilla 49.13718 47.69782 47.37182 47.48703 47.06175 48.07599 Lemur 47.75529 46.54027 46.53795 46.88248 46.75461 47.3303 rat 47.98299 47.05305 47.38675 47.01907 46.9441 48.01026 Mouse 50.73099 48.79265 49.45373 49.95977 48.54146 49.74948 rabbit 48.03838 46.83215 46.43098 46.6677 46.33272 46.93223 goat 46.03042 44.23482 43.88519 44.35377 43.81217 44.79453 Bovine 45.46871 43.95081 43.65269 44.18473 43.65795 44.31434 Opossum 46.19535 46.04082 46.06408 46.03293 46.24424 46.36385 gallus 47.49423 46.67191 46.21359 46.12239 46.27557 46.96276
Table 5. Euclidian distance among 11 different species.
species chimpanzee Gorilla Lemur Rat Mouse Rabbit Goat Bovine Opossum Gallus
human 0.0020 0.0002 0.0124 0.0109 0.0336 0.0116 0.0236 0.0139 0.0343 0.0189 Chimpanzee 0.0018 0.0138 0.0115 0.0330 0.0131 0.0226 0.0137 0.0358 0.0201 gorilla 0.0126 0.0109 0.0336 0.0118 0.0235 0.0139 0.0344 0.0190 Lemur 0.0134 0.0420 0.0080 0.0280 0.0156 0.0236 0.0114 rat 0.0155 0.0174 0.0233 0.0318 0.0342 0.0218 Mouse 0.0443 0.0280 0.0330 0.0644 0.0516 rabbit 0.0311 0.0186 0.0238 0.0088 goat 0.0131 0.0494 0.0368 Bovine 0.0370 0.0245 Opossum 0.0169 Human Chimpanzee Gorilla Lemur Goat Bovine Rabbit Rat Mouse Opossum Gallus Figure 6. Phylogenic analysis of 11 different species.
Proposed method Huang Y. et al Qix et al Qiz.H. et al Liao B. et al Jafarzadeh N. et al 0
Gorilla Chimpanzee Lemur Rat
10 species to compare with human
Mouse Rabbit Goat Bovine Opossum Gallus 50
100 150
Figure 7. The degree of similarity/dissimilarity of the other 10 species with human.
Table 3. geometrical center of 11 different species.
species cycle 1 cycle 2 cycle 3 cycle 4 cycle 5 cycle 6
ux uy uz ux uy uz ux uy uz ux uy uz ux uy uz ux uy uz human -4.489 -15.0275 46 -9.81 -3.75 46 -6.74725 5.947802 46 -0.45055 9.55 46 6.967033 -1.71703 46 3.901099 -11.4203 46 Chimpanzee -4.7981 -17.5024 52.5 -10.88 -4.89 52.5 -7.59135 5.947115 52.5 -0.70192 10.33 52.5 7.875 -2.28606 52.5 4.581731 -13.1202 52.5 gorilla -4.5163 -15.2255 46.5 -9.9 -3.85 46.5 -6.82065 5.942935 46.5 -0.47283 9.62 46.5 7.032609 -1.76087 46.5 3.951087 -11.5516 46.5 Lemur -2.3132 -12.6181 46 -6.71 -2.23 46 -3.65385 6.035714 46 2.208791 8.78 46 8.208791 -1.61538 46 5.148352 -9.88187 46 rat -6.7802 -11.8489 46 -9.78 1.53 46 -3.74176 10.74725 46 3.615385 9.04 46 8.296703 -4.3489 46 2.258242 -13.5604 46 Mouse -5.6882 -18.2285 47 -13 -1.65 47 -7.8172 13.25 47 2.844086 16.7 47 12.13441 0.172043 47 6.903226 -14.7769 47 rabbit -2.3736 -13.6401 46 -7.31 -4.88 46 -5.9011 2.239011 46 -2.49451 7.46 46 5.39011 -1.29121 46 3.978022 -8.41484 46 goat -2.7824 -16.1882 43 -9.106 -4.98 43 -6.68235 5.679412 43 1.088235 10.82 43 14.5 -2.75 43 5.964706 -11.0441 43 Bovine -1.7824 -14.6706 43 -7.747 -4.76 43 -6.06471 4.447059 43 0.517647 10.15 43 12 -2.25 43 5.864706 -8.96471 43 Opossum -1.8571 -3.8159 46 -1.92 0.266 46 0.489011 2.379121 46 1.686813 0.431 46 3.032967 -3.6511 46 0.620879 -5.76374 46 gallus -2.4615 -11.5604 46 -5.9 -5.24 46 -4.34615 0.898352 46 -0.33516 3.341 46 4.071429 -2.97527 46 2.521978 -9.11813 46 Degree of sim ilarity/dissim ilarity
Table 3. geometrical center of 11 different species.
species cycle 1 cycle 2 cycle 3 cycle 4 cycle 5 cycle 6
ux uy uz ux uy uz ux uy uz ux uy uz ux uy uz ux uy uz human -4.489 -15.0275 46 -9.81 -3.75 46 -6.74725 5.947802 46 -0.45055 9.55 46 6.967033 -1.71703 46 3.901099 -11.4203 46 Chimpanzee -4.7981 -17.5024 52.5 -10.88 -4.89 52.5 -7.59135 5.947115 52.5 -0.70192 10.33 52.5 7.875 -2.28606 52.5 4.581731 -13.1202 52.5 gorilla -4.5163 -15.2255 46.5 -9.9 -3.85 46.5 -6.82065 5.942935 46.5 -0.47283 9.62 46.5 7.032609 -1.76087 46.5 3.951087 -11.5516 46.5 Lemur -2.3132 -12.6181 46 -6.71 -2.23 46 -3.65385 6.035714 46 2.208791 8.78 46 8.208791 -1.61538 46 5.148352 -9.88187 46 rat -6.7802 -11.8489 46 -9.78 1.53 46 -3.74176 10.74725 46 3.615385 9.04 46 8.296703 -4.3489 46 2.258242 -13.5604 46 Mouse -5.6882 -18.2285 47 -13 -1.65 47 -7.8172 13.25 47 2.844086 16.7 47 12.13441 0.172043 47 6.903226 -14.7769 47 rabbit -2.3736 -13.6401 46 -7.31 -4.88 46 -5.9011 2.239011 46 -2.49451 7.46 46 5.39011 -1.29121 46 3.978022 -8.41484 46 goat -2.7824 -16.1882 43 -9.106 -4.98 43 -6.68235 5.679412 43 1.088235 10.82 43 14.5 -2.75 43 5.964706 -11.0441 43 Bovine -1.7824 -14.6706 43 -7.747 -4.76 43 -6.06471 4.447059 43 0.517647 10.15 43 12 -2.25 43 5.864706 -8.96471 43 Opossum -1.8571 -3.8159 46 -1.92 0.266 46 0.489011 2.379121 46 1.686813 0.431 46 3.032967 -3.6511 46 0.620879 -5.76374 46 gallus -2.4615 -11.5604 46 -5.9 -5.24 46 -4.34615 0.898352 46 -0.33516 3.341 46 4.071429 -2.97527 46 2.521978 -9.11813 46
ii. The pair (goat, bovine) has the small entry 0.0131 which indicates the evolutionary similarity between goat and bovine. The biological taxon-omy of bovine and goat proves that both of them are even-toed ungulates and belong to the family of “Bovidae”;16
iii. Rat and mouse also show a small entry which indicates their evolutionary closeness;
iv. The remote mammalian opossum has the largest entry to all other mammalians.
Phylogenic analysis
A phylogeny tree was drawn from the above similarity matrix using the UPGMA method of PHYLIP software package to see the relation-ship among different species. The tree is shown in Figure 6.
The tree also shows the similarity among (human, chimpanzee, gorilla), (mouse, rat), and (goat, bovine). Conversely, gallus is the outlier and opossum is the remote mammalian species than others.
Comparison with other methods
We see that there is an overall agreement between numerical and phylogenic analysis. To see it visu-ally, we denote the degree of similarity of the pair (human, gorilla) as 1 in Table 5, and the results of the examination of the degree of similarity/dissimi-larity between human and other several species under the Euclidian measurement are shown in Figure 7. To draw the other curves, we used Table 3 of Qi’s work,16
Table 7 of Jafarzadeh’s work,17 Table 2 of Huang,18
Table 3 of Qi’s work,19 and Table 4 of Liao’s work.20
Those tables provide the best similarity/dissimilarity value of the research works.
Several reference papers16–20 work on same
data-set. Of them, the research papers of Qi16 and Huang18
were based on dinucleotides, while Jafarzadeh17
used trinucleotides, and Qi19 and Liao20 used single
nucleotides. Those works do not reflect the degree of similarity/dissimilarity among different species as accurately as it should be. For example, the differ-ence in degree of similarity/dissimilarity among (rat, opossum), (mouse, opossum), and (goat, opossum) are almost the same in the above listed papers.16–20
This, however, is not true in nature as the opossum is the most remote mammal species. Therefore it can be concluded that intra-mammalian degree of similarity/ dissimilarity is not properly reflected by the above methods. The proposed method, on the other hand, shows this natural consistency among (rat, opossum), (mouse, opossum), and (goat, opossum) clearly. As the opossum shows the highest peak, this demon-strates that it is not an outlier of the dataset but actu-ally very different from other mammalian species.
The only non-mammalian species, gallus, is not truly represented by the above methods as the difference between peak value of gallus and opos-sum is not significant. From Table 5, we see that the opossum has variation in similarity score from other species. This is reflected in Figure 7. Gallus has the positive difference of distance in terms of degree of similarity/dissimilarity from all species analyzed, except goat and opossum. For those two species, it maintains negative differences. There-fore, from this analysis it could be concluded that
goat and opossum are either mammals or non-mammals, however it is known that the goat is a mammal. It therefore must be concluded that the opossum is also a mammal, but the most remote species from the remaining mammals. As a result, gallus is the only species that is neither mamma-lian nor shows score value like opossum. Hence, gallus falls into a single group within the species analyzed: non-mammalian.
conclusion
A graphical method based on dinucleotides and their positional information is proposed in this research work. Graphical as well as numeric analyses of the model show that the proposed novel method is compatible with the natural consistency in terms of evolutionary relationship of 11 different species. In this paper, DNA sequences are transformed into 3D DNA curves, and features from those curves are then extracted. DNA curves are represented by their feature vector. Subsequently, Euclidian distance is applied to those feature vectors to deduce the evo-lutionary relationship among 11 different species. Tri-nucleotide based DNA sequence analysis using the proposed method would be one recommended future work.
Author contributions
Conceived and designed the experiment: AGB, BSJ. Analyzed the data: AGB, MRR, BSJ. Wrote the first draft of the manuscript: AGB, BSJ. Contributed to the writing of manuscript: AGB, MRR, ATI, HJC. Agree with manuscript results and conclusions: AGB, BSJ, HJC. Jointly developed the structures and argument for the paper: AGB, BSJ, HJC. Made critical revi-sions and approved final revision: AGB, BSJ, MRR, ATI. All authors reviewed and approved of the final manuscript.
Funding
This work was supported by the National Research Foundation of Korea (NRF) grant funded by the Korea government (MSIP) (No. 2010-0028631).
competing Interests
Author(s) disclose no potential conflicts of interest.
Disclosures and ethics
As a requirement of publication the authors have pro-vided signed confirmation of their compliance with ethical and legal obligations including but not lim-ited to compliance with ICMJE authorship and com-peting interests guidelines, that the article is neither under consideration for publication nor published elsewhere, of their compliance with legal and ethi-cal guidelines concerning human and animal research participants (if applicable), and that permission has been obtained for reproduction of any copyrighted material. This article was subject to blind, indepen-dent, expert peer review. The reviewers reported no competing interests.
References
1. Hamori E, Ruskin J. H curves: a novel method of representation of nucle-otide series especially suited for long DNA sequences. J Biol Chem. 1983; 258(2):1318–27.
2. Li Y, Huang G, Liao B, Liu Z. H-L curve: a novel 2-D graphical repre-sentation of protein sequences. MATCH Commun Math Comput Chem. 2009;61(2):519–32.
3. Guo X, Randic M, Basak SC. A novel 2-D graphical representation of DNA sequences of low degeneracy. Chem Phys Letter. 2001;350(1–2): 106–12.
4. Jafarzadeh N, Iranmanesh A. A novel graphical and numerical represen-tation for analyzing DNA sequences based on codons. MATCH Commun Math Comput Chem. 2012;68:611–20.
5. Yu JF, Wang JH, Sun X. Analysis of similarities/dissimilarities of DNA sequences based on a novel graphical representation. MATCH Commun Math Comput Chem. 2010;63:493–512.
6. Liao B, Zhu W, Liu Y. 3D graphical representation of DNA sequence with-out degeneracy and its applications in constructing phylogenic tree. MATCH Commun Math Comput Chem. 2006;56(1):209–16.
7. Cao Z, Liao B, Li R. A group of 3D graphical representation of DNA sequences based on dual nucleotides. Internat J Quant Chem. 2008;108(9): 1485–90.
8. Chi R, Ding K. Novel 4D numerical representation of DNA sequences. Chemical Physics Letters. 2005;407(1–3):63–7.
9. Liao B, Li R, Zhu W, Xiang X. On the similarity of DNA primary sequences based on 5-D representation. J Math Chem. 2007;42(1):47–57.
10. Liao B, Wang T. Analysis of similarity/dissimilarity of DNA sequences based on nonoverlapping triplets of nucleotide bases. J Chem Inf Comput Sci. 2004;44(5):1666–70.
11. Wu R, Hu Q, Li R, Yue G. A novel composition coding method of DNA sequence and its application. MATCH Commun Math Comput Chem. 2012;67:269–76.
12. Qi X, Wu Q, Zhang Y, Fuller E, Zhang CQ. A novel model for DNA sequence similarity analysis based on graph theory. Evol Bioinform Online. 2011;7:149–58.
13. Ewens J, Grant G. Statistical Methods in Bioinformatics: An Introduction. 2nd ed. New York: Springer Science; 2005.
14. Randić M, Vračko M, Lerš N, Plavšić D. Novel 2-D graphical representa-tion of DNA sequences and their numerical characterizarepresenta-tion. Chem Phys Lett. 2003;368(1–2):1–6.
15. Randić M, Vračko M, Lerš N, Plavšić D. Analysis of similarity/dissimilarity of DNA sequences based on novel 2-D graphical representation. Chem Phys Lett. 2003;371(1–2):202–7.
16. Qi X, Fuller E, Wu Q, Zhang CQ. Numerical characterization of DNA sequence based on dinucleotides. Sci World J. 2012;2012:1–6.
17. Jafarzadeh N, Iranmanesh A. C-curve: a novel 3D graphical representation of DNA sequence based on codons. Math Biosci. 2013;241(2):217–24. 18. Huang Y, Wang T. New graphical representation of a DNA sequence based
on the ordered dinucleotides and its application to sequence analysis. Internat J Quantum Chem. 2012;112(6):1746–57.
19. Qi ZH, Qi XQ. Numerical characterization of DNA sequences based on digital signal method. Comput Biol Med. 2009;39(4):388–91.
20. Liao B, Tan M, Ding K. A 4D representation of DNA sequences and its application. Chem Phys Lett. 2005;402(4–6):380–3.
21. Castro-Chavez F. Most used codons per amino acid and per genome in the code of man compared to other organisms according to the rotating circular genetic code. Neuroquantology. 2011;9(4):747–66.
22. Castro-Chavez F. A tetrahedral representation of the genetic code emphasiz-ing aspects of symmetry. BIOcomplexity. 2012;2012:1–6.
23. Castro-Chavez F. Defragged binary I Ching genetic code chromosomes com-pared to Nirenberg’s and transformed into rotating 2D circles and squares and into a 3D 100% symmetrical tetrahedron coupled to a functional one to discern start from non-start methionines through a stella octangula. J Proteome Sci Comput Biol. 2012;2012(1):3.