A Thesis for the Degree of
Doctor of Philosophy
Ultrasound Backscatter from Flowing
Blood at Different Hematocrit Levels
Kweon-Ho Nam
Interdisciplinary Postgraduate Program in Biomedical Engineering
GRADUATE SCHOOL
CHEJU NATIONAL UNIVERSITY
Ultrasound Backscatter from Flowing Blood
at Different Hematocrit Levels
Kweon-Ho Nam
(Supervised by Professor Dong-Guk Paeng)
A thesis submitted in partial fulfillment of the requirement
for the degree of Doctor of Philosophy
2007. 8.
This thesis has been examined and approved.
---Thesis director, Min Joo Choi, Prof. of Biomedical Engineering
---Jun Hong Park, Prof. of Veterinary Medicine
---Kwang-Man Lee, Prof. of Electronic Engineering
---Young Ree Kim, Prof. of Laboratory Medicine
---Dong-Guk Paeng, Prof. of Marine Industrial Engineering
---Date
Interdisciplinary Postgraduate Program in Biomedical Engineering
GRADUATE SCHOOL
SUMMARY
It is well known that the scattering of ultrasound by blood is mainly attributed to red blood cells (RBCs) and that RBC aggregation is a major cause of the increased backscatter from blood. In this study, the effects of hemodynamics and hematocrit on ultrasonic backscatter were investigated using a mock flow loop with a stenosis and a rotational flow system.
RBC aggregation is known to be highly dependent on hemodynamic parameters such as shear rate, flow turbulence, and flow acceleration under pulsatile flow. The effects of these three hemodynamic parameters on RBC aggregation and echogenicity of porcine whole blood were investigated around an eccentric stenosis in a mock flow loop using a GE LOGIQ 700 expert system. A hyperechoic parabolic profile appeared downstream during the accelerating phase, suggesting that rouleaux formation may be enhanced by flow acceleration. The local increase of echogenicity and the hypoechoic “black hole” downstream is thought to be caused by the compound effect of flow turbulence and shear rate. In addition, the experimental results upstream of a stenosis showed that blood flow disturbed by a stenosis and weak backward flow affects the echogenicity and the distribution of RBC rouleaux. During diastole, the bright parabolic profiles and eddy-like flow patterns were shown in longitudinal images and the “bright ring” in cross-sectional images. These images could be reconstructed into 3-dimensional animation, providing a better understanding of dynamic changes of the rouleaux distribution upstream of a stenosis under pulsatile flow.
The blood samples from human, horse and rat in a cylindrical chamber were used for studying RBC aggregation. The flow in the chamber was controlled by a stirring magnet. Ultrasound backscattered power from blood was calculated from the backscattered signals measured by a 5 MHz focused transducer in a pulse-echo setup. The experimental results showed the differences in RBC aggregation tendency among the three mammalian species with an order of horse > human > rat. The ultrasound backscattered power decreased with stirring
speed in human and horse blood, but no variations were observed in rat blood. A sudden flow stoppage led to the slow increase of the backscattered power for human and horse blood. The enveloped echo images showed the radial and temporal variations of RBC aggregation in the cylindrical chamber. These observations from the different mammalian species may give a better understanding of the mechanism of RBC aggregation.
Ultrasonic backscatter from rat RBCs in autologous plasma and in 360 kDa polyvinylpyrrolidone (PVP 360) solution was measured as a function of hematocrit and shear rate. The variation of the backscattered power from rat blood could not be well determined because of the very low aggregation tendency of RBCs in rat blood. To enhance the aggregation level, rat plasma was replaced by polymer solution of PVP 360. At stirring conditions, the backscattered power rapidly increased to a plateau within 30 seconds. The magnitude of the mean backscattered power at plateau was in proportion to hematocrit at a range of 10 to 40 %. However, when the flow was suddenly stopped, the power slowly increased up to the maximal levels and the rate of power buildup nonlinearly increased with hematocrit. Using a simplified shearing system and small amount of RBC samples in aggregating media, the hematocrit and shear rate dependency of RBC aggregation was successfully demonstrated.
Finally, this simplified system was proposed to examine the effect of drugs on RBC aggregation. Rat RBCs in PVP 360 solution was employed for aggregation. Aggregation inhibitor, DIDS decreased RBC aggregation as a dose-dependent manner at both stasis and under shear forces. These results indicate that the present experimental setup is useful to study the relationship between drugs and RBC aggregation. In addition, it may contribute to elucidate the mechanism and pathophysiological roles of RBC aggregation.
Key words: Erythrocyte aggregation, Flow acceleration, Flow turbulence, Hematocrit, Shear rate, Ultrasound backscatter.
TABLE OF CONTENTS
S U M M A R Y ... I
TABLE OF CONTENTS ...III
LIST OF FIGURES ...VI
LIST OF TABLES ...IX
CHAPTER 1 INTRODUCTION ...1
1.1. Background...1
1.1.1. RBC Aggregation...1
1.1.1.1. Mechanisms...1
1.1.1.2. Factors...3
1.1.1.3. Differences in Mammalian Species ...4
1.1.2. Scattering of Ultrasound by Blood...5
1.2. Specific Aims ...8
1.3. Thesis Outlines...10
CHAPTER 2 ULTRASONIC OBSERVATION OF BLOOD DISTURBANCE IN A STENOSED TUBE...11
2.1. Introduction...11
2.2. Materials and Methods ...14
2.2.1. Blood Preparation ...14
2.2.2. Flow Model...15
2.2.3. Ultrasound System and Data Analysis ...16
2.3. Downstream of an Eccentric Stenosis ...19
2.3.1. Results ...19
2.3.1.1. B-mode Snapshots at Accelerating Phase...19
2.3.1.2. ‘Black Hole’ Phenomenon Downstream ...19
2.3.1.4. RBC Suspension Experiments ...21
2.3.2. Discussion...28
2.3.2.1. Flow Acceleration ...28
2.3.2.2. Flow Turbulence ...28
2.3.2.3. Echogenic Variation at Diastole...32
2.3.2.4. Echogenic Variation in RBC Suspension ...32
2.3.2.5. Study Limitations...33
2.4. Upstream of an Eccentric Stenosis ...34
2.4.1. Results and Discussion...34
2.4.1.1. B-mode and Duplex Image Snapshots Upstream ...34
2.4.1.2. ‘Black Hole’ Phenomenon Upstream...34
2.4.1.3. ‘Bright Ring’ Phenomenon...35
2.4.1.4. Clinical Relevance ...37
2.5. Conclusions...44
CHAPTER 3 ULTRASOUND BACKSCATTERING FROM RBC AGGREGATION OF HUMAN, HORSE, AND RAT BLOOD UNDER ROTATIONAL FLOW IN A CYLINDRICAL CHAMBER...45
3.1. Introduction...45
3.2. Materials and Methods ...48
3.2.1. Blood Collection ...48
3.2.2. Mixing Chamber ...48
3.2.3. Experimental System...48
3.2.4. Measurement Protocol and Data Analysis ...49
3.3. Results ...54
3.3.1. RF Signals...54
3.3.2. M-mode Images ...54
3.3.3. Backscattered Power from Human, Horse, and Rat Blood...56
3.4. Discussion...57
3.5. Conclusions...62
CHAPTER 4 EFFECTS OF HEMATOCRIT AND SHEAR RATE ON ULTRASONIC BACKSCATTER FROM RAT RBC IN AGGREGATING MEDIA ...63
4.1. Introduction...63
4.2. Materials and Methods ...65
4.2.1. Blood Preparation ...65
4.2.2. Flow System and Experimental Setup...66
4.2.3. Experimental Design and Analysis of RF Signal ...66
4.3. Results ...67
4.4. Discussion...77
4.5. Conclusions...81
CHAPTER 5 INHIBITORY EFFECT OF DIDS ON RBC AGGREGATION DETERMINED BY ULTRASONIC BACKSCATTER ...82
5.1. Introduction...82
5.2. Materials and Methods ...83
5.3. Results and Discussion ...84
CHAPTER 6 CONCLUSIONS ...90
BIBLIOGRAPHY...92
A P P E N D I X...103
SUMMARY (in KOREAN) ...104
LIST OF FIGURES
Fig. 1. Photomicrographs of human RBCs in plasma (left panel) and in saline (right panel). Magnification × 400 (Fatkin et al. 1997)...2 Fig. 2. Experimental setup for the flow loop model and construction of an eccentric stenosis.
...17 Fig. 3. Consecutive snap shots of B-mode images during accelerating phase of pulsatile
flow (40 bpm) downstream of a stenosis. Arrows indicate the head of parabolic profiles moving down along the flow direction. A speed profile in cm/s was measured from the mean Doppler frequencies at the throat of the stenotic site...22 Fig. 4. The line plots of the temporal mean echogenicity over a pulsatile cycle for (a) 20
bpm and (b) 40 bpm at four sites of 1D to 4D downstream. (c) The line plot of echogenicity 2D upstream for 20 bpm...23 Fig. 5. The instantaneous echogenicity at the surrounding hyperechoic zone (solid line) and
the BLH zone (dotted line) from 1D to 4D downstream for 20 bpm. The speed profile in cm/s was measured from the mean Doppler frequencies at the throat of the stenotic site. ...24 Fig. 6. The cyclic variation of the echogenicity deviation obtained by subtraction of the
temporal mean echogenicity (as shown in Fig. 4) from the instantaneous echogenicity at different sites from 1D to 4D downstream of a stenosis under pulsatile flow for 20 and 40 bpm. The middle panel shows the radial mean of echogenicity deviation over a tube diameter calculated from the upper four panels. The speed profiles in cm/s were measured from the mean Doppler frequencies at the throat of the stenotic site...25 Fig. 7. Snap shots of B-mode images from whole porcine blood during diastole of pulsatile
flow (40 bpm) downstream of a stenosis. The time interval of each image is about 0.1 second from T1 to T4. The speed profile in cm/s was measured from the mean Doppler frequencies at the throat of the stenotic site. ...26 Fig. 8. (a) Snap shots of B-mode images from RBC suspension extracted from forward flow
and backward flow under oscillatory flow of 40 bpm. The arrows indicate blood flow direction. (b) Radially averaged echogenicity 2D upstream and downstream over two oscillatory cycles...27 Fig. 9. A schematic diagram to show laminar and turbulent flow downstream of stenosis...31 Fig. 10. Typical B-mode images of porcine blood upstream of a stenosis at diastole for three
stroke rates of 20, 40 and 60 bpm...38 Fig. 11. A Duplex image of porcine blood flow upstream of a stenosis at diastolic phase of
40 bpm. ...39 Fig. 12. B-mode image upstream of the stenosis at 20 bpm acquired at the time of peak
systolic phase (right) and the normalized echogenicity profile in radial direction along the line marked on the image (left). ...40 Fig. 13. (a) A reconstructed 3-dimensional ultrasound image of the BRR phenomenon
upstream of a stenosis at diastole of 20 bpm from (b) a longitudinal B-mode image and (c) 3 cross-sectional images. (d) Normalized echogenicity over the diameter of the tube center corresponding to the images in (c). Arrows in (b) indicate the cross-sectional sites in (c). ...41 Fig. 14. Snap shots of ultrasound B-mode images extracted from the composite
3-dimensional animation over a pulsatile cycle. The figures on each image show the normalized time over a pulsatile cycle. In the bottom panel, the speed profile of the tube center was computed from the mean Doppler frequencies approximately 3D upstream of a stenosis. ...42 Fig. 15. Contour plots of color Doppler images over a pulsatile cycle. Red and blue colors
of color Doppler imaging were converted to gray scale. The time was normalized by a period of one stoke. The negative values on contrast bars indicate the speed (cm/sec) for reverse flow...43 Fig. 16. Experimental system for the ultrasonic measurement from blood...51 Fig. 17. A contour plot of the relative acoustic intensity for the transducer with 5 MHz
center frequency and 9.5 mm aperture diameter. The numbers are in dB...52 Fig. 18. Illustration of time characteristics of the backscattered signal (a), zoom images of
the selected scattering window at stirring speed of 4 rps (b) and stasis (c) in horse whole blood...53 Fig. 19. Typical echo images from horse blood with various stirring rates for 5 minutes. The
gray scale corresponds to the enveloped amplitude of backscattered signal...55 Fig. 20. The variation of ultrasound backscattered power following a sudden flow reduction
from 4 rps to 1, 1.5, 2, 3 and 4 rps in human, horse and rat blood. Each plot represents the mean ± SE of six individuals. The SEs are only displayed for selected times in order to enhance the visualization of the graphs...59 Fig. 21. Mean backscattered power as a function of stirring rate obtained by averaging of
last 1 minute data in Fig. 20. ...60 Fig. 22. The variation of ultrasound backscattered power following a sudden flow stoppage
from 4 rps in human, horse and rat blood. Each plot represents the mean ± SE of six individuals. The SEs are only displayed for selected times in order to enhance the visualization of the graphs...61 Fig. 23. The variation of backscattered power as a function of hematocrit from flowing and
static rat RBCs in autologous plasma. The vertical lines at 300 seconds indicate the flow stoppage point. For each curve, averaging was performed over 10 experiments. ...70 Fig. 24. The variation of backscattered power as a function of hematocrit for rat RBCs in
0.75 % PVP 360 solution. All zero times indicate the swiching point from 4 rps to sudden flow reduction or stoppage. For each curve, averaging was performed over 6 experiments. ...71 Fig. 25. Backscattered power as a function of stirring rate at hematocrit range between 5
and 40 %. Each plot represents the mean ± S.D. (n=6). ...72 Fig. 26. Backscattered power as a function of hematocrit at stirring rate range between 0
and 4 rps. Each plot represents the mean ± S.D. (n=6)...73 Fig. 27 (a). Typical echo imges from rat RBCs in 0.75 % PVP 360 solution at various
hematocrit with stirring rates of 4 and 3 rps. Each image consists of 600 RF signal lines for 5 minutes. The gray scale corresponds to the enveloped amplitude of RF signal...74 Fig. 28. The variation of backscattered power as a function of time from rat RBC
suspension in 0.75 % PVP 360 solution. Zero time indicates the switching point from 4 rps to 1 rps. For each curve, averaging was performed over 6 experiments...86 Fig. 29. Mean backscattered power obtained by averaging of last 2 minutes data in Fig. 28.
Each value represents the mean ± S.E. (n=6). **p<0.01 versus normal group. ...87 Fig. 30. The variation of backscattered power as a function of time from rat RBC
suspension in 0.75 % PVP 360 solution. Zero time indicates the switching point from 4 rps to 0 rps. For each curve, averaging was performed over 6 experiments...88 Fig. 31. Slopes of the backscattered power buildup in Fig. 30. Each value represents the
LIST OF TABLES
Chapter 1
INTRODUCTION
1.1.
Background
1.1.1. RBC Aggregation
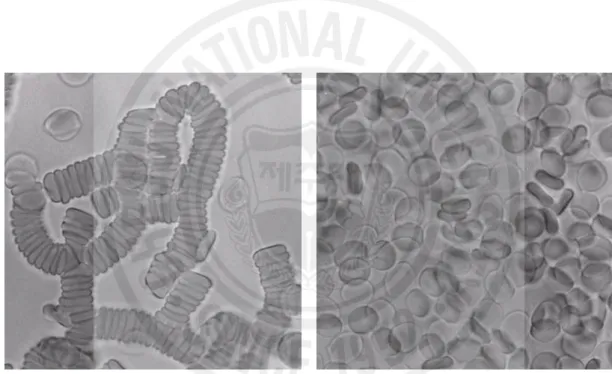
RBCs in plasma aggregate to form rouleaux and rouleaux networks under normal physiological conditions as a reversible process (Fig.1). This phenomenon continues to be of interest in the field of hemorheology since flow dynamics and flow resistance of blood are influenced by RBC aggregation. However, its pathophysiological impacts have not been fully resolved yet.
1.1.1.1. Mechanisms
The mechanisms of rouleaux formation and dissociation are very complex and not well understood. Two models have been proposed to explain the aggregation of RBCs, the bridging model and the depletion model (Rampling et al. 2004). In the bridging model, the formation of RBC aggregates results from the adsorption of plasmatic macromolecules at the surface of the RBC (Brooks et al. 1980; Chien 1981). In contrast, the depletion model suggests that RBC aggregation results from a lower localized macromolecule concentration near the cell membrane as compared with the suspending medium (Van Oss et al. 1990; Evans et al.1991). The exclusion of macromolecules near the RBC surface generates a reduction of the osmotic pressure in the gap between two nearby RBCs, creating an attractive force between them. These two models are in conflict and mutually exclusive. However, recent publications including the studies of RBC electrophoretic mobility have provided theoretical support for the depletion model (Donath et al. 1993; Armstrong et al. 1999; Baumler et al. 1996, 1999).
Fig. 1. Photomicrographs of human RBCs in plasma (left panel) and in saline (right panel). Magnification × 400 (Fatkin et al. 1997).
1.1.1.2. Factors
RBC aggregation does not occur if RBCs are suspended in isotonic salt solutions. Plasma proteins have been known to cause RBC aggregation (Rampling et al. 1984; Lowe 1993; Potron et al. 1994), and fibrinogen rather than globular proteins are mainly responsible for RBC aggregation. Previous studies about other macromolecules such as dextrans and some polymers have shown that the extent and rate of aggregate formation strongly depend on the type and concentration of polymers in the surrounding medium (Boynard and Leliere 1990; Nash et al. 1987; Neu and Meiselman 2002). More recent studies have shown that RBC cellular properties, such as RBC deformability, morphology, and surface charge, also play a very important role in the aggregation process (Rampling et al. 2004). The difference of cellular effects in aggregation tendency among different RBC samples can be measured in a defined polymer solution to exclude the various influences associated with autologous plasma.
The process of RBC aggregation can be considered as a result of a balance between aggregating and disaggregating forces that are affected by shear rate. Previous studies have suggested that the aggregation process involves three steps depending mainly on the shear stress, that is, the formation of short linear rouleaux which is composed of several RBCs, formation of long linear rouleaux, and the formation of complex 3-dimensional structures of branched rouleaux, whose occurrence is decreased with increasing shear stress (Shiga et al. 1983). Recent results by Paeng et al. (2004b, 2004c) suggested the possible effect of flow acceleration on the aggregation under pulsatile flow. According to the studies, it was hypothesized that blood flow acceleration is another factor that enhances the aggregation by increasing the probabilities of RBC collisions due to different inertia and compressional forces.
The non-linear relationship between hematocrit and RBC aggregation tendency has been reported in the several publications. According to those reports, it is clear that hematocrit plays an important role in RBC aggregation at a certain shear rate. However, the aggregation process
is also a function of shear rate. Since blood is a flowing substance in nature, shear rate should also be well controlled when we study the hematocrit dependency on RBC aggregation. It should be noted that the hematocrit dependency of ultrasonic backscatter from whole blood is quite different from that from RBC suspension where there is no RBC aggregate.
1.1.1.3. Differences in Mammalian Species
According to the reports on domestic fowls (Ohta et al. 1992) and frogs (Klose et al. 1972), no RBC aggregation was observed even at the lowest shear rate. These amphibian and bird have similar shape of an RBC that looks like an ellipsoid and RBCs do not have a nucleus. Such characteristics of RBCs are likely to face obstacles when they approach each other to aggregate due to their shapes and poor deformability. Therefore, it is assumed that the RBC aggregation may be a unique phenomenon that can be observed only in mammalian blood.
Windberger et al. (2003) reported that RBC aggregation was high in pig, dog, and cat and was intensively high in horse, whereas RBC aggregation in rat, cattle, sheep, rabbit, and mouse was low or underdetectable. RBC aggregation levels in pig, horse, sheep, and calf blood samples were also investigated and compared with that of normal human blood (Weng et al. 1996b). In that study, the adhesive forces and the index of structure of the aggregates in pig blood were close to those of human blood. The results for horse blood showed a very high level of aggregation kinetics and adhesive forces between RBCs. For sheep and calf blood, little RBC aggregation was found. They also showed that different human RBC aggregation levels could be simulated by diluting the concentration of plasma proteins in equine and porcine blood.
Comparative analyses of RBC membrane lipids have revealed species-specific differences in phospholipid composition (Roelofsen et al. 1981). The sodium dodecyl sulfate-polyacrylamide gel electrophoresis (SDS-PAGE) analysis of membrane proteins from horse, human, and rat RBC implies that significant differences may exist in the structure of
carbohydrate-rich proteins that are the main carriers of RBC negative surface charge (Baskurt et al. 1997). The two-phase partition coefficient for these three mammals suggested a difference in membrane surface charge with an order of rat > human > horse. Fibrinogen is known to be the major RBC aggregating factors in human. However, in other mammals, the fibrinogen concentrations are not always well correlated with the degree of RBC aggregation (Schneck 1988; Johnn et al. 1992; Ohta et al. 1992). Species differences might exist in the molecular weights of fibrinogen and other macromolecules which are important for RBC aggregation (Andrews et al. 1992). Variations in the RBC volume ratio, cell diameter, and mean corpuscular volume of mammalian species were reported. These variations may also cause differences in RBC aggregation among species. Popel et al. (1994) related the degree of aggregation in difference mammals to their exercise capacity, which showed that the athletic animals exhibited a higher tendency of RBC aggregation than the sedentary animals.
1.1.2. Scattering of Ultrasound by Blood
RBCs are the dominant ultrasonic scatterers in blood, because they constitute a great portion of the cellular components of blood. The dimension of RBC is much smaller than the ultrasonic wavelength for frequency ranges of most diagnostic imaging devices, so that an RBC can be considered as a Rayleigh scatterer. Since the acoustic mismatch between plasma and RBCs is very small, the Born approximation can be applied (Lucas and Twersky 1987; Shung and Thieme 1993). Then the backscattering cross section of a single RBC is given by
2 0 0 0 4 2 2
ú
û
ù
-ê
ë
é
-=
e e e e bsV
r
r
r
k
k
k
l
p
s
compressibility,
r
is the density, and the subscripts of e and 0 indicate RBC and the surrounding fluid media, respectively.At low hematocrit range, the total backscattered power can be calculated by summation of the backscattered power from all RBCs. However, the scattering by blood is a complex phenomenon because of the high density of RBCs in blood. For a dense suspension of scatterers, uncorrelated positions of scatterers can no longer be assumed. Even under nonaggregating conditions, their positions are significantly correlated. Under this condition, the backscattered power is a function of the spatial arrangement of RBCs and is not simply proportional to the number of RBC.
Various attempts have been made to explain the relationship between the backscattered power from blood and the manner in which RBCs are packed. Until now, the scattering models typically can be divided into two categories of particle model and continuum approach (Angelsen 1980; Twersky 1987; Shung and Thieme 1993). In the particle model, the total scattering wave from an interrogated scattering medium is assumed to be the summation of all contributed scattering waves from each scatterer (Twersky 1975, 1978, 1987; Lucas and Twersky 1987; Bascom and Cobbold 1995). The continuum model recognizes that the scattering wave is determined by the density and compressibility fluctuation of the interrogated scattering medium as a source term in an inhomogeneous wave equation (Angelsen 1980).
The backscattering coefficient (BSC) is the average backscattered power per steradian from a unit volume of blood, insonated by a plane wave of unit intensity (Shung and Thieme 1993), which can be given by combining the packing factor (W) with backscattering cross section. Mo and Cobbold (1992) proposed a general particle scattering model where the BSC is expressed as follows,
W
V
H
BSC
=
s
bs(
/
e)
where H is the hematocrit. The packing factor is a measure of the orderliness in the spatial arrangement of the particles. It expresses the acoustic interference between all echoes.
In the continuum model, BSC is defined by the variance in the number of scatterers in a voxel and the average backscattering cross section. The hybrid approach was developed by combining both particle and continuum model by Mo and Cobbold (1992). A plausible insight of the hybrid model is that it considers both the resolution of a transducer and the interaction among scatterers.
The particle approach with the concept of the packing factor to account for the effect of interactions among scatterers, which was first brought up by Twersky and his associates (Berger et al. 1991), was modified by Bascom and Cobbold (1995) as follows.
1 1
]
)
1
(
1
[
)
1
(
-+-+
-=
m m mH
m
H
W
The parameter m, which is referred to as the packing dimension, is related to the physical dimension and the packing symmetry of the scatterers. A geometrical interpretation is that scatterers with m=1, 2, and 3 are represented as an infinite plane, cylinder, and sphere, respectively. Practically, the packing factor approach is easier to implement than continuum model, so it has been frequently applied to verify the results from experimental measurements or simulations.
A nonlinear relationship between hematocrit and ultrasonic backscatter of RBC suspension was found experimentally and the results are in excellent agreement with the above theoretical models which predict a scattering maximum peak at a hematocrit around 13-20 % (Shung et al. 1976, 1984; Yuan and Shung 1988a, 1988b; Shung et al. 1992). The packing
dimension was validated by the results of backscattering measurements from RBC suspension under various flow conditions. The analysis showed that the packing dimension is lower under turbulent flow than under stationary condition or uniform flow (Shung et al. 1984). Although the experimental results and the theoretical models were well corresponded to each other, it is still unclear if the packing factor approximation is fully valid in the presence of RBC aggregates because the distance of correlation among the positions of the scatters can increase significantly in case of the aggregation. Moreover, since the RBC aggregation involves the formation of long straight chains of RBCs which can branch to form complex 3-dimensional networks (Shiga et al. 1983; Samsel and Perelson 1984; Murata and Secomb 1989), it is possible that the Rayleigh scattering theory (Shung and Thieme 1993; Fontaine et al. 1999) may no longer be applicable to model the backscattering of RBC aggregates (Lockwood et al. 1991). More recently, the results from RBC suspension with very high frequencies of 30-90 MHz (Maruvada et al. 2002) showed that the frequency dependence was significantly lower than the fourth power relationship predicted by the Rayleigh theory because the wavelength in the very high frequencies is comparable to the size of a RBC.
1.2.
Specific Aims
The object of the present research is primarily placed on the studies of the ultrasonic backscatter due to the RBC aggregation from blood. There are three specific aims in this research.
The first aim is to elucidate the hemodynamic effects of the echogenic variation by blood flow disturbance. Most of the previous studies regarding this subject have been performed with RBC suspension in saline, so that the effects of RBC aggregation were not considered. Even though those approaches can provide scientifically meaningful information, it is essential that
the influence of RBC aggregation on echogenicity should be considered together, because RBCs in whole blood form aggregates as a reversible process. In order to investigate the effects of flow disturbance, pulsatile flow was generated in a flow loop with an artificial stenosis. The variations of echogenicity around a stenosis were measured with a commercial scanner and analyzed in terms of flow turbulence, acceleration, and shear rate.
The second aim is to establish a simple experimental setup for the measurement of RBC aggregation by ultrasonic backscatter. Up to now, the majority of the previous studies by ultrasound have used a mock flow loop model to simulate the RBC aggregation in human blood vessels. Indeed, those systems are suitable to study the impacts of hemodynamics on RBC aggregation, but they require a lot of blood volume and are not easily applicable to the repetitive experiments to ensure a statistical confidence using blood of small animals or human. In order to simplify the shearing system, a rotational flow system that has been used for RBC suspension study was modified. The modification of rat RBC with aggregating media was applied to obtain the experimental blood at our convenience. The usefulness of this experimental setup was verified by using an aggregating inhibitor and the comparison of different levels of aggregation among mammalian species, so that we can ensure the feasibility of this system for characterization of RBC aggregation.
Finally, we tried to elucidate hematocrit and shear rate dependency of RBC aggregation using this simplified experimental setup by rotational flow and rat RBCs in polymer solution. It has been known that the RBC aggregation is a function of hematocrit. However, there has been a discrepancy in hematocrit dependency among the previous reports, which may be due to the different experimental conditions, such as the measurement method and the shearing system. The methodological disagreement between photometry and ultrasound is still unresolved. Therefore, the extensive study for hematocrit and shear rate (including stasis) dependency may provide a clue to explain the unsolved problem.
1.3.
Thesis Outlines
There are five chapters additional to the chapter of introduction.
Chapter 2 shows the influence of flow disturbance on ultrasonic backscatter. The ultrasonic measurements from porcine blood were performed by a commercial scanner. The effects of hemodynamic parameters such as flow turbulence, acceleration, and shear rate on echogenicity and RBC aggregation were investigated downstream and upstream of a stenosis in a mock flow loop.
Chapter 3 is dedicated to the investigation of the difference of RBC aggregation among mammalian species by ultrasound. Human, horse, and rat blood were employed as testing mammals because these three species have distinct differences in their RBC aggregation characteristics. The method for the backscattering measurements including the experimental setup is described in detail in this chapter.
Chapter 4 demonstrates that the rotational flow as a shearing system is a good tool to study rat RBC aggregation in aggregating media. In this chapter, shear rate and hematocrit dependency of rat RBC aggregation were determined by ultrasonic backscatter.
Chapter 5 presents the pharmacological applications for RBC aggregation and the usefulness of the rotational flow with rat RBCs in polymer solution. In this chapter, we demonstrated that the backscattered power decreased with the concentration of an aggregation inhibitor.
Chapter 2
ULTRASONIC OBSERVATION OF BLOOD DISTURBANCE
IN A STENOSED TUBE
2.1.
Introduction
Ultrasound as a real time imaging technique has been used to visualize blood flow and to study hematology and hemodynamics (Shung et al. 1984; Paeng and Shung 2003; Shung and Paeng 2003). Ultrasonic backscatter from blood has been known to be highly dependent on red cell aggregation, which is affected by hemodynamic parameters including shear rate and turbulence (Sigel et al. 1983; Shung et al. 1984) as well as non-hemodynamic parameters including fibrinogen concentration, hematocrit, and temperature (Yuan and Shung 1988a, 1988b). When echogenicity variation over a pulsatile cycle is analyzed, hemodynamic parameters are the dominant factors for a blood sample where non-hemodynamic parameters do not change appreciably. Under such a condition, the combined effects of shear rate and flow acceleration have been hypothesized to enhance the RBC aggregation and were verified based on the experimental studies in a mock flow loop (Cao et al. 2001; Paeng et al. 2001; Paeng and Shung 2003, Paeng et al. 2004b, 2004c).
There have been many studies carried out to investigate hemodynamics and hemorheology in a stenosed tube using ultrasound (Bascom et al. 1997; Cloutier et al. 1995, 1996, 2000). Most of the studies have been focused on turbulence induced by a stenosis and the effects of blood turbulence on the Doppler power or power Doppler imaging from RBC suspension. However, RBC suspension is not an ideal medium to study blood flow in vivo since red cells do not aggregate without mediating proteins in plasma. Moreover, Doppler power
measurements are restricted by the position of the sampling volume, and power Doppler imaging may not be sensitive enough to visualize blood flow and hemodynamics compared to B-mode images. In this study in a stenosed tube, porcine whole blood, which mimics human blood in many aspects, was used to examine the influence of hemodynamic parameters on B-mode echogenicity.
In the presence of a stenosis that can be formed by an atherosclerotic plaque in the blood vessel wall, it is known that the blood flow is disturbed and the distribution of RBC rouleaux is thus changed by hemodynamic conditions. In the post-stenotic region, ultrasonic echogenicity may reflect the complicated hemorheology including the effects of shear rate, flow turbulence, and acceleration on RBC aggregation under pulsatile flow. Since it is difficult to estimate the effects of these three hemodynamic parameters independently, the contribution of each parameter to ultrasonic echogenicity is not fully understood. This chapter is focused on analyzing how each hemodynamic parameter influences echogenicity variation from the experiments performed in a mock flow loop with an artificial eccentric stenosis under pulsatile flow.
Flow turbulence is known to increase ultrasonic backscatter. The rationale has been analyzed theoretically (Bascom and Cobbold 1995; Lucas and Twersky 1987; Mo and Cobbold 1992). The results show that the scattering from a packed distribution of small scatterers is related to fluctuation of the number and size of the scatterers in a volume rather than the number itself. The possibility of turbulence is greatly increased by the presence of a stenosis in the artery. Earlier experimental results suggested the enhancement of ultrasonic backscatter by turbulence (Yuan and Shung 1988; Shung et al. 1992). Later, Cloutier et al. (1995, 1996, 2000) demonstrated that flow turbulence in the post-stenotic region increased the Doppler power from RBC suspension. Bascom et al. (1997) used a photochromic dye technique to examine the flow turbulence and the nature of the flow field downstream of an asymmetric stenosis under both
steady and pulsatile flow conditions using human RBC suspension. They confirmed that the distal flow field downstream from the stenosis could be divided into four primary zones, namely stable jet, transition, turbulence, and relaminarization zones.
Shear rate has been suggested as the most important hemodynamic parameter that affects RBC aggregation. Since Sigel et al. (1983) first showed that ultrasonic backscatter was dependent on shear rate, many studies have been published to confirm this observation. There have been several studies performed under pulsatile flow at different speeds and flow-cycle repetition rates to elucidate hemodynamic effects on RBC aggregation using ultrasound (Cao et al. 2001; Paeng et al. 2001; Paeng et al. 2004b). Several phenomena are well explained by a shear-rate analysis, but others are not. The radial variation of echogenicity and the decrease of echogenicity with increasing mean speed can be attributed to shear rate, but the cyclic variation of echogenicity cannot be explained by shear rate alone. Therefore, it was first hypothesized and experimentally verified by them that flow acceleration is another factor that may cause enhancement of the aggregation resulted from the higher probability of red cell interaction due to the different inertia and compressional forces.
In addition, the “black hole” (BLH) phenomenon, a hypoechoic central hole with a surrounding hyperechoic ring in cross-sectional ultrasonic B-mode images of whole blood in the tube, was reported under steady flow (Yuan and Shung 1989). More studies followed for a better understanding of its mechanism under pulsatile flow (Cao et al. 2001; Paeng et al. 2001; Paeng et al. 2004b). The present experimental analysis will show the temporal and regional variation of the BLH phenomenon downstream from a stenosis, which may yield more insight of the BLH phenomenon. The previous experiments using an Aloka 280 scanner with a 7.5 MHz transducer (Paeng et al. 2004a) also showed that the bright parabolic profile was observed downstream of a stenosis during the accelerating period. This observation will be further examined in more detail for a better understanding of its origin.
The “bright ring” (BRR), an expanding and collapsing hyperechoic ring was observed in cross-sectional B-mode images in the previous studies (Paeng and Shung 2003, Paeng et al. 2004b, 2004c). The present study showed the BRR profiles in the cross-sectional views and the parabolic or eddy-like profiles in the longitudinal images upstream of a stenosis during diastole of each pulsatile cycle. The BRR and the parabolic profiles were reconstructed to form 3-dimensional animations, which have never been reported.
The aims of the first part in this chapter are to measure ultrasonic echogenicity from porcine whole blood, and to examine the effects of essential hemodynamic parameters on RBC aggregation and ultrasonic echogenicity downstream of a stenosis at different flow-cycle repetition rates, where shear rate, flow turbulence and acceleration can be considered together.
The second part of this chapter is focused on echogenicity variation upstream of a stenosis. That is because the weak backward flow during diastole and the sudden narrowness of blood vessels may induce disturbance of blood flow and the distribution of RBC rouleaux upstream of a stenosis. Until now, there have been several studies on how the backscattering would be changed downstream of a stenosis (Cloutier et al. 1995, 2000; Bascom et al. 1997; Paeng et al. 2004a), but there has been no exhaustive analysis upstream of a stenosis.
2.2.
Materials and Methods
2.2.1. Blood Preparation
In this experiment, porcine blood was used instead of human blood because it is easier to obtain and has many hematological properties similar to those of human blood, including average RBC size, fibrinogen concentration, and RBC aggregation tendency (Yuan and Shung 1988a, 1988b). Fresh porcine blood was collected from a local slaughterhouse in 4 L bottles that were prepared with a solution consisting of 12 g ethylenediamine tetraacetic acid (EDTA)
dipotassium salt dissolved in 120 ml of saline for anticoagulation. RBCs and plasma were separated by centrifuging. The buffy layers were separated by centrifugation and the hematocrit was adjusted to 40 % by remixing the RBCs with the autologous plasma. RBC suspension was used to study the origin of the variation of echogenicity because rouleaux formation does not occur in the suspension. To prepare the RBC suspension, the plasma and buffy coat were removed and the red cells were washed twice with 0.9 % normal saline solution buffered to pH 7.4. Then, the washed concentrated RBCs were reconstituted with 0.85 % saline solution to 40 % hematocrit. To prevent crenation of the red cells, 0.5 % bovine albumin was added to the saline solution. The experiments were completed within 36 hours after collecting the blood. The detailed procedures for obtaining fresh porcine blood and preparing blood were also described in Paeng et al. (2001).
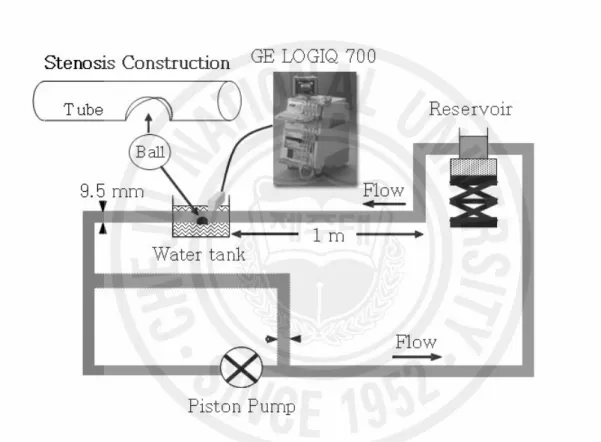
2.2.2. Flow Model
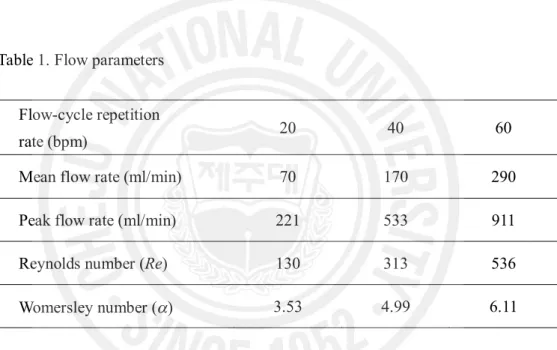
A schematic representation of the flow system for this study is illustrated in Fig. 2. To simulate an eccentric stenosis in an artery, a rubber ball (diameter = 1.5 cm) was inserted into a round hole in a rigid tube (inner diameter = 0.95 cm) and glued to it using silicone. The relative size of the ball and the round hole determined the percentage of stenosis, and 70 % of an eccentric stenosis was created for the experiments in this chapter. Three flow-cycle repetition rates of pulsatile flow [20, 40 and 60 bpm (beat per minute)] were generated using a piston pump (Harvard Apparatus, South Natick, MA). The flow parameters such as flow rate, Reynolds number, and Womersley number are presented in Table 1. One reservoir was used to remove bubbles and to store blood. A magnetic stirrer at the bottom of the reservoir prevented the blood from settling. The inlet length of a polystyrene tube (i.d. 9.5 mm, o.d. 11.1 mm, Nalgene, Rochester, NY) was 1 m, which ensured a fully developed laminar flow before the stenosis. A bifurcation of the tube was constructed and included in the flow loop so that the flow rate could
be controlled by opening and closing this bifurcation. The blood was circulated at least for 30 minutes to remove bubbles inside the loop and reach a room temperature of 25℃ before any measurements. The presence of the bubbles could be checked from B-mode images or visually in the top side of the tube. The mock flow loop used in this experiment was also described in detail by Paeng et al. (2001).
2.2.3. Ultrasound System and Data Analysis
A LOGIQ 700 Expert system (GE, Milwaukee, WI) with an M12L linear transducer was used to study backscattering from porcine blood in a stenosed tube. The transducer frequency was set to 13 MHz. Fundamental B-mode images, duplex images and color Doppler images were obtained and used to analyze echogenicity with flow speed. Longitudinal B-mode images along the tube were obtained from 1D to 6D (1 to 6 diameters of the tube) downstream. The transducer was placed parallel to the tube for longitudinal view and perpendicularly for cross-sectional imaging to observe the BRR phenomenon upstream. Video images were stored on videotapes and digitized at 30 frames/second using a video-editing system on a personal computer for further analysis. For better visualization of B-mode snapshots, the contrast in an image was increased by clipping of the darkest and lightest parts of the histogram from the original image. To increase the signal-to-noise ratio for better visualization of the echogenicity at 1, 2, 3 and 4D downstream of a stenosis, an ensemble average over 7 pulsatile cycles was taken, and then the temporal and regional variations of echogenicity were calculated. The echogenicity was normalized with respect to the maximum gray scale of 256. The velocity profile was computed from the Doppler spectrograms of duplex imaging. The Doppler spectrograms were taken at the center of the stenosed lumen, where the Doppler frequency was 6.2 MHz, pulse repetition rate was 6010 Hz, and sample spacing was 1 mm. The MATLAB®
Table 1. Flow parameters
Flow-cycle repetition
rate (bpm) 20 40 60
Mean flow rate (ml/min) 70 170 290 Peak flow rate (ml/min) 221 533 911 Reynolds number (Re) 130 313 536 Womersley number (a) 3.53 4.99 6.11
The flow rates were calculated from the velocity profiles by Womersley’s analysis (1995). Re is defined based on the tube inlet diameter and the instantaneous mean velocity at peak flow rate. The approxiamate values of Re and a were calculated with the kinematic viscosity of 0.038 cm2/s (see appendix).
2.3.
Downstream of an Eccentric Stenosis
2.3.1. Results
2.3.1.1. B-mode Snapshots at Accelerating Phase
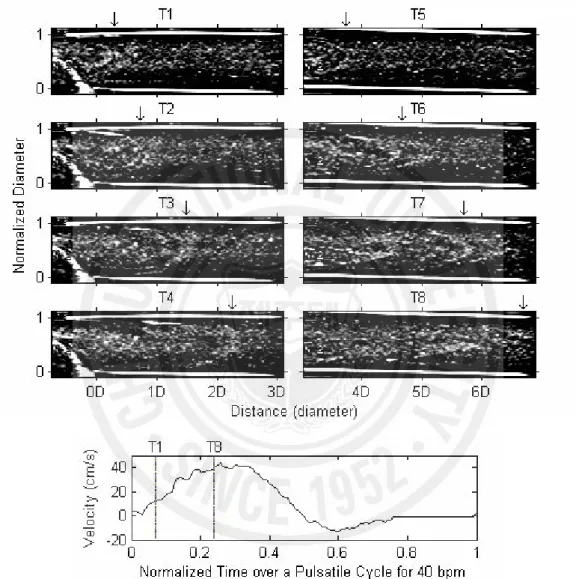
Fig. 3 shows eight consecutive B-mode images at 1D to 3D (T1 ~ T4) and 4D to 6D (T5 ~ T8) downstream during systole at 40 bpm. These snapshot images were extracted from the digitized video files and the contrast was enhanced for better visualization. The bottom panel shows the velocity profile at the stenotic site, which was computed from the Doppler specrograms. The two vertical lines indicate the corresponding times of the first snapshot image (T1) and the last one (T8). As indicated by the arrows on the top of each panel, apparent shift of the echogenic profile can be seen along the blood flow direction. The approximate speed of this profile was calculated to be 20 cm/sec from T1 to T4. This profile was formed only across the throat of the stenosis and appeared to have a round shape near the stenosis. It expanded across the full diameter of the tube further downstream, becoming sharper and more irregular. This echogenic profile appeared at every accelerating phase and moved along the blood flow direction during systole. At 20 and 40 bpm, these profiles were apparent, but not at 60 bpm.
2.3.1.2. ‘Black Hole’ Phenomenon Downstream
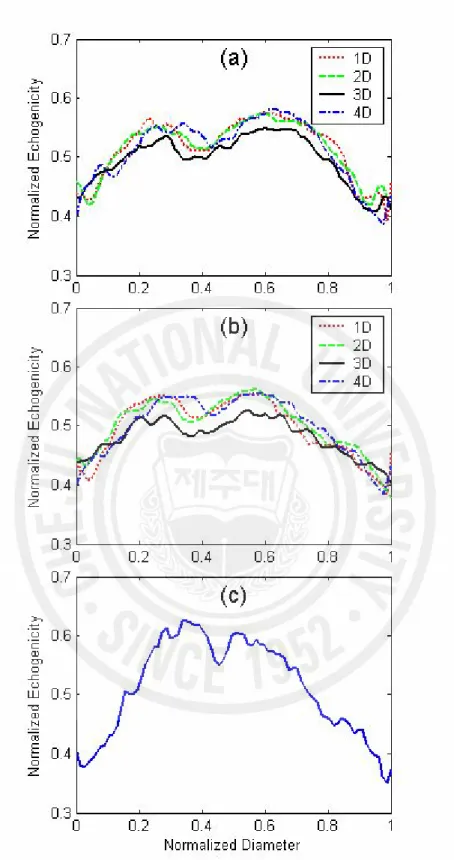
The BLH phenomenon, a central echo-poor zone surrounded by a bright hyperechoic zone, was observed downstream of a stenosis. Fig. 4 (a) and (b) show the line plots of temporal mean echogenicity over a cycle across the tube diameter for 20 and 40 bpm, respectively, which were calculated from the ensemble average of 7 pulsatile cycles at 1, 2, 3, and 4D downstream of the stenosis. At four sites downstream from the stenosis, the BLH phenomenon was apparent for both 20 and 40 bpm. At both flow-cycle repetition rates, echogenicity at 3D downstream was lower than those of the other sites. Fig. 4 (c) shows the BLH 2D upstream of the stenosis during
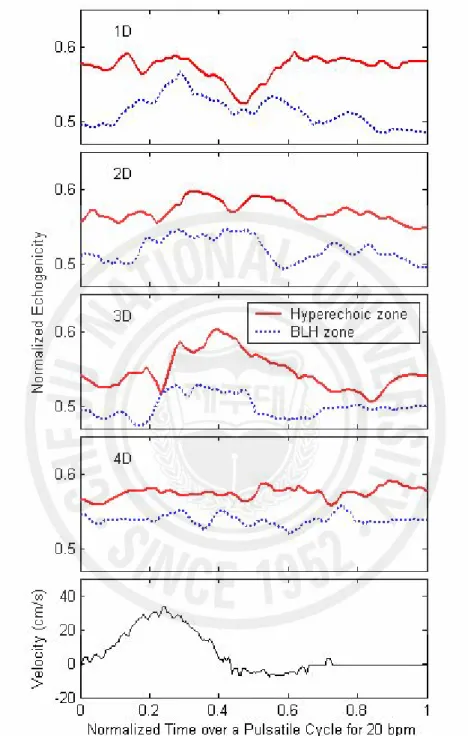
systole at 20 bpm. The diameter of BLH upstream was much smaller than that downstream. The instantaneous echogenicity in the central hypoechoic zone and the surrounding hyperechoic ring is displayed as a function of normalized time over a cycle for 20 bpm at different positions (1D ~ 4D) in Fig. 5. The differences of the normalized echogenicity between the two lines show the contrast of the BLH. The variation of these differences was large at different positions during 0.3 ~ 0.5 of normalized time. Specifically, both echogenicity at the surrounding hyperechoic zone and the differences between the two lines were largest at 3D and smallest at 1D. However the variation over a cycle at 4D was minimal.
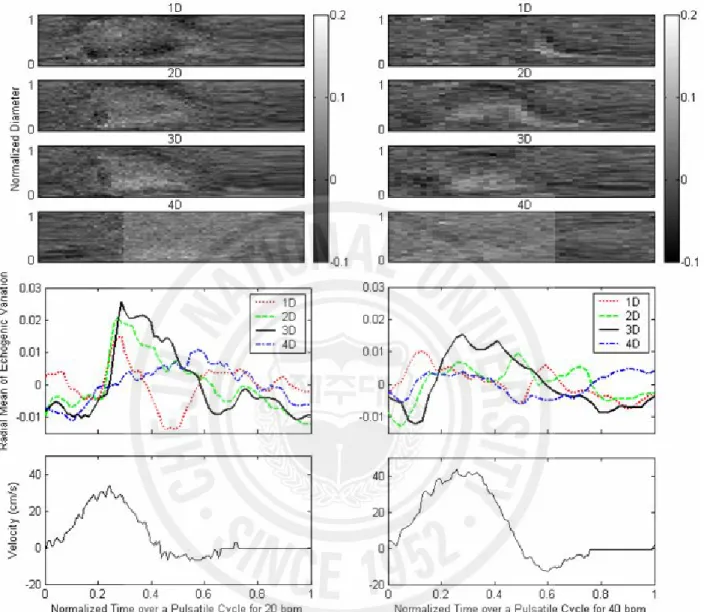
2.3.1.3. Cyclic and Local Variation of Echogenicity
Fig. 6 shows the cyclic and local variation of the echogenicity deviation from the temporal mean echogenicity by subtraction of the mean value in Fig. 4 from the instantaneous echogenicity at different positions downstream of the stenosis. All x-axes represent the normalized time over one pulsatile cycle for each flow-cycle repetition rate. The y-axes of the upper four panels represent the normalized tube diameter, and the gray scales show the echogenicity deviation from the temporal mean echogenicity. The middle panel shows the radial mean of echogenicity deviation over a tube diameter calculated from the upper four panels. The cyclic variation of echogenicity was found to be larger from 1D, reach a maximum at 3D, and be smallest at 4D downstream during late systole. This pattern of cyclic and local variation was observed both at 20 and 40 bpm, but not at 60 bpm. A profile that looked like a bright tail in 1D and 2D in the upper panels for 40 bpm was seen during 0.5 ~ 0.7 of normalized time. These bright tails were not seen at 20 bpm but were clearer at 60 bpm, though the results are not given in this paper. Fig. 7 shows the snap shots of the B-mode images downstream of the stenosis during diastole at 40 bpm. The time interval of each image is about 0.1 second from T1 to T4. Apparent shift of the echogenic profile which was oriented more obliquely, could be seen along
the reverse flow direction, which was also seen in Fig. 6 as a bright tail. The profile was observed for every cycle.
2.3.1.4. RBC Suspension Experiments
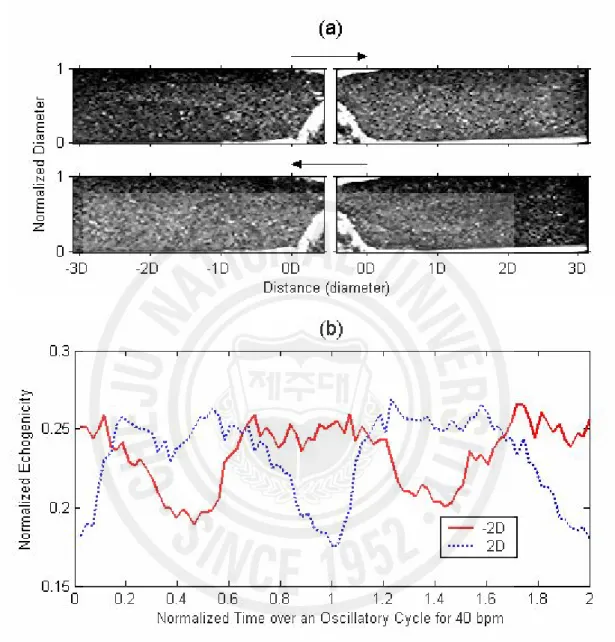
It is well known that the turbulence significantly increases the ultrasound echogenicity in RBC suspension (Yuan and Shung 1988; Shung et al. 1992; Cloutier et al. 1995). The experiment for RBC suspension was performed under oscillatory flow as well as pulsatile flow. Fig. 8 (a) shows the B-mode images from RBC suspension under oscillatory flow. Echogenicity was increased in the post-stenotic region, but decreased upstream during forward blood flow. During backward flow, this was reversed, and higher echogenicity was observed in the pre-stenotic region. Echogenicity from RBC suspension was observed to be out of phase between post- and pre-stenotic sites, which is well presented by the line plots of normalized echogenicity in Fig. 8 (b). The lines were calculated from averaging the radial echogenicity at 2D upstream and downstream as a function of normalized time over two oscillatory cycles. The normalized echogenicity from RBC suspension was smaller (0.18 ~ 0.25) than that from whole blood (0.4~0.6) as shown in Figs. 4 and 5, due to a lack of RBC rouleaux. Under pulsatile flow, the brighter echogenicity was observed only downstream of a stenosis at systole (data are not shown here).
Fig. 3. Consecutive snap shots of B-mode images during accelerating phase of pulsatile flow (40 bpm) downstream of a stenosis. Arrows indicate the head of parabolic profiles moving down along the flow direction. A speed profile in cm/s was measured from the mean Doppler frequencies at the throat of the stenotic site.
Fig. 4. The line plots of the temporal mean echogenicity over a pulsatile cycle for (a) 20 bpm and (b) 40 bpm at four sites of 1D to 4D downstream. (c) The line plot of echogenicity 2D upstream for 20 bpm.
Fig. 5. The instantaneous echogenicity at the surrounding hyperechoic zone (solid line) and the BLH zone (dotted line) from 1D to 4D downstream for 20 bpm. The speed profile in cm/s was measured from the mean Doppler frequencies at the throat of the stenotic site.
Fig. 6. The cyclic variation of the echogenicity deviation obtained by subtraction of the temporal mean echogenicity (as shown in Fig. 4) from the instantaneous echogenicity at different sites from 1D to 4D downstream of a stenosis under pulsatile flow for 20 and 40 bpm. The middle panel shows the radial mean of echogenicity deviation over a tube diameter calculated from the upper four panels. The speed profiles in cm/s were measured from the mean Doppler frequencies at the throat of the stenotic site.
Fig. 7. Snap shots of B-mode images from whole porcine blood during diastole of pulsatile flow (40 bpm) downstream of a stenosis. The time interval of each image is about 0.1 second from T1 to T4. The speed profile in cm/s was measured from the mean Doppler frequencies at the throat of the stenotic site.
Fig. 8. (a) Snap shots of B-mode images from RBC suspension extracted from forward flow and backward flow under oscillatory flow of 40 bpm. The arrows indicate blood flow direction. (b) Radially averaged echogenicity 2D upstream and downstream over two oscillatory cycles.
2.3.2. Discussion
To investigate the characteristics of the echogenic variation downstream of a stenosis, ultrasound B-mode images from porcine whole blood in a mock flow loop were analyzed from the hemodynamic points of view, such as shear rate, flow turbulence, and flow acceleration. Several interesting phenomena, which were not previously reported, were observed.
2.3.2.1. Flow Acceleration
In the previous studies (Cao et al. 2001; Paeng et al. 2001; Paeng et al. 2004b), it was proposed that flow acceleration is another important factor affecting RBC aggregation in addition to shear rate. When the flow is accelerating, there are more chances for red cells to interact with each other to form larger rouleaux, resulting in greater scattering. Rouleaux of different sizes may experience different accelerations depending on their size and mass during early systole (Cao et al. 2001), which affect the chances for the collision of cells (Lim et al. 1997). Red cells may also come into contact with one another because of the compressional forces during acceleration. The experimental results in Fig. 3 show the formation of an echogenic parabolic profile during systole of every pulsatile cycle and its migration, which can be explained by the effects of flow acceleration. In addition to flow acceleration, flow turbulence may be another factor causing the echogenic profile, since blood flow was disturbed downstream of a severe stenosis. However, flow turbulence should decrease further downstream along the flow direction, while the bright parabolic profiles persisted even to 6D downstream. Therefore, flow turbulence could be ruled out to be the major reason responsible for these profiles, suggesting that flow acceleration is more likely to be the major cause of the bright parabolic profiles.
Figs. 4 and 5 show the BLH phenomenon downstream of a stenosis. The formation of the BLH has been hypothesized to arise from the maximized red cell aggregation at an optimal shear rate, since the shear rate is smaller at the center and higher near the vessel wall than the optimal shear rate. Shehada et al. (1994) suggested that lower shear rate (<0.05 s-1) should
produce less aggregation at the center of the tube, while the maximum aggregation occurred at the surrounding area where shear rate was in the range of 0.05 ~ 2 s-1. However, the BLH
formations in the previous studies were observed under laminar flow conditions. In case of a post-stenotic flow field, turbulence might be generated so that the effect of turbulent flow should be also considered in addition to shear rate. Although the BLH observed under these circumstances is similar in nature to the previously reported BLH phenomenon under laminar flow, the mechanism of its formation and development may be different. This assumption may be supported by the broader BLH downstream in Fig. 4 (a) and (b) compared to the one upstream during systole in Fig. 4 (c). The temporal variation of the BLH over a cycle showed the different patterns at the different positions as shown in Fig. 5. The higher contrast of the BLH at 3D during 0.3~0.5 normalized time may be thought to be caused by locally maximized flow turbulence. The higher contrast of the BLH at 1D from diastole to early systole may be due to the higher backward flow during diastole and the higher accelerating jet flow during early systole near the throat of the stenosis. The fact that the BLH formed and remained over a pulsatile cycle under flow turbulence in the post-stenotic region was unexpected and requires further examination.
A large-eddy simulation (Mittal et al. 2001) by a computational modeling of turbulent arterial flows showed that the flow immediately downstream of the stenosis was transitional in nature, but the spectra indicated the presence of fully turbulent flow farther downstream. Three-dimentional numerical simulations by Mallinger and Drikakis (2002) also showed fluctuations of the velocity and wall shear stress farther downstream. These studies indicate that, when the
Reynolds number is higher than the critical value at a certain distance from the stenosis, turbulent flow may occur locally at the position far from the stenosis and become weaker further downstream along the flow direction. Fig. 9 shows the proposed scheme for formation of turbulent flow downstream of a stenosis. This may explain the sudden increase of echogenic variation 3D downstream in Figs. 5 and 6. Our experimental results and interpretation are consistent with the experimental investigation by Bascom et al. (1997) and Ahmed (1998). The maximum turbulence was observed around 5D downstream by Cloutier et al. (1996) using power Doppler imaging, which also supports our explanation for the result of localized flow turbulence far from the stenosis. According to Yellin (1966), systolic acceleration may be laminar regardless of the large value of the instantaneous Reynolds number, while deceleration probably produces disturbed flow, but not turbulent nor highly dissipative flow. This phenomenon is also well observed in Fig. 6, which shows higher echogenic variation during the decelerating period of systolic phase.
Up to now, there has not been any experimental observation indicating that flow turbulence increases ultrasound echogenicity in whole blood. Although a previous experiment using power Doppler angiography was done with whole blood at a concentric stenosis with an 80 % area reduction at 70 bpm and flow rate of 100 mL/min (Cloutier et al. 2000), no echogenic variation was detected downstream of the stenosis. The difference in these measurements might be due to the difference in flow velocity, flow-cycle repetition rate and the shape of the stenosis. The analysis of our experimental results shows that echogenicity could be increased due to the effect of turbulence in whole blood.
Turbulent flow significantly influences endothelial turnover that has been causally linked to the development of focal atherosclerosis (Berger and Jou 2000; Davies et al. 1986; Ku et al. 1985) and can contribute to the formation of thrombi (Asada and Sumiyoshi 1999; Johnson et al.
1993; Stein and Sabbah 1974). Therefore, the results from the present study suggest that an analysis of ultraosund echogenicity may be a potential tool for the detection of turbulence and turbulence intensity.
2.3.2.3. Echogenic Variation at Diastole
The bright streamline was observed to move with the boundary between the two disturbed flow zones downstream of the stenosis from our previous experiments on RBC suspension (Paeng et al. 2004a). According to Bascom et al. (1997), near the post-stenotic region, stable jet flow at the throat of the stenosis and low velocity on the stenosed side formed a dividing line that was observed during flow acceleration in RBC suspension. However, the bright oblique profile as shown in Fig. 7 in the present study was observed during weak backward flow at diastole in whole blood, and this is different from the bright streamline from RBC suspension. This phenomenon that shows the echogenic oblique profile seems to result from the regional RBC aggregation owing to the different acceleration and compressional forces between the stenosed side and the throat of the stenosis during backward flow.
2.3.2.4. Echogenic Variation in RBC Suspension
Because RBC aggregation cannot form in RBC suspension, the echogenic variations in Fig. 8 are small and most likely due to the presence of blood flow turbulence, in agreement with the report by Cloutier et al. (2000). In spite of the obvious echogenic variations in the RBC suspension, local variation of echogenicity was not observed, while it was shown in the whole blood experiments. This discrepancy might be due to the fact that turbulent flow may be formed more easily in RBC suspension because of its low viscosity. More studies are necessary to explain these differences.
2.3.2.5. Study Limitations
It should be noted that our results have inherent limitations due to the experimental setups. B-mode images of a commercialized ultrasound scanner are highly nonlinear so that our study is a qualitative analysis rather than quantitative analysis. The results cannot be quantitatively compared to other results without calibration. However, this does not mean that these results cannot be compared within our results and analyzed quantitatively, as long as all B-mode images were obtained under the same conditions using the same scanner. As a base line study, echogenicity from RBC suspension was measured within the range of flow speed up to 80 cm/s at the center of the tube under steady laminar flow and found to be similar. Our experiments were performed in in vitro mock flow loop, so the results might be different from those in in
vivo blood. Human heart stroke rates are over 60 bpm, but our results were obtained from lower
flow-cycle repetition rates. The blood flow velocity range was also lower in our experiments than that in some arteries. However, the possibility of the similar observation in human blood in
vivo still exists, since the tendency of RBC aggregation is different in blood vessels in vivo. The
cyclic variation of echogenicity from blood of human carotid arteries was observed with harmonic imaging at the high flow speeds (Paeng et al., 2003). Due to the low speed of blood flow in this study, turbulence might not occur during decelerating phase but flow disturbance might be present. The intensity of turbulence in whole blood due to a stenosis needs to be further investigated with a detailed velocity field for better understanding.
2.4.
Upstream of an Eccentric Stenosis
2.4.1. Results and Discussion
2.4.1.1. B-mode and Duplex Image Snapshots Upstream
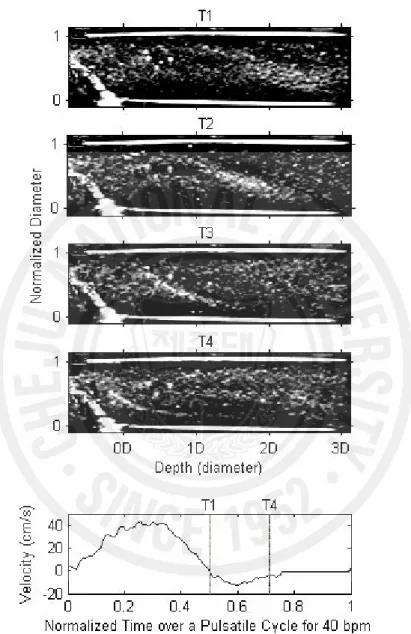
Fig. 10 displays typical B-mode images upstream of a stenosis during diastole at different stroke rates, where bright parabolic or eddy-like profiles are visually identified. The bright parabolic shape was well observed at the lowest stroke rate of 20 bpm, which appeared at an early diastolic period and then disappeared at the accelerating phase. The parabolic profile became larger and stronger as approaching towards the late stage of diastole. At 40 bpm, the echogenicity distribution was more complicated, showing eddy-like patterns. As the stroke rate rose to 60 bpm, the bright parabola became smaller compared to the cases with the lower stroke rates, and the contrast of echogenicity at this stroke rate was apparently reduced. Fig. 11 shows the duplex image at 40 bpm. The B-mode image was obtained at diastole. The Doppler spectrogram was taken from the center of the tube at a distance of 3D upstream from the stenosis. The eddy-like patterns of echogenicity were observed in the B-mode image during the period of a minor positive peak in Doppler spectrogram. When the stroke rate decreased to 20 bpm, this minor peak became weaker. It was found that B-mode images upstream of a stenosis repeatedly showed the bright parabolic profiles or the eddy-like flow patterns at diastole in every pulsatile cycle depending on stroke rates.
2.4.1.2. ‘Black Hole’ Phenomenon Upstream
Fig. 12 is the ultrasound image of averaging three consecutive snapshots taken at the time of the systolic peak at 20 bpm. The averaging process highlights the BLH phenomenon, a central echo-poor zone surrounded by a hyperechoic zone (Yuan and Shung 1988a, 1988b; Paeng et al. 2004b, 2004c), seen at the center of the tube along the flow direction. As shown in
the left panel of Fig. 12, the radial profile in which ten pixels within the two lines marked in the right panel were averaged along the axial direction also clearly manifests the BLH. The BLH phenomenon was quite apparent during systole at 20 bpm, but dimmed at higher stroke rates. In spite of the flow disturbance during diastole, the BLH appeared repeatedly at every pulsatile cycle. These would be the first observation of the BLH under the condition of a stenosis, even if there have been many studies on the BLH phenomenon since it was first reported by Yuan and Shung (1989).
2.4.1.3. ‘Bright Ring’ Phenomenon
To better understand the BRR and parabolic profile, a 3-dimensional image as shown in Fig. 13 (a) was reconstructed from a longitudinal imaging in Fig. 13 (b) and three cross-sectional imaging in Fig. 13 (c) at the different locations upstream of the stenosis during diastole at 20 bpm. In the longitudinal images, a parabolic profile was formed at diastole and disappeared at systole. This profile was stretched out over a distance of 3D upstream from the stenosis and maximized at diastole. In cross-sectional images, a bright ring was radially expanding from the tube center to the tube wall and then shrinking, periodically. These cross-sectional images were taken as video images from the three different sites at intervals of about 1 cm as marked by arrows in Fig. 13 (b). From these four different video images, it was possible to reconstruct a 3-dimensional image using MATLAB, showing the dynamic profiles of US echogenicity in 3-dimension.
Three-dimensional animation that cannot be shown here suggested that the BRR in the cross sectional images appeared as a parabolic or eddy-like profile in the longitudinal view and that the BRR and the parabolic profile were actually of the same phenomenon. Thus a better understanding of the BRR and parabolic profile was made possible by the 3-dimensional animation. Fig. 14 shows the snap shots of the animation over a pulsatile cycle. The contrast
between the bright profile and the surrounding region may be explained by the temporal and spatial variation of RBC rouleaux distribution caused by the compound effects of pulsatile flow and a stenosis. During systole, the size of rouleaux around the tube center is greater than that near the tube wall because of the smaller shear rate and flow acceleration. During diastole, the developed RBC rouleaux around the tube center upstream might be partially broken and pushed back due to the weak backward flow through the narrow lumen at stenotic region. Finally these rouleaux could be accumulated toward the flow margin or align themselves along the flow margin. Although these are similar to those observed from the pulsatile flow without a stenosis, its origin is different. This BRR arose from the blood flow disturbance caused by reversed blood flow, while the BRR in a straight tube without stenosis converged from the periphery to the center of the tube and eventually collapsed during a pulsatile cycle in the cross-sectional view, which might be caused by the combined effects of shear rate and acceleration.
The moving structures in these ultrasound B-mode images have little to do with the pattern of blood flow, but reflect the distribution of RBC rouleaux. In Fig. 15, the velocity field of blood flow extracted from the color Doppler images is shown and they are quite different from the temporal changes of RBC rouleaux as shown in Fig. 14. According to these color Doppler images at 20 bpm, the velocity profile during a cycle can be divided into the periods of positive flow, negative flow, and an intermediate stage. The flow speed at the center of tube was higher than near the tube wall during systole. During the period of negative flow, RBC rouleaux were disturbed to form parabolic profile, which was maintained during stasis. At the late stage of negative flow, the blood flow almost stopped, and the parabolic profile extended to 3D upstream. When the positive flow began at early systole, the parabolic profile was rapidly broken up.