ANTIMICROBIALAGENTS ANDCHEMOTHERAPY, Feb. 2010, p. 931–933 Vol. 54, No. 2 0066-4804/10/$12.00 doi:10.1128/AAC.01145-09
Copyright © 2010, American Society for Microbiology. All Rights Reserved.
Pharmacokinetics of Itraconazole in Diabetic Rats
䌤
Unji Lee,
1Young H. Choi,
2So H. Kim,
3and Byung K. Lee
1*
College of Pharmacy, Ewha Womans University, 11-1, Daehyun-Dong, Seodaemun-Gu, Seoul 120-750, South Korea1; College of Pharmacy and Research Institute of Pharmaceutical Sciences, Seoul National University, San 56-1, Shinlim-Dong, Kwanak-Gu,
Seoul 151-742, South Korea2; and Department of Pharmacology, College of Dentistry and Research Institute of Oral Science, Kangnung-Wonju National University, 120, Gangneung Daehangno, Gangneung, Kyunggi-Do 210-702, South Korea3
Received 11 August 2009/Returned for modification 7 September 2009/Accepted 27 November 2009
After intravenous or oral administration of 10 mg/kg itraconazole to rats with streptozotocin-induced diabetes mellitus and to control rats, the total area under the plasma concentration-time curve from time 0 to 24 h (AUC0–24) for itraconazole and that for its metabolite, 7-hydroxyitraconazole, were similar
between the two groups of rats. This may be explained by the comparable hepatic and intestinal intrinsic clearance rates for the disappearance of itraconazole and the formation of 7-hydroxyitraconazole in both groups of rats.
Itraconazole is a prototype triazole antifungal agent. Super-ficial fungal infections of the feet among elderly patients with diabetes mellitus are common, and itraconazole has been shown to have acceptable cure rates (12). In humans, hepatic cytochrome P450 3A4 (CYP3A4) appears to be involved in the metabolism of itraconazole to form several metabolites, in-cluding 7-hydroxyitraconazole (9). No in vivo studies of itra-conazole metabolism in rats have been reported. Hepatic CYP3A1 (5) and CYP3A2 (10) proteins and/or mRNA levels have been shown to increase in male Sprague-Dawley rats with diabetes mellitus induced by streptozotocin (DMIS rats), but there are no reports on the intestinal CYP3A subfamily in DMIS rats. Furthermore, the pharmacokinetics of itraconazole and 7-hydroxyitraconazole may differ between intravenously and orally administered itraconazole in DMIS rats.
In the present study, itraconazole metabolism was examined in DMIS rats as an animal model of diabetes mellitus. We
report the pharmacokinetics of itraconazole and 7-hydroxyitra-conazole after intravenous or oral administration in DMIS rats compared with those in control rats. Our results show that hepatic CYP3A1/2 is responsible for the metabolism of itra-conazole and the formation of 7-hydroxyitraitra-conazole in rats and that the expression of the intestinal CYP3A1/2 protein was not altered in DMIS rats compared with that in control rats, based on Western blot analysis.
Overall, the methods used in this study were similar to those described in previous reports. The chemicals used in addition to itraconazole, the methods of housing and handling the male Sprague-Dawley rats (7 to 9 weeks old, weighing 230 to 280 g), the intravenous and oral administration of itraconazole, the measurement of plasma protein binding values of itraconazole by equilibrium dialysis, and the high-performance liquid chro-matographic analysis of itraconazole and 7-hydroxyitracon-azole were all performed as described previously (1, 11).
Dia-* Corresponding author. Mailing address: College of Pharmacy, Ewha Womans University, 11-1, Daehyun-Dong, Seodaemun-Gu, Seoul 120-750, South Korea. Phone: 82 2 32776649. Fax: 82 2 32772851. E-mail: [email protected].
䌤Published ahead of print on 7 December 2009.
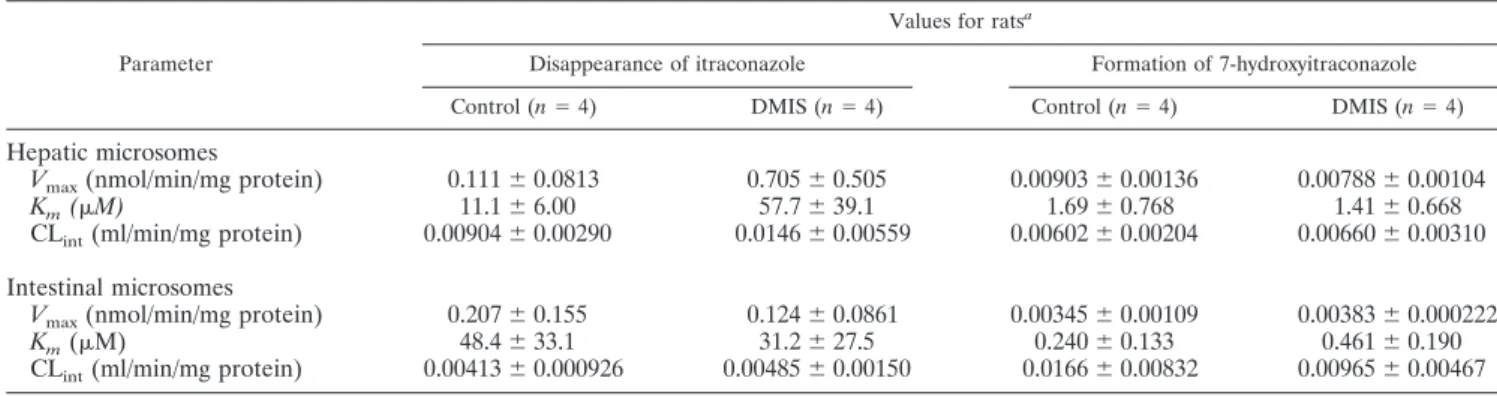
TABLE 1. Vmax, Km, and CLintvalues for the disappearance of itraconazole and formation of 7-hydroxyitraconazole in hepatic and intestinal
microsomes from control and DMIS rats
Parameter
Values for ratsa
Disappearance of itraconazole Formation of 7-hydroxyitraconazole
Control (n⫽ 4) DMIS (n⫽ 4) Control (n⫽ 4) DMIS (n⫽ 4)
Hepatic microsomes
Vmax(nmol/min/mg protein) 0.111⫾ 0.0813 0.705⫾ 0.505 0.00903⫾ 0.00136 0.00788⫾ 0.00104
Km(M) 11.1⫾ 6.00 57.7⫾ 39.1 1.69⫾ 0.768 1.41⫾ 0.668
CLint(ml/min/mg protein) 0.00904⫾ 0.00290 0.0146⫾ 0.00559 0.00602⫾ 0.00204 0.00660⫾ 0.00310
Intestinal microsomes
Vmax(nmol/min/mg protein) 0.207⫾ 0.155 0.124⫾ 0.0861 0.00345⫾ 0.00109 0.00383⫾ 0.000222
Km(M) 48.4⫾ 33.1 31.2⫾ 27.5 0.240⫾ 0.133 0.461⫾ 0.190
CLint(ml/min/mg protein) 0.00413⫾ 0.000926 0.00485⫾ 0.00150 0.0166⫾ 0.00832 0.00965⫾ 0.00467
aValues are shown as means⫾ standard deviations.
931
on October 19, 2016 by Ewha Womans Univ
http://aac.asm.org/
betes mellitus was induced with streptozotocin (5). Seven con-trol rats and eight DMIS rats were used in the intravenous administration study. Nine control rats and nine DMIS rats were used in the oral study. Intravenous administration of itraconazole to control rats pretreated with dexamethasone and troleandomycin was performed as previously described (3). Hepatic and intestinal microsomes were prepared from control and DMIS rats (6). The protein expression of intestinal CYP3A1/2 was examined by Western blot analysis (7).
The procedures for measuring Vmax and Kmfor the disap-pearance of itraconazole and the formation of 7-hydroxyitra-conazole were similar to those used in a previous report (6). Microsomes (equivalent to 0.5 mg protein); 5l of dimethyl sulfoxide containing 2.5, 5, 10, 20, 30, or 50M itraconazole; and 50l of 0.1 M phosphate buffer (pH 7.4) containing 1 mM
NADPH were mixed and incubated for 0, 15, 30, 45, or 60 min for hepatic microsomes or for 5, 15, 30, 45, 60, or 75 min for intestinal microsomes. All microsomal incubation conditions were within the linear range of the reaction. After incubation for 45 min (for hepatic microsomes) or 50 min (for intestinal microsomes), 100l of each reaction mixture was transferred to a test tube containing 100g/ml R51012 (internal standard) in 50l of acetonitrile, 250 l of 0.1 M carbonate buffer (pH 9.8), and 1 ml of methyl t-butyl ether. The kinetic constants (Kmand Vmax) were calculated using a nonlinear regression method (4). Intrinsic clearance (CLint) was calculated by di-viding Vmaxby Km.
The total area under the plasma concentration-time curve from time 0 to infinity (AUC0–⬁) or from time 0 to the last measured time at 24 h (AUC0–24) was calculated using the
FIG. 1. Mean arterial plasma concentration-time profiles of itraconazole (A, C) and 7-hydroxyitraconazole (B, D) after intravenous (A, B) or oral (C, D) administration of itraconazole at 10 mg/kg in control (●) and DMIS (E) rats. Error bars, standard deviations.
932 LEE ET AL. ANTIMICROB. AGENTSCHEMOTHER.
on October 19, 2016 by Ewha Womans Univ
http://aac.asm.org/
trapezoidal rule-extrapolation method (2). The peak plasma concentration (Cmax) and time needed to reach Cmax (Tmax) were directly read from the experimental data. The percentage of the dose excreted in a 24-h urine sample (Ae0–24) and that recovered from the gastrointestinal tract (including its contents and feces) sampled after 24 h (GI0-24) were also measured (11). All results are expressed as mean values ⫾ standard deviations, with the exception of values for Tmax, which are expressed as median values with ranges. Unpaired t tests were performed, and P values of⬍0.05 were regarded as statistically significant.
Plasma protein binding values of itraconazole at 5 g/ml were similar between the control (97.9%⫾ 0.242%) and DMIS (97.9%⫾ 0.137%) rats (n ⫽ 4 for each). The protein expres-sion of intestinal CYP3A1/2, as determined by Western blot analysis, did not differ between the two groups of rats (n⫽ 3 for each) (data not shown). Furthermore, Km, Vmax, and CLint values for the disappearance of itraconazole and the formation of 7-hydroxyitraconazole in both hepatic and intestinal micro-somes (n ⫽ 4) were comparable between the control and DMIS rats (Table 1).
In rats pretreated with dexamethasone, which induces CYP3A1/2, the AUC0–⬁of intravenous itraconazole (20 mg/kg of body weight) was significantly smaller (by 59.4%; 641⫾ 110 versus 1,580⫾ 125 g 䡠 min/ml) and the 7-hydroxyitraconazole AUC0–⬁/itraconazole AUC0–⬁ ratio was significantly greater (by 113%; 204%⫾ 55.2% versus 95.6% ⫾ 12.3%) than those in rats without dexamethasone. Conversely, in rats pretreated with troleandomycin, which inhibits CYP3A1/2, the AUC0–⬁of intravenous itraconazole (20 mg/kg) was significantly greater (by 68.2%; 3,380⫾ 873 versus 2,010 ⫾ 500 g 䡠 min/ml) and the 7-hydroxyitraconazole AUC0-⬁/itraconazole AUC0–⬁ratio was significantly smaller (by 24.7%; 54.5% ⫾ 13.4% versus 72.4% ⫾ 9.01%) than those in rats without troleandomycin. These data suggest that the metabolism of itraconazole and the formation of 7-hydroxyitraconazole were mediated via hepatic CYP3A1/2 in rats. The amino acid sequences of human CYP3A4 and rat CYP3A1 are 73% identical (8).
The mean arterial plasma concentration-time profiles of itraconazole and 7-hydroxyitraconazole after a 1-min intrave-nous infusion of 10 mg/kg itraconazole in control and DMIS rats are shown in Fig. 1A and B, respectively. There was no difference in the AUC0-24 for itraconazole (516 ⫾ 88.5 and 522⫾ 171 g 䡠 min/ml in control and DMIS rats, respectively) or 7-hydroxyitraconazole (207⫾ 69.6 and 149 ⫾ 64.8 g 䡠 min/ ml, respectively) between the two groups of rats. The demon-stration of comparable pharmacokinetics between control and DMIS rats in both the liver and intestines provides major evidence for the efficacy of itraconazole in diabetic patients. This is further supported by comparable hepatic CLintvalues for the disappearance of itraconazole and the formation of 7-hydroxyitraconazole (Table 1), as the fractions of free itra-conazole in the plasma (unbound to plasma proteins) were comparable between the two groups of rats. Itraconazole has a low hepatic extraction ratio in rats (13); the hepatic first-pass effect is almost negligible (11). The above-described data
sug-gest that even if the protein expression and/or mRNA levels of hepatic CYP3A1 (5) and -3A2 (10) were higher in DMIS rats, there was no significant difference in the hepatic metabolism of itraconazole between the control and DMIS rats. The Ae0-24 (⬍1.02% of the dose) and the GI0-24(⬍0.0880% of the dose) for itraconazole were almost negligible. Plasma itraconazole and 7-hydroxyitraconazole were detected only up to 24 h after intravenous administration of itraconazole in the rats (Fig. 1A and B).
The mean arterial plasma concentration-time profiles for itraconazole and 7-hydroxyitraconazole after oral administra-tion of 10 mg/kg itraconazole in control and DMIS rats are shown in Fig. 1C and D, respectively. The AUC0–24for itra-conazole (345⫾ 94.3 and 308 ⫾ 154 g 䡠 min/ml in control and DMIS rats, respectively) and that for 7-hydroxyitraconazole (362 ⫾ 131 and 374 ⫾ 181 g 䡠 min/ml, respectively) were comparable between the two groups of rats. This may be ex-plained by comparable intestinal CLintrates for the disappear-ance of itraconazole and the formation of 7-hydroxyitracon-azole in both groups of rats, as a result of similar expression levels of intestinal CYP3A1/2 protein. If the present data were to be extrapolated to humans, changes in the dosage regimen of itraconazole would not appear to be required in diabetic patients.
REFERENCES
1. Allenmark, S., D. J. Touw, and P. N. F. C. de Goede. 1990. Rapid method of the analysis of itraconazole and 7-hydroxyitraconazole in serum by high-performance liquid chromatography. J. Chromatogr. 523:203–206. 2. Chiou, W. L. 1978. Critical evaluation of potential error in pharmacokinetic
studies using the linear trapezoidal rule method for the calculation of the area under the plasma level-time curve. J. Pharmacokinet. Biopharm. 6:539– 546.
3. Choi, Y. H., and M. G. Lee. 2006. Effects of enzyme inducers and inhibitors on the pharmacokinetics of metformin in rats: involvement of CYP2C11, 2D1, and 3A1/2 for the metabolism of metformin. Br. J. Pharmacol. 149: 424–430.
4. Duggleby, R. G. 1995. Analysis of enzyme progress curves by nonlinear regression. Methods Enzymol. 249:61–90.
5. Kim, Y. C., A. K. Lee, J. H. Lee, I. Lee, D. C. Lee, S. H. Kim, S. G. Kim, and
M. G. Lee.2005. Pharmacokinetics of theophylline in diabetes mellitus rats: induction of CYP1A2 and CYP2E1 on 1,3-dimethyluric acid formation. Eur. J. Pharm. Sci. 26:114–123.
6. Lee, J. H., and M. G. Lee. 2008. Telithromycin pharmacokinetics in rat model of diabetes mellitus induced by alloxan or streptozotocin. Pharm. Res.
25:1915–1924.
7. Lee, D. Y., Y. S. Jung, Y. C. Kim, S. Y. Kim, and M. G. Lee. 2009. Faster clearance of omeprazole in mutant Nagase analbuminemic rats: possible roles of increased protein expression of hepatic CYP1A2 and lower plasma protein binding. Biopharm. Drug Dispos. 30:107–116.
8. Lewis, D. F. V. (ed.). In Cytochrome P450: structure, function, and mecha-nism, p. 115–167. Taylor & Francis Inc., Bristol, PA.
9. Penzak, S. R., P. O. Gubbins, B. J. Gurley, P. L. Wang, and M. Saccente. 1999. Grapefruit juice decreases the systemic availability of itraconazole capsules in healthy volunteers. Ther. Drug Monit. 21:304–309.
10. Shimojo, N., T. Ishizaki, S. Imaoka, Y. Funae, S. Fujii, and K. Okuda. 1993. Changes in amounts of cytochrome P450 isozymes and levels of catalytic activities in hepatic and renal microsomes of rats with streptozotocin-in-duced diabetes. Biochem. Pharmacol. 46:621–627.
11. Shin, J. H., K. Y. Choi, Y. C. Kim, and M. G. Lee. 2004. Dose-dependent pharmacokinetics of itraconazole after intravenous and oral administration to rats: intestinal first-pass effect. Antimicrob. Agents Chemother. 48:1756– 1762.
12. Tan, J. S., and W. S. Joseph. 2004. Common fungal infections of the feet in patients with diabetes mellitus. Drugs Aging 21:101–112.
13. Wilkinson, G. R., and D. G. Shand. 1975. A physiological approach to hepatic drug clearance. Clin. Pharmacol. Ther. 18:377–390.
VOL. 54, 2010 ITRACONAZOLE PHARMACOKINETICS IN DMIS RATS 933