INTRODUCTION
Obesity, which is increasing in prevalence worldwide, is a physi-cal condition characterized by the accumulation of excessive body fat, along with many other health impairments. Obesity has been found to adversely affect a wide spectrum of diseases, from non-communicable disorders to mental and social health, including diabetes, malignancies, depression, discrimination, and others [1-4]. The harmful consequences of being overweight or obese have been found to be especially detrimental in women, elevating risks OBJECTIVES: While the prevalence of obesity in Asian women has remained stagnant, studies of socioeconomic inequalities in obesity among Asian women are scarce. This study aimed to examine the recent prevalence of obesity in Korean women aged between 19 years and 79 years and to analyze socioeconomic inequalities in obesity.
METHODS: Data were derived from the 2016 Korean Study of Women’s Health-Related Issues. The chi-square test and logistic regression analysis were used to analyze the associations between socioeconomic factors and obesity using Asian standard body mass index (BMI) categories: low (<18.5 kg/m2), normal (18.5-22.9 kg/m2), overweight (23.0-24.9 kg/m2), and obese (≥25.0 kg/ m2). As inequality-specific indicators, the slope index of inequality (SII) and relative index of inequality (RII) were calculated, with adjustment for age and self-reported health status.
RESULTS: Korean women were classified into the following BMI categories: underweight (5.3%), normal weight (59.1%), over-weight (21.2%), and obese (14.4%). The SII and RII revealed substantial inequalities in obesity in favor of more urbanized women (SII, 4.5; RII, 1.4) and against of women who were highly educated (SII, -16.7; RII, 0.3). Subgroup analysis revealed inequalities in obesity according to household income among younger women and according to urbanization among women aged 65-79 years. CONCLUSIONS: Clear educational inequalities in obesity existed in Korean women. Reverse inequalities in urbanization were also apparent in older women. Developing strategies to address the multiple observed inequalities in obesity among Korean women may prove essential for effectively reducing the burden of this disease.
KEY WORDS: Obesity, Women’s health, Body mass index, Socioeconomic factors
ORIGINAL ARTICLE
Volume: 41, Article ID: e2019005, 7 pages https://doi.org/10.4178/epih.e2019005Socioeconomic inequalities in obesity among Korean
women aged 19-79 years: the 2016 Korean Study of
Women’s Health-Related Issues
Eunji Choi
1, Ha Na Cho
1, Da Hea Seo
2, Boyoung Park
3, Sohee Park
4, Juhee Cho
5, Sue Kim
6,
Yeong-Ran Park
7, Kui Son Choi
1, Yumie Rhee
81Graduate School of Cancer Science and Policy, National Cancer Center, Goyang, Korea; 2Department of Endocrinology and Metabolism, Inha
University School of Medicine, Incheon, Korea; 3Department of Medicine, Hanyang University College of Medicine, Seoul, Korea; 4Graduate
School of Public Health, Yonsei University, Seoul, Korea; 5Department of Clinical Research and Evaluation, Sungkyunkwan University, Seoul,
Korea; 6College of Nursing, Yonsei University, Seoul, Korea; 7Division of Silver Industry, Kangnam University, Yongin, Korea; 8Department of
Internal Medicine, Endocrine Research Institute, Severance Hospital, Yonsei University College of Medicine, Seoul, Korea
Correspondence:Kui Son Choi
Graduate School of Cancer Science and Policy, National Cancer Center, 323 Ilsan-ro, Ilsandong-gu, Goyang 10408, Korea
E-mail: [email protected]
Received: Aug 10, 2018 / Accepted: Feb 13, 2019 / Published: Feb 13, 2019 This article is available from: http://e-epih.org/
This is an open-access article distributed under the terms of the Creative Commons Attribution License (http://creativecommons.org/licenses/by/4.0/), which permits unrestricted use, distribution, and reproduction in any medium, provided the original work is properly cited.
obesity patterns by gender, they focused on explaining mechanisms of obesity in Korean adult men due to the higher prevalence of obesity in men [10,19].
Thus, in this study, we aimed to report the prevalence of obesity among Korean adult women aged 19 years to 79 years using re-cent nationally representative data. We also sought to investigate associations between socioeconomic factors and obesity in Kore-an women. In particular, we examined existing socioeconomic in-equalities in obesity among Korean women according to house-hold income, education level, and urbanization (location of resi-dence) via absolute and relative indicators specialized for inequal-ity analysis.
MATERIALS AND METHODS
Study population
Data were acquired from the 2016 Korean Study of Women’s Health-Related Issues (K-Stori) survey. This study was approved by the Institutional Review Board of the National Cancer Center, Korea (approval No. NCC2016-0062). Applying life-cycle-specific questionnaires to women, the K-Stori is a nationwide cross-sec-tional study designed to investigate a comprehensive range of health conditions in women [21]. A detailed description of K-Stori has been provided elsewhere [21]. In brief, nationally representa-tive participants were selected by multistage random sampling ac-cording to population size per region and geographic area, based on Registration Population data for July 2013 from Statistics Ko-rea. Sampling weights were additionally provided to adjust for the age distribution to reflect the total population of Korean women. The survey was conducted from March 1 to May 31, 2016, at which time investigators from a professional research agency went door-to-door to recruit residents, and at least three attempts were made to contact individual residents. The response rate after making contact was 40.4%, excluding those who were absent (24,260) or who did not meet the study criteria (5,691). Each respondent was administered a self-reported questionnaire through an in-person interview. Of the respondents, 9,000 women aged between 19 years and 79 years were finally used for analysis in the current study.
Measurements
BMI is widely recommended for classifying adults and adoles-cents as overweight and obese, because of its strong association with health risks, simplicity, and low cost [22]. BMI is calculated as a person’s weight in kilograms divided by his or her height in meters squared (kg/m2). The World Health Organization (WHO) advocates standard BMI cut points [22]. However, Asian popula-tions generally tend to have a lower BMI by about 2-3 kg/m2; more-over, the WHO standard of BMI classification was not found to correspond to metabolic risk in Asian overweight/obese people [23]. Therefore, the following modified BMI cut points are com-monly used for analyses of the Korean population: underweight (<18.5 kg/m2), normal weight (18.5-22.9 kg/m2), overweight (23.0-24.9 kg/m2), and obese (≥25.0 kg/m2) [24]. In this study, each re-for reproductive disorders, mental health conditions, and
predom-inantly women’s cancers, such as endometrial and breast cancer [5-8]. Disparities in obesity prevalence have been found to vary ac-cording to parameters reflecting differences in socioeconomic sta-tus, such as urbanization, education, and income levels. Women residing in urbanized areas and living in socioeconomically-de-prived conditions have been reported to show faster increases in the prevalence of obesity and overweight [9-13]. Notwithstanding, the magnitude and direction of effects of socioeconomic factors on inequalities in obesity might vary across countries [14-16]. In North America and European countries, inequalities related to obesity have generally been well documented; obesity has been found to be disproportionately more prevalent among individuals with lower levels of education and income, residents of less urban-ized areas, and those lacking access to healthcare [10,15]. In con-trast, although only a few studies have addressed socioeconomic inequalities in obesity in developing countries, most findings for these countries indicate contrasting results regarding education and income status (i.e., higher obesity rates in women with higher education and household income) [16]. In light of the results of a prior study that socioeconomic factors affect obesity status in ways that vary by country, it is important to consider how these socio-economic factors affect obesity to develop health promotion pro-grams.
In the Republic of Korea (hereafter Korea), the prevalence of obesity has been officially surveyed using body mass index (BMI) since 1998. The mean BMI for Korean women slightly increased from 1998 to 2005 and stabilized from 2005 to 2014 [17]. Although the overall prevalence of obesity in women is lower than that of men, Korean women older than 65 years have higher obesity rates than men of a similar age [18]. Additionally, while BMI in Korean men gradually increases with age, in Korean women, it sharply in-creases after the age of 40 years and menopause [17]. Additionally, despite the stable findings on the overall prevalence of obesity among Korean women, a significant increase in grade II obesity (BMI ≥ 30.0 kg/m2) from 1998 to 2014 has been recorded, especially for women aged 20 years to 59 years [17].
While obesity rates in Korea are somewhat lower than those of other Organization for Economic Cooperation and Development countries, socioeconomic inequalities in obesity continue to be a point of discussion [10]. Results from previous studies, however, reflect outdated data [10,19] and provide incomplete conclusions on inequality due to the use of limited inequality indicators [19]. For the most part, those studies adopted conventional logistic anal-yses or direct simple comparisons of rate differences (excess risk) or ratios between the highest and lowest socioeconomic groups. However, the traditional approach of comparing extreme groups on the socioeconomic spectrum fails to take into account changes across the full range of socioeconomic groups. In this study, we utilized the slope index of inequality (SII) and the relative index of inequality (RII), which are regression-based measures of health status across all ranges of each socioeconomic factor [20]. Further-more, although previous papers emphasized the discrepancies of
spondent provided her self-reported height and weight through the structured questionnaire, which we used to calculate BMI ac-cording to the modified Korean version of the WHO classifica-tion [17,18]. Based on the BMI classificaclassifica-tion, the obesity rate was calculated as the number of obese women divided by total num-ber of women.
We analyzed age groups, household income, education level, and urbanization (location of residence) as socioeconomic fac-tors. Considering the women’slife cycle, participants were classi-fied by age into 3 groups to reflect the childbearing period (19-44 years), menopausal period (45-64 years), and older adulthood (65-79 years) [21]. For income, we sequentially classified monthly household income in dollars into 5 groups: 1,999 or below, 2,000-2,999, 3,000-3,999, 4,000-4,999, and 5,000 or above. To facilitate comparisons between our study and previous research in the lit-erature, we utilized categories often adopted in previous studies for classifying education and urbanization [25,26]. Participants were classified by education level into 3 groups: middle school graduate or lower, high school graduate, and college graduate or higher. For urbanization, we first defined metropolitan areas as including 1 special city (Seoul) and 6 metropolitan cities (Busan, Daegu, In cheon, Gwangju, Daejeon, and Ulsan); then, of the re-maining areas, those classified as neighborhoods (dong) were de-fined as urban areas, and all remaining areas were dede-fined as rural (eup and myeon) [25,26]. Additionally, to adjust for the overall health status of the participants, we used a variable for self-report-ed health status. We askself-report-ed participants, “in general, would you say that your health is ____?”, with the following 5 scaled items:
(1) excellent, (2) good, (3) fair, (4) poor, and (5) very poor. We then classified the 5 items into 3 categories (‘good’ with (1) excel-lent and (2) good, ‘fair’ with (3) fair, and ‘bad’ with (4) poor and (5) very poor) to include this item in the statistical analysis as a simple and intuitive adjustment factor [27].
Statistical analysis
The study population was characterized using descriptive sta-tistics. BMI status and socioeconomic factors were presented in tabular form, and the chi-square test was conducted to compare the distributions of the variables. To investigate the associations of socioeconomic factors with obesity, we conducted a logistic re-gression analysis by the obesity rate. The p-values <0.05 were con-sidered to indicate statistical significance in the chi-square and lo-gistic analyses.
To assess inequalities in obesity, we calculated the SII and the RII for our primary measures. Although analyses of SII and RII require that socioeconomic variables have at least 3 categories and be ordered, they are recommended because they are easy to cal-culate and interpret [28-30]. The mean values for a health status— here, the mean proportion of being obese (obesity rate)— for each level of a socioeconomic factor are regressed by the midpoints of a distribution of grouped data. Therefore, the strength of these in-equality indicators is that they consider not only health states be-tween the extreme ends of a socioeconomic factor, but also all health states for each level of a socioeconomic factor. The SII is interpret-ed as the absolute difference in health between the theoretically most privileged and the least privileged women. Correspondingly,
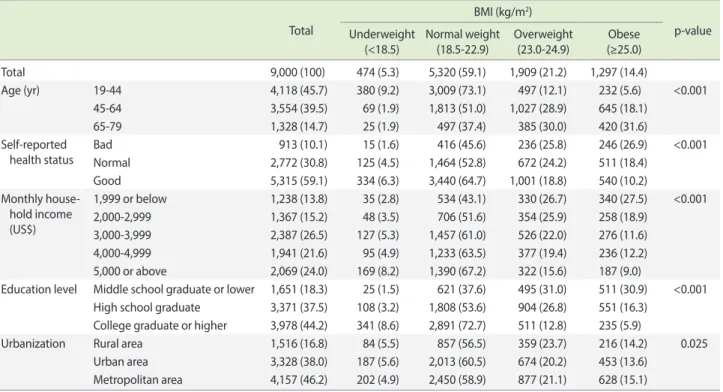
Table 1. Baseline characteristics of the study population in Korea according to body mass index (BMI)
Total
BMI (kg/m2)
p-value Underweight
(<18.5) Normal weight(18.5-22.9) Overweight(23.0-24.9) (≥25.0)Obese Total 9,000 (100) 474 (5.3) 5,320 (59.1) 1,909 (21.2) 1,297 (14.4) Age (yr) 19-44 4,118 (45.7) 380 (9.2) 3,009 (73.1) 497 (12.1) 232 (5.6) <0.001 45-64 3,554 (39.5) 69 (1.9) 1,813 (51.0) 1,027 (28.9) 645 (18.1) 65-79 1,328 (14.7) 25 (1.9) 497 (37.4) 385 (30.0) 420 (31.6) Self-reported health status Bad 913 (10.1) 15 (1.6) 416 (45.6) 236 (25.8) 246 (26.9) <0.001 Normal 2,772 (30.8) 125 (4.5) 1,464 (52.8) 672 (24.2) 511 (18.4) Good 5,315 (59.1) 334 (6.3) 3,440 (64.7) 1,001 (18.8) 540 (10.2) Monthly house-hold income (US$) 1,999 or below 1,238 (13.8) 35 (2.8) 534 (43.1) 330 (26.7) 340 (27.5) <0.001 2,000-2,999 1,367 (15.2) 48 (3.5) 706 (51.6) 354 (25.9) 258 (18.9) 3,000-3,999 2,387 (26.5) 127 (5.3) 1,457 (61.0) 526 (22.0) 276 (11.6) 4,000-4,999 1,941 (21.6) 95 (4.9) 1,233 (63.5) 377 (19.4) 236 (12.2) 5,000 or above 2,069 (24.0) 169 (8.2) 1,390 (67.2) 322 (15.6) 187 (9.0)
Education level Middle school graduate or lower 1,651 (18.3) 25 (1.5) 621 (37.6) 495 (31.0) 511 (30.9) <0.001 High school graduate 3,371 (37.5) 108 (3.2) 1,808 (53.6) 904 (26.8) 551 (16.3)
College graduate or higher 3,978 (44.2) 341 (8.6) 2,891 (72.7) 511 (12.8) 235 (5.9)
Urbanization Rural area 1,516 (16.8) 84 (5.5) 857 (56.5) 359 (23.7) 216 (14.2) 0.025 Urban area 3,328 (38.0) 187 (5.6) 2,013 (60.5) 674 (20.2) 453 (13.6)
Metropolitan area 4,157 (46.2) 202 (4.9) 2,450 (58.9) 877 (21.1) 628 (15.1) Values are presented as number (%).
the RII is obtained by dividing the health status of the most privi-leged women by that of the least priviprivi-leged. As relative disparities provide an indication of progress and absolute disparities provide a context for public health interventions, presenting both meas-ures (SII and RII) is essential for deriving complete conclusions [28]. Both were calculated through Poisson regression including age and self-reported health as control variables, because those variables are related with BMI status. By adjusting for age, self-re-ported health status, and sampling weight in the regression, we tried to estimate the effects of socioeconomic factors on obesity. All statistical analyses were performed using Stata version 13 (Stata-Corp., College Station, TX, USA).
RESULTS
The socio-demographic characteristics of the study population are described in Table 1. Overall, 21.2% and 14.4% of Korean wom-en aged 19-79 years in this study were overweight or obese, re-spectively. In the current study, the majority of women had a col-lege or higher education (44.2%), and resided within a metropoli-tan area (46.2%). Women aged between 65 years and 79 years com-prised the highest proportion of overweight and obese women, followed by women aged between 45 years and 64 years. In con-trast, the proportion of underweight was highest among women aged between 19 years and 44 years (Table 1). Women in the low-est class of household income or who had only completed a mid-dle school education or lower also tended to have a higher BMI (Table 1).
The associations between socioeconomic factors and obesity were analyzed using logistic regression by applying weights for age
distribution (Table 2). Women aged 45-64 years and 65-79 years were more likely to be obese, as represented by odds ratios (ORs) of 2.35 and 2.93, compared to the youngest age group as a refer-ence group. By household income, only women with the highest level of income were significantly less likely to be obese, compared to women with the lowest income (Table 2). Interestingly, while women with higher levels of education were less likely to be obese, living in metropolitan areas showed a positive association with obesity. Linear trends in the obtained ORs for each socioeconom-ic variable were estimated and demonstrated consistent and sig-nificant increasing or decreasing trends among all socioeconomic factors.
In all women, the SII and RII estimates of inequalities accord-ing to education level and urbanization of residence were signifi-cant. As the SII refers to the difference in health from the most privileged to the least privileged, positive SII values imply a higher percentage of obesity in women of higher socioeconomic status. Meanwhile, RII reflects the ratio of health between the highest
Table 2. Logistic analysis of socioeconomic factors and obesity status in Korea, 2016 (n= 9,000)
Categories aOR (95% CI) p for trend1
Age (yr) 19-44 1.00 (reference) <0.001
45-64 2.35 (1.96, 2.81) 65-79 2.93 (2.25, 3.77)
Self-reported health status Bad 1.00 (reference) <0.001 Normal 0.90 (0.74, 1.08)
Good 0.67 (0.55, 0.81)
Monthly household income (US$) 1,999 or below 1.00 (reference) 0.041 2,000-2,999 1.00 (0.81, 1.23)
3,000-3,999 0.85 (0.68, 1.05) 4,000-4,999 1.01 (0.80, 1.28) 5,000 or above 0.77 (0.61, 0.99)
Education level Middle school graduate or lower 1.00 (reference) <0.001 High school graduate 0.69 (0.57, 0.84)
College graduate or higher 0.36 (0.28, 0.46)
Urbanization Rural 1.00 (reference) 0.002
Urban 1.10 (0.92, 1.32) Metropolitan 1.32 (1.10, 1.57) aOR, adjusted odds ratio; CI, confidence interval.
1Significance of linear trend among ORs.
Table 3. Socioeconomic inequalities in obesity status among in
Ko-rea women, 20161 (n= 9,000)
SII (95% CI) RII (95% CI) Education level -16.66 (-21.55, -6.09) 0.32 (0.23, 0.45) Monthly household
income -2.67 (-6.09, 0.74) 0.96 (0.77, 1.19) Urbanization 4.46 (1.50, 7.42) 1.36 (1.15, 1.61) SII, slope index of inequality; RII, relative index of inequality; CI, confi-dence interval.
and the lowest socioeconomic groups, indicating fold changes in health between the highest and lowest socioeconomic groups. In our data, the negative SII values for education (-16.66) indicated that obese women had disproportionately less education, by as much as about 16%, while the RII estimate of 0.32 revealed that women with a higher education status had a 0.32 times lower obesity prevalence compared to women with less education (Table 3). Furthermore, as shown in Table 3, women living in metropoli-tan areas were significantly more likely to be obese than women in rural areas (SII, 4.46; RII, 1.36).
As the prevalence and health effects of obesity differ considera-bly among age groups and women in different life cycles, we con-ducted a subgroup analysis according to those categories, as pre-sented in Table 4. Educational inequalities were significant in all age groups, with fewer highly educated women being obese. Younger women, between 19 years and 44 years, showed signifi-cant inequalities in obesity according to household income levels (SII, -3.89; RII, 0.49) (Table 4). The SII and RII values for urbani-zation among women of ages 65 years or over reflected a higher proportion of obesity in women residing in metropolitan areas (SII, 9.65; RII, 1.44) (Table 4).
DISCUSSION
In the current study, we presented up-to-date findings on the prevalence of obesity among the general population of women in Korea. Although researchers have regularly stressed the impor-tance and existence of socioeconomic inequalities in the Korean population, few studies have investigated socioeconomic inequal-ities in Asian women with specialized indicators of disparity and the latest data sources. Herein, we discovered that the prevalence of overweight/obesity among Korean women remained steady at about 40%, which is slightly lower than the prevalence of 45.3% reported by Shin et al. [17]. In comparison, the prevalence of over-weight/obesity in Korean women was far below that of women from the USA [31], similar to that of Central Asian women, and higher than that of women from most Southeast Asian countries [16,32]. In particular, higher proportions of obesity were recorded
for women with the least education and the lowest household in-come. We also noted significant associations between socioeco-nomic factors and obesity. Overall, our findings agree with other studies from developed countries, demonstrating that socioeco-nomically-deprived women suffer from being overweight and obese disproportionately to their counterparts of higher socioeco-nomic status [16,29,33].
In most developed countries, inverse associations between edu-cational inequalities and obesity status have been detected, which we also observed in Korean women across all age group [34]. The reverse relationship between education attainment and obesity status is generally described as a common phenomenon in the early stages of economic development [35]. In countries such as the UK, where obesity rates have reached “ceiling levels,” educa-tional inequalities are considered insignificant [34]. For the Korea, although the prevalence of obesity in Korean women has stabi-lized, we discovered significant inequalities in obesity according to education level [19]. Our results are supported by a recent study from the Korea that detected increasing educational ine-qualities over time from 1998 to 2007 in BMI and waist circumfer-ence among women aged 25-64 years [19].
Young women are generally more vulnerable to socioeconomic inequalities in obesity [34]. Women of younger age and with low income tend to have lower self-esteem, which is a factor that in-fluences the risk of becoming obese. Indeed, inequalities accord-ing to household income and urbanization differed with age in the present study. Income inequalities were significant in younger women aged 19-44 years, while urbanized residence inequalities were detected in older women aged 65 years and older. Further-more, the prevalence of obesity among Korean women sharply increased after menopause. Despite a similar trend of increases in overweight and obesity for women aged 45-64 years, no addition-al socioeconomic inequaddition-alities were identified [16,34,36].
Throughout the world, women living in metropolitan areas have been found to be more likely to be obese, in part because of a sedentary lifestyle in urban areas [16,34]. Thus, we further ana-lyzed sedentary behaviors among the women in the oldest age group by using the item “How many hours on average do you
Table 4. Socioeconomic inequalities in obesity status according to age groups in Korea, 20161 (n= 9,000)
Age (yr) Socioeconomic variables SII (95% CI) RII (95% CI) 19-44 Education level -9.78 (-14.62, -4.95) 0.21 (0.10 , 0.44)
Monthly household income -3.89 (-7.62, -0.17) 0.49 (0.26, 0.92) Urbanization 1.48 (-2.27, 5.23) 1.16 (0.69, 1.95) 45-64 Education level -17.34 (-23.99, -10.69) 0.37 (0.23, 0.59) Monthly household income 2.56 (-3.36, 8.47) 1.12 (0.78, 1.60) Urbanization 2.94 (-2.42, 8.30) 1.27 (0.94, 1.70) 65-79 Education level -10.93 (-21.22, -0.64) 0.57 (0.30, 0.98) Monthly household income -4.13 (-11.82, 3.55) 0.80 (0.58, 1.11) Urbanization 9.65 (2.83, 16.47) 1.44 (1.15, 1.81) SII, slope index of inequality; RII, relative index of inequality; CI, confidence interval.
spend sitting or lying down from when you wake up until you go to bed?” [37-39]. The mean amount of sedentary hours was high-est in women living in a metropolitan area, compared to women in urban and rural areas, with statistical significance based on the t-test. Furthermore, upon dichotomizing sedentary hours as ≤5 hours and >5 hours, we discovered that significantly more wom-en residing in metropolitan areas were sedwom-entary for >5 hours per day. Therefore, a sedentary lifestyle might account for the inequali-ties in obesity from urbanization among older Korean women. Altogether, specialized, tailored support for women of different ages may be needed to address inequalities in obesity among Ko-rean women.
Our study has a number of limitations. First, the cross-sectional design may hinder the ability to implicate any causal relationships underlying the observed associations between obesity and socio-economic inequalities. Thus, future studies with a longitudinal de-sign are recommended to track changing patterns in health ine-qualities in obesity among Korean women. In fact, some studies have described decreasing inequalities as the prevalence of obesity increases, while others have suggested that the magnitude of soci-oeconomic inequalities change only a little, despite very high obe-sity rates. Findings specific to Korea regarding trends in inequali-ties in obesity are urgently needed.
Second, we administered a self-reported survey to the partici-pants, possibly causing recall bias or incorrect measures of weight and height. Generally, women are more likely to under-report their weight and over-report their height; however, we did not correct values of weight and height in the analysis. Therefore, we may have underestimated the prevalence of obesity. Moreover, Korean wom-en suffer from not only being obese, but also from several prob-lems related to underweight. However, we made no effort to ac-count for possible effects of these issues on our results. Finally, we derived the analytic data from the K-Stori survey, which was de-signed to be representative of women in the general Korean popu-lation, accounting for age distribution and regional characteristics. Thus, caution is required when generalizing and interpreting our results for other Asian countries.
Despite its limitations, this study is important in that we attempt-ed to examine nationwide socioeconomic inequalities in obesity among Korean women over a wide age range. Through logistic re-gression, our results demonstrated that economically-deprived and educationally-deprived women were more likely to be obese. Inequality-specialized indicators further revealed significant soci-oeconomic inequalities among specific age groups of women. As well, this study highlights practical issues that have remained hid-den due to the relatively low overall prevalence of obesity in Kore-an women, providing novel insights of use in developing interven-tions to address health inequalities at the population level. Tailored strategies to diminish socioeconomic inequalities in obesity among Korean women may play an important role in achieving greater equity and efficacy in health care programs.
CONFLICT OF INTEREST
The authors have no conflicts of interest to declare for this study.
ACKNOWLEDGEMENTS
This study was funded by the Korea Center for Disease Control and Prevention (grant No. 2015ER630300), a Grant-in-Aid for Cancer Research and Control from the National Cancer Center of Korea (#1610401).
ORCID
Eunji Choi: http://orcid.org/0000-0003-1315-1433; Ha Na Cho:
http://orcid.org/0000-0003-2166-8555; Da Hae Seo: http://orcid. org/0000-0003-2767-0293; Boyoung Park: http://orcid.org/0000-0003-1902-3184; Sohee Park:
http://orcid.org/0000-0001-8513-5163; Juhee Cho: http://orcid.org/0000-0001-9081-0266; Sue Kim:
http://orcid.org/0000-0003-3785-2445; Yoeng-Ran Park: http://or-cid.org /0000-0002-7906-8846; Kui Son Choi: http://orcid. org/0000-0001-5336-3874; Yumie Rhee: http://orcid.org/0000-0003-4227-5638
REFERENCES
1. Webber L, Divajeva D, Marsh T, McPherson K, Brown M, Galea G, et al. The future burden of obesity-related diseases in the 53 WHO European-Region countries and the impact of effective in-terventions: a modelling study. BMJ Open 2014;4:e004787. 2. Ezzati M, Riboli E. Behavioral and dietary risk factors for
non-communicable diseases. N Engl J Med 2013;369:954-964. 3. Park J, Morley TS, Kim M, Clegg DJ, Scherer PE. Obesity and
cancer--mechanisms underlying tumour progression and recur-rence. Nat Rev Endocrinol 2014;10:455-465.
4. Preiss K, Brennan L, Clarke D. A systematic review of variables associated with the relationship between obesity and depression. Obes Rev 2013;14:906-918.
5. Alhusen JL, Ayres L, DePriest K. Effects of maternal mental health on engagement in favorable health practices during pregnancy. J Midwifery Womens Health 2016;61:210-216.
6. Molyneaux E, Poston L, Ashurst-Williams S, Howard LM. Obesi-ty and mental disorders during pregnancy and postpartum: a sys-tematic review and meta-analysis. Obstet Gynecol 2014;123:857-867.
7. Neuhouser ML, Aragaki AK, Prentice RL, Manson JE, Chlebowski R, Carty CL, et al. Overweight, obesity, and postmenopausal in-vasive breast cancer risk: a secondary analysis of the women’s health initiative randomized clinical trials. JAMA Oncol 2015;1: 611-621.
8. Liu Y, Metzinger MN, Lewellen KA, Cripps SN, Carey KD, Harp-er EI, et al. Obesity contributes to ovarian cancHarp-er metastatic suc-cess through increased lipogenesis, enhanced vascularity, and de-creased infiltration of M1 macrophages. Cancer Res
2015;75:5046-5057.
9. McLaren L. Socioeconomic status and obesity. Epidemiol Rev 2007;29:29-48.
10. Devaux M, Sassi F. Social inequalities in obesity and overweight in 11 OECD countries. Eur J Public Health 2013;23:464-469. 11. Jayawardena R, Byrne NM, Soares MJ, Katulanda P, Hills AP.
Prev-alence, trends and associated socio-economic factors of obesity in South Asia. Obes Facts 2013;6:405-414.
12. Demment MM, Haas JD, Olson CM. Changes in family income status and the development of overweight and obesity from 2 to 15 years: a longitudinal study. BMC Public Health 2014;14:417. 13. Cohen AK, Rai M, Rehkopf DH, Abrams B. Educational
attain-ment and obesity: a systematic review. Obes Rev 2013;14:989-1005.
14. Pampel FC, Denney JT, Krueger PM. Obesity, SES, and economic development: a test of the reversal hypothesis. Soc Sci Med 2012; 74:1073-1081.
15. Siddiqi A, Brown R, Nguyen QC, Loopstra R, Kawachi I. Cross-national comparison of socioeconomic inequalities in obesity in the United States and Canada. Int J Equity Health 2015;14:116. 16. Dinsa GD, Goryakin Y, Fumagalli E, Suhrcke M. Obesity and
so-cioeconomic status in developing countries: a systematic review. Obes Rev 2012;13:1067-1079.
17. Shin HY, Kang HT. Recent trends in the prevalence of underwei-ght, overweiunderwei-ght, and obesity in Korean adults: the Korean Nation-al HeNation-alth and Nutrition Examination Survey from 1998 to 2014. J Epidemiol 2017;27:413-419.
18. Khang YH, Yun SC. Trends in general and abdominal obesity among Korean adults: findings from 1998, 2001, 2005, and 2007 Korea National Health and Nutrition Examination Surveys. J Ko-rean Med Sci 2010;25:1582-1588.
19. Yoo S, Cho HJ, Khang YH. General and abdominal obesity in South Korea, 1998–2007: gender and socioeconomic differences. Prev Med 2010;51:460-465.
20. Choi E, Lee YY, Suh M, Lee EY, Mai TT, Ki M, et al. Socioeconom-ic inequalities in cervSocioeconom-ical and breast cancer screening among wom-en in Korea, 2005–2015. Yonsei Med J 2018;59:1026-1033. 21. Cho HN, Choi E, Seo DH, Suh M, Lee HY, Park B, et al. The
Ko-rean Study of Women’s Health-Related Issues (K-Stori): rationale and study design. BMC Public Health 2017;17:609.
22. World Health Organization. Physical status: the use of and inter-pretation of anthropometry, report of a WHO expert committee; 1995 [cited 2019 Feb 25]. Available from: https://apps.who.int/ iris/handle/10665/37003.
23. WHO Expert Consultation. Appropriate body-mass index for Asian populations and its implications for policy and interven-tion strategies. Lancet 2004;363:157-163.
24. World Health Organization. The Asia-Pacific perspective: rede-fining obesity and its treatment; 2000 [cited 2019 Feb 25]. Availa-ble from: http://www.wpro.who.int/nutrition/documents/docs/
Redefiningobesity.pdf.
25. Jung-Choi K, Khang YH, Cho HJ, Yun SC. Decomposition of ed-ucational differences in life expectancy by age and causes of death among South Korean adults. BMC Public Health 2014;14:560. 26. Joshu CE, Boehmer TK, Brownson RC, Ewing R. Personal,
neigh-bourhood and urban factors associated with obesity in the Unit-ed States. J Epidemiol Community Health 2008;62:202-208. 27. Choi E, Lee YY, Yoon HJ, Lee S, Suh M, Park B, et al. Relationship
between cancer worry and stages of adoption for breast cancer screening among Korean women. PloS One 2015;10:e0132351. 28. Moreno-Betancur M, Latouche A, Menvielle G, Kunst AE, Rey G.
Relative index of inequality and slope index of inequality: a struc-tured regression framework for estimation. Epidemiology 2015; 26:518-527.
29. Singh-Manoux A, Gourmelen J, Lajnef M, Sabia S, Sitta R, Men-vielle G, et al. Prevalence of educational inequalities in obesity be-tween 1970 and 2003 in France. Obes Rev 2009;10:511-518. 30. Espelt A, Kunst AE, Palencia L, Gnavi R, Borrell C. Twenty years
of socio-economic inequalities in type 2 diabetes mellitus preva-lence in Spain, 1987–2006. Eur J Public Health 2011;22:765-771. 31. Ogden CL, Carroll MD, Kit BK, Flegal KM. Prevalence of
child-hood and adult obesity in the United States, 2011-2012. JAMA 2014;311:806-814.
32. Popkin BM, Slining MM. New dynamics in global obesity facing low‐and middle‐income countries. Obes Rev 2013;14 Suppl 2: 11-20.
33. Padyab M, Norberg M. Socioeconomic inequalities and body mass index in Västerbotten County, Sweden: a longitudinal study of life course influences over two decades. Int J Equity Health 2014;13:35.
34. Roskam AJ, Kunst AE, Van Oyen H, Demarest S, Klumbiene J, Regidor E, et al. Comparative appraisal of educational inequali-ties in overweight and obesity among adults in 19 European coun-tries. Int J Epidemiol 2010;39:392-404.
35. Monteiro CA, Moura EC, Conde WL, Popkin BM. Socioeco-nomic status and obesity in adult populations of developing countries: a review. Bull World Health Organ 2004;82:940-946. 36. Tauqeer Z, Gomez G, Stanford FC. Obesity in women: insights
for the clinician. J Womens Health 2018;27:444-457.
37. Chun MY. Validity and reliability of Korean version of interna-tional physical activity questionnaire short form in the elderly. Korean J Fam Med 2012;33:144-151.
38. Rosenberg DE, Bull FC, Marshall AL, Sallis JF, Bauman AE. As-sessment of sedentary behavior with the International Physical Activity Questionnaire. J Phys Act Health 2008;5 Suppl 1:S30-S44. 39. Jarosz PA, Davis JE, Yarandi HN, Farkas R, Feingold E, Shippings
SH, et al. Obesity in urban women: associations with sleep and sleepiness, fatigue and activity. Womens Health Issues 2014;24: e447-e454.