R E S E A R C H A R T I C L E
Open Access
Genome-wide gene expression analysis in
the placenta from fetus with trisomy 21
Ji Hyae Lim
1†, You Jung Han
2,3†, Hyun Jin Kim
1, Dong Wook Kwak
2, So Yeon Park
1, Sun-Hee Chun
3*and Hyun Mee Ryu
1,2*Abstract
Background: We performed whole human genome expression analysis in placenta tissue (normal and T21) samples in order to investigate gene expression into the pathogenesis of trisomy 21 (T21) placenta. We profiled the whole human genome expression of placental samples from normal and T21 fetuses using the GeneChip Human Genome U133 plus 2.0 array. Based on these data, we predicted the functions of differentially expressed genes using bioinformatics tools. Results: A total of 110 genes had different expression patterns in the T21 placentas than they did in the normal placentas. Among them, 77 genes were up-regulated in the T21 placenta and 33 genes were down-regulated compared to their respective levels in normal placentas. Over half of the up-regulated genes (59.7%, n = 46) were located on HSA21. Up-regulated genes in the T21 placentas were significantly associated with T21 and its
complications including mental retardation and neurobehavioral manifestations, whereas down-regulated genes were significantly associated with diseases, such as cystitis, metaplasia, pathologic neovascularization, airway obstruction, and diabetes mellitus. The interactive signaling network showed that 53 genes (40 up-regulated genes and 13 down-regulated genes) were an essential component of the dynamic complex of signaling (P < 1.39e-08).
Conclusions: Our findings provide a broad overview of whole human genome expression in the placentas of fetuses with T21 and a possibility that these genes regulate biological pathways that have been involved in T21 and T21 complications. Therefore, these results could contribute to future research efforts concerning gene involvement in the disease’s pathogenesis.
Keywords: Trisomy 21, Placenta, Gene expression, Microarray Background
Trisomy 21 (T21), also known as Down syndrome, re-sults from the total or partial trisomy of chromosome 21 (HSA21). It is the most frequent live-born aneuploidy, affecting 1 in 750 infants [1]. The T21 patients are char-acterized by a cognitive impairment and may also have muscle hypotonia, dysmorphic features, Alzheimer’s dis-ease (AD), neuropathology, and congenital heart defects [1, 2]. The severity and the phenotypic incidence of T21 vary across patients. Among its possible causes, the gen-etic (or epigengen-etic) background of each individual with T21 may contribute to this phenotypic variability.
It is likely that most of the T21 phenotypes are related to alterations in gene expression due to the supernumer-ary copy of HSA21. According to the‘gene dosage effect’ hypothesis, some T21 features could be directly ex-plained by the dosage imbalances of genes on HSA21 [3–5]. Therefore, most prior studies have focused on changes in the expression of HSA21 genes in certain tis-sues (such as fibroblasts [6], whole blood [7], T cells [8], brain [9, 10], and heart [6, 10]) from patients with T21. We also performed a comprehensive survey of genes on HSA21 in placentas of T21 fetuses and profiled expres-sion of 207 genes on HSA21 [11]. Among them, 47 genes showed significantly increased expression in the T21 placenta compared to the normal placenta [11]. The increased genes in the T21 placenta were significantly associated with T21 and T21 complications such as mental retardation, neurobehavioral manifestations, and congenital abnormalities [11]. However, T21 phenotypes
* Correspondence:[email protected];[email protected]
†Equal contributors
3Department of Obstetrics & Gynecology, Division of Maternal-Fetal
Medicine, Ewha Womans University, School of Medicine, Seoul, South Korea
1Laboratory of Medical Genetics, Medical Research Institute, Cheil General
Hospital and Women’s Healthcare Center, Seoul, South Korea Full list of author information is available at the end of the article
© The Author(s). 2017 Open Access This article is distributed under the terms of the Creative Commons Attribution 4.0 International License (http://creativecommons.org/licenses/by/4.0/), which permits unrestricted use, distribution, and reproduction in any medium, provided you give appropriate credit to the original author(s) and the source, provide a link to the Creative Commons license, and indicate if changes were made. The Creative Commons Public Domain Dedication waiver (http://creativecommons.org/publicdomain/zero/1.0/) applies to the data made available in this article, unless otherwise stated.
may also result from the presence of extra genomic ma-terial. Recently, other researchers have demonstrated that the extra HSA21 has deleterious effects that can be seen across the entire genome [12]. Gene expression changes in HSA21 can also affect the gene expression of other chromosomes through the modulation of tran-scription factors, chromatin remodeling proteins, or re-lated molecules [13–15]. Therefore, understanding the whole genomic determinants that contribute to the vari-ous phenotypes of T21 is a major objective in T21 research.
In this study, we investigated whole human genome expression in placentas of euploid and T21 fetuses using microarray technology and identified genes that were ab-errantly expressed in placentas from fetuses with T21. We also analyzed the biological function and molecular pathways of the identified genes using various bioinfor-matics tools.
Methods
Study subjects
This study was conducted in accordance with the Declaration of Helsinki. Appropriate institutional review board approval was obtained from the Ethics Committee at Cheil General Hospital (#CGH-IRB-2011-85). All pa-tients provided written informed consent for sample col-lection and subsequent analysis. Pregnant women with normal or T21 fetuses who were treated at the Depart-ment of Obstetrics and Gynecology, Cheil General Hos-pital Korea were recruited between March 2011 and December 2016. All placenta samples were obtained by chorionic villus sampling (CVS) in the first trimester (11 weeks - 13 weeks of gestation) and stored in liquid nitrogen until analysis.
Cytogenetic analysis for fetal karyotype
Chromosomal analyses of fetal CVS were carried out using standard protocols as in our previous study [11]. The cells were cultured in the AmnioMAX-C100 culture medium (Invitrogen, Carlsbad, CA, USA). Metaphase chromosomes were stained using the GTG banding method. Twenty metaphases per sample were analyzed. All T21 samples used in this study were complete T21 and all normal samples were completely euploid.
Gene expression profiling using microarray Array hybridizations
Total RNA was extracted from the placentas of normal (n = 12) and T21 (n = 6) fetuses using the TRI Reagent (Molecular Research Center, Inc., Cincinnati, OH, USA) according to the manufacturer’s instructions. The RNA was purified using the RNeasy MinElute Cleanup Kit (QIAGEN, Hilden, Germany), as recommended by the manufacturers. Quantity and quality of RNA were
measured using a NanoVue™ Plus Spectrophotometer (GE, London, UK) and an Agilent 2100 Bioanalyzer (Agi-lent Technologies, Santa Clara, CA, USA). An RNA
integ-rity number ≥ 7.0 was considered acceptable for the
microarray analysis. Therefore, the placental RNAs of nor-mal (n = 5) and T21 (n = 3) fetuses were used for whole human genome expression array and their hybridizations carried out separately. Gene expression profiles were determined using the Affymetrix GeneChip Human Genome U133 Plus 2.0 Array (Affymetrix Inc., Santa Clara, CA, USA). The array was used to analyze the expression level of over 47,000 transcripts and variants, including 38,500 well-characterized human genes. Eleven pairs of oligonucleotide probes were used to measure the transcription level of each sequence. GeneChips were washed and stained using the Affymetrix Fluidics Station 450 (Affymetrix Inc.) and scanned using the Affymetrix GeneChip Scanner 3000 7G (Affymetrix Inc.).
Gene expression analysis
Expression data were extracted from the scanned images using Expression Console 1.3.1 software (Affymetrix Inc.) and analyzed with robust multichip analysis using Affyme-trix default analysis settings and global scaling as the
normalization method. The trimmed mean target
intensity of each array was arbitrarily set to 100. The nor-malized, and log-transformed intensity values were ana-lyzed using GeneSpring GX 12.6.1 (Agilent Technologies). Genes withP values <0.05 were considered to be signifi-cantly differentially expressed between the T21 and
normal groups. The P values were corrected using the
Benjamini and Hochberg false discovery rate (FDR) method to control false positive results from multiple testing [16]. The fold change filters included the require-ment that the genes be present in at least 1.5-fold of controls. The genes (P < 0.05 and FDR < 0.05 with 1.5-fold expression change) were selected as candidates for further analysis.
Comparison to T21 fetal brain and T21 adult brain
A publicly available microarray dataset of human T21 fetal brains [10] and T21 adult brains [17] was used to compare the results from T21 fetal placenta. Microarray data for brain of T21 and control subjects were down-loaded from the Pevsner Laboratory Web site (http:// pevsnerlab.kennedykrieger.org/ds_cel_files.htm) and the Gene Expression Omnibus (GEO, http://www.ncbi.nlm.-nih.gov/geo/). The dataset was reanalyzed using the methods described above. We analyzed genes that were up-regulated or down-regulated according to presence or absence of T21 among the fetal placenta, fetal brain, and adult brain.
Quantitative real-time PCR
The TRIzol reagent was used to extract total RNA from the placentas of normal (n = 5) and T21 (n = 5) fetuses according to the manufacturer’s instructions. The RNA was purified using the RNeasy MinElute Cleanup Kit (QIAGEN, Hilden, Germany) as recommended by the manufacturers. Quantity and quality measurements were made using a NanoVue™ Plus Spectrophotometer (GE, London, UK) and an Agilent 2100 Bioanalyzer (Agilent Technologies, Santa Clara, CA, USA). The PCR reaction solution for synthesis of complementary DNA (cDNA)
contained 10 ng of RNA sample, 0.15 μL 100 mm
dNTPs, 1 μL reverse transcriptase (10 U/μL), and
0.19 μL RNase inhibitor (20 U/μL) per 9.16 μL total
re-action volume. The thermal profile consisted of 16 °C for 30 min, 42 °C for 30 min, and 95 °C for 5 min.
Quantitative real-time PCR was carried out in a 20 μL
reaction mixture containing 0.5 μL cDNA (10 ng/μL),
10 μL SYBR Green PCR Master Mix (Applied
Biosys-tems, Foster City, California), 0.8 μL primer set, and
8.7 μL of sterile water. Glyceraldehy3-phosphate
de-hydrogenase (GAPDH), a housekeeping gene, was used as an internal control. Amplification was followed by 40 cycles of denaturation at 95 °C for 30 s, annealing at 60 °C for 30 s and extension at 72 °C for 30 s on an ABI PRISM 7500 sequence detection system (Applied Biosys-tems). All PCR reactions were performed in triplicate, and no template controls were included in any run. The primer specificity was confirmed by melting (dissoci-ation) curve analysis. Comparative quantitation of each target gene was performed based on the cycle threshold
(Ct), which was normalized against the Ct of GAPDH
using the ΔΔCT method. Primer sets and melting
temperature for quantitative real-time PCR are described in supplemental data.
Functional annotation analysis of the candidates
The lists of candidate genes were submitted to a func-tional annotation tool provided by WebGestalt (http:// www.webgestalt.org/webgestalt_2013/). Functional anno-tation analysis of the candidates was performed accord-ing to the presence or absence of inclusion of HSA21 candidate genes. Gene ontology (GO) analysis and disease-associated gene analysis were performed. The GO analysis was performed using a statistic hypergeo-metric test with a significance level of adjP < 0.05, a Benjamini and Hochberg multiple test adjustment, and a minimum of two genes. The candidate genes were annotated by the Kyoto Encyclopedia of Genes and Genomes (KEGG) pathway analysis. Next, we used the Search Tool for the Retrieval of Interacting Genes (STRING v. 10.0) database to predict an inter-active network of candidate genes. The target genes were considered seed molecules to obtain direct and
indirect protein-protein interactions. This database provides information regarding experimental and predicted interac-tions from varied sources based on their neighborhood, gene fusion, co-occurrence, co-expression, experiments, and literature mining. We constructed an interactive net-work of candidate genes with a confidence score of 0.4.
Statistical analysis
The clinical characteristics of the study population were analyzed using the Mann-Whitney U-test and Wilcoxon Signed Ranks test. In all tests, a P-value <0.05 was con-sidered statistically significant. Statistical analyses were performed using the Statistical Package for Social Sciences 12.0 (SPSS Inc., Chicago, IL, USA).
Results
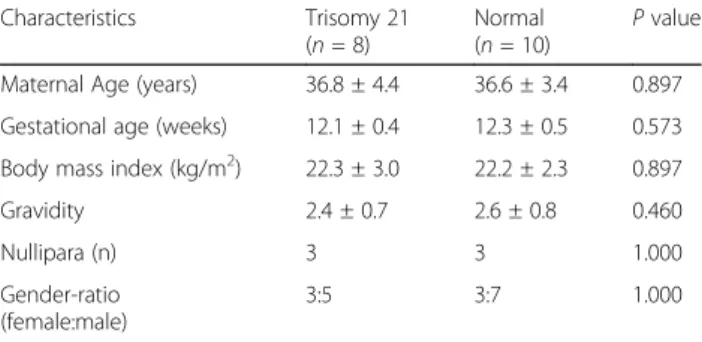
The clinical characteristics of the study population are provided in Table 1. At the time of tissue sampling, there were no significant difference between the two groups with regard to maternal age, gestational age, body mass index, gravidity, nulliparity, and gender ratio of the fetuses (P > 0.05 for all).
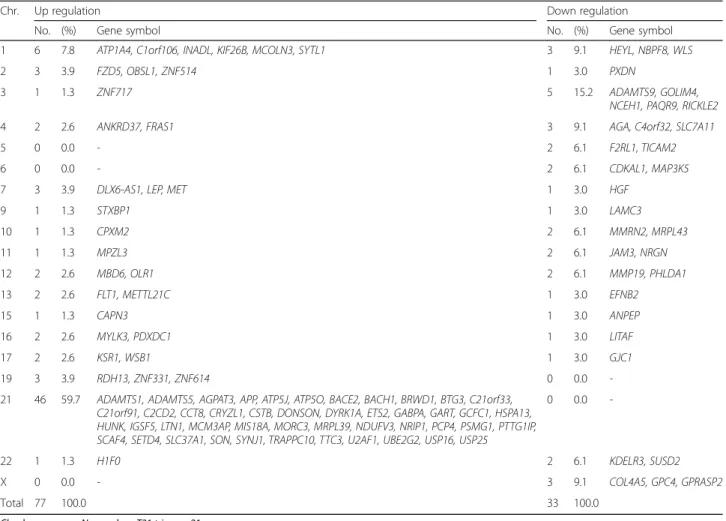
We analyzed the expression level of over 47,000 tran-scripts and variants, including 38,500 well-characterized human genes. We identified differentially expressed genes in T21 placenta samples compared with normal placenta samples. According to criteria of gene expres-sion (FDR < 0.05 with 1.5-fold expresexpres-sion change), 110 genes had significant expression differences between T21 and normal placentas (Supplemental data). Seventy-seven genes were up-regulated in T21 placenta samples, while 33 genes were down-regulated (Table 2). The chromosomal distributions of the candidate genes are shown in Table 2. Over half (59.7%) of the up-regulated genes in T21 were located on HSA21. In contrast, the down-regulated genes were distributed on various chro-mosomes, not including HSA21-derived genes.
Additionally, we compared the expression data from adult and fetal brain tissue to further investigate the gene expression changes observed in T21. A publicly available dataset of fetal and adult human brains was
Table 1 Clinical characteristics of the study population
Characteristics Trisomy 21 (n = 8)
Normal (n = 10)
P value Maternal Age (years) 36.8 ± 4.4 36.6 ± 3.4 0.897 Gestational age (weeks) 12.1 ± 0.4 12.3 ± 0.5 0.573 Body mass index (kg/m2) 22.3 ± 3.0 22.2 ± 2.3 0.897
Gravidity 2.4 ± 0.7 2.6 ± 0.8 0.460
Nullipara (n) 3 3 1.000
Gender-ratio (female:male)
3:5 3:7 1.000
reanalyzed according to the criteria of this study (FDR < 0.05 with 1.5-fold expression change). In adult brains with T21, 1027 genes were up-regulated and 179 genes were down-regulated compared to their respective expression patterns in normal adult brains (Fig. 1a). In fetal brains with T21, 156 genes were up-regulated and 373 genes were down-regulated (Fig. 1b). Of the up-regulated genes in the adult brains, fetal brains, and fetal placentas with T21, 12 (APP, C21orf33, C2CD2, CSTB, HSPA13, LTN1, MORC3, MRPL39, NRIP1, PTTG1IP, TRAPPC10, USP16) were commonly up-regulated re-gardless of tissue type or developmental stage (Fig. 1a). These 12 genes were all located on HSA21. In contrast, none of the down-regulated genes were commonly down-regulated across the tissue types and developmen-tal stages. Two genes (CDKAL1 and GJC1) were commonly down-regulated in both fetal brains and fetal placentas (Fig. 1b).
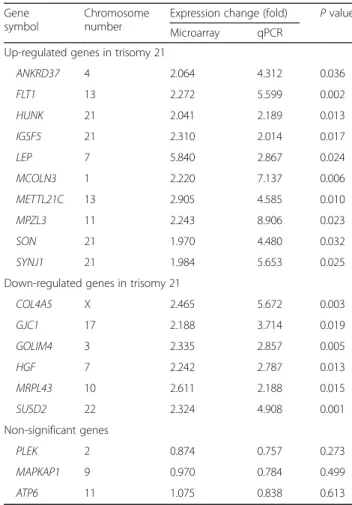
To confirm expression changes of array, we performed quantitative real-time PCR. We randomly selected 10 up-regulated genes, 6 down-regulated genes, 3
non-significant genes based on microarray data. TheGAPDH
was used as a reference gene. We compared their mRNA levels between T21 and euploid samples. The expression patterns of genes were consistent with array data (Table 3).
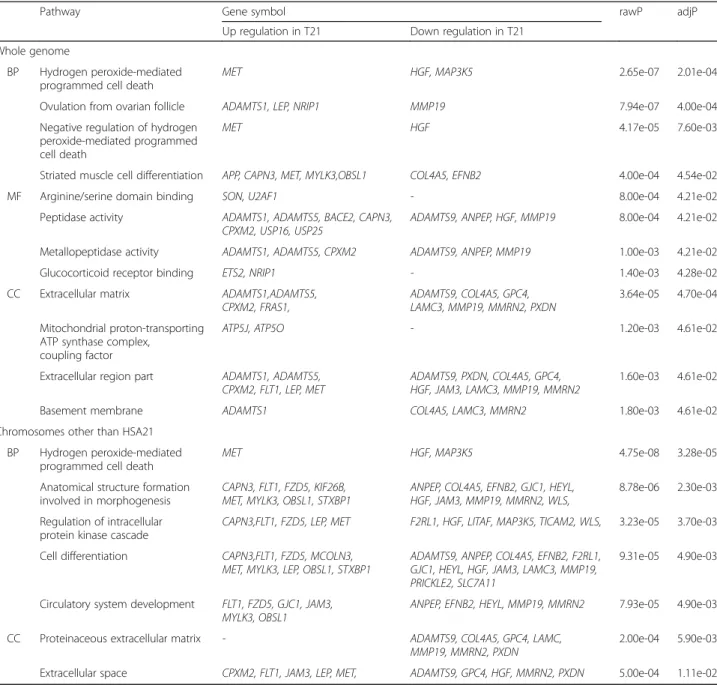
We performed functional annotation analysis of the genes that were differentially expressed in T21 according to the presence or absence of inclusion of HSA21 candi-date genes. In GO analysis of the 110 candicandi-date genes in whole genome, the genes were analyzed in all categories including biological process (BP), cellular component (CC), and molecular function (MF) (Table 4). In the BP category, the most statistically significant associations were found in hydrogen peroxide-mediated programmed cell death (rawP = 2.65e-07, adjP = 2.01e-04). The
argin-ine/serine domain binding and peptidase activity
(rawP = 8.00e-04, adjP = 4.21e-02) in the MF category,
as well as the extracellular matrix (rawP = 3.64e-05,
adjP = 4.70e-04) in the CC category were most signifi-cantly associated with the candidate genes. In addition, GO analysis was performed with the 64 candidates of chromosomes other than HSA21. In the BP category, the most statistically significant associations were found
Table 2 Candidate genes that are differentially expressed in T21 placentas
Chr. Up regulation Down regulation
No. (%) Gene symbol No. (%) Gene symbol
1 6 7.8 ATP1A4, C1orf106, INADL, KIF26B, MCOLN3, SYTL1 3 9.1 HEYL, NBPF8, WLS
2 3 3.9 FZD5, OBSL1, ZNF514 1 3.0 PXDN
3 1 1.3 ZNF717 5 15.2 ADAMTS9, GOLIM4,
NCEH1, PAQR9, RICKLE2
4 2 2.6 ANKRD37, FRAS1 3 9.1 AGA, C4orf32, SLC7A11
5 0 0.0 - 2 6.1 F2RL1, TICAM2
6 0 0.0 - 2 6.1 CDKAL1, MAP3K5
7 3 3.9 DLX6-AS1, LEP, MET 1 3.0 HGF
9 1 1.3 STXBP1 1 3.0 LAMC3 10 1 1.3 CPXM2 2 6.1 MMRN2, MRPL43 11 1 1.3 MPZL3 2 6.1 JAM3, NRGN 12 2 2.6 MBD6, OLR1 2 6.1 MMP19, PHLDA1 13 2 2.6 FLT1, METTL21C 1 3.0 EFNB2 15 1 1.3 CAPN3 1 3.0 ANPEP 16 2 2.6 MYLK3, PDXDC1 1 3.0 LITAF 17 2 2.6 KSR1, WSB1 1 3.0 GJC1 19 3 3.9 RDH13, ZNF331, ZNF614 0 0.0
-21 46 59.7 ADAMTS1, ADAMTS5, AGPAT3, APP, ATP5J, ATP5O, BACE2, BACH1, BRWD1, BTG3, C21orf33, C21orf91, C2CD2, CCT8, CRYZL1, CSTB, DONSON, DYRK1A, ETS2, GABPA, GART, GCFC1, HSPA13, HUNK, IGSF5, LTN1, MCM3AP, MIS18A, MORC3, MRPL39, NDUFV3, NRIP1, PCP4, PSMG1, PTTG1IP, SCAF4, SETD4, SLC37A1, SON, SYNJ1, TRAPPC10, TTC3, U2AF1, UBE2G2, USP16, USP25
0 0.0
-22 1 1.3 H1F0 2 6.1 KDELR3, SUSD2
X 0 0.0 - 3 9.1 COL4A5, GPC4, GPRASP2
Total 77 100.0 33 100.0
in hydrogen peroxide-mediated programmed cell death
such as results in whole genome (rawP = 4.75e-08,
adjP = 3.28e-05). However, there were no genes in the
MF category with statistically significant changes in tran-script level. In the CC category, the proteinaceous extra-cellular matrix category was the most significantly
associated with the candidate genes (rawP = 2.00e-04,
adjP = 5.90e-03).
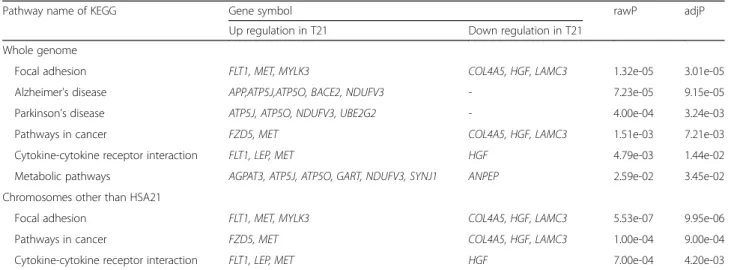
In KEGG analysis of the 110 candidate genes in whole genome, various pathways such as those of focal adhe-sion, AD, and Parkinson’s disease were significantly asso-ciated with the differently expressed genes in T21 (both rawP and adjP < 0.001 in all, Table 5). In KEGG analysis of the 64 candidate genes in chromosomes other than HSA21, focal adhesion, cancer pathway, and cytokine-cytokine receptor interaction were found statistically sig-nificant pathway (both rawP and adjP < 0.01 in all, Table 5). These pathways were found in KEGG analysis of the candidates in whole genome including HSA21.
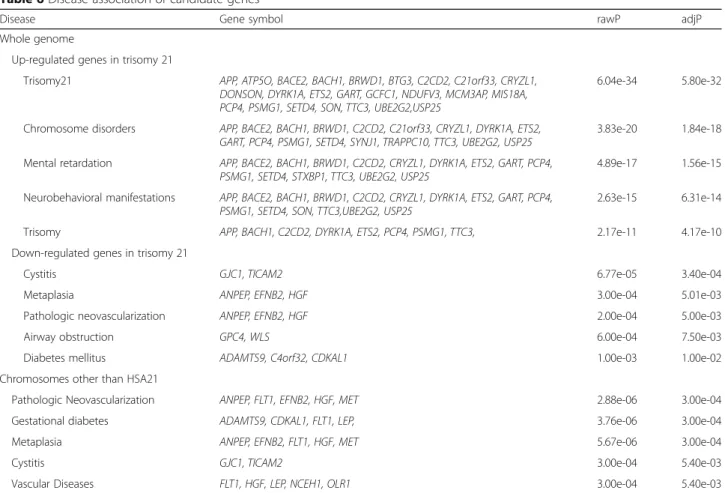
The disease association of the candidate genes in whole genome was analyzed separately according to ex-pression pattern in T21 (Table 6). In the up-regulated candidate genes, the most statistically significant
associ-ation was identified in T21 (rawP = 6.04e-34,
adjP = 5.80e-32). Many genes were significantly associ-ated with T21 complications such as chromosome
disor-ders, mental retardation, and neurobehavioral
manifestations. In the down-regulated candidate genes, Fig. 1 Comparison of differentially expressed genes in adult brain, fetal
brain, and fetal placenta of T21. The up-regulated genes in the adult brains, fetal brains, and fetal placentas with T21 were 1027, 156, and 77, respectively (a). Of the up-regulated genes, 12 (APP, C21orf33, C2CD2, CSTB, HSPA13, LTN1, MORC3, MRPL39, NRIP1, PTTG1IP, TRAPPC10, USP16) were commonly up-regulated in all tissues, regardless of tissue types and developmental stages (a). The down-regulated genes in the adult brains, fetal brains, and fetal placentas with T21 were 179, 373, and 33, respectively (b). None of the down-regulated genes were commonly down-regulated across the tissue types and developmental stages. Two genes (CDKAL1 and GJC1) were down-regulated in both fetal brains and fetal placentas (b)
Table 3 Quantitative real-time PCR results for selected genes
Gene symbol
Chromosome number
Expression change (fold) P value Microarray qPCR
Up-regulated genes in trisomy 21
ANKRD37 4 2.064 4.312 0.036 FLT1 13 2.272 5.599 0.002 HUNK 21 2.041 2.189 0.013 IGSF5 21 2.310 2.014 0.017 LEP 7 5.840 2.867 0.024 MCOLN3 1 2.220 7.137 0.006 METTL21C 13 2.905 4.585 0.010 MPZL3 11 2.243 8.906 0.023 SON 21 1.970 4.480 0.032 SYNJ1 21 1.984 5.653 0.025
Down-regulated genes in trisomy 21
COL4A5 X 2.465 5.672 0.003 GJC1 17 2.188 3.714 0.019 GOLIM4 3 2.335 2.857 0.005 HGF 7 2.242 2.787 0.013 MRPL43 10 2.611 2.188 0.015 SUSD2 22 2.324 4.908 0.001 Non-significant genes PLEK 2 0.874 0.757 0.273 MAPKAP1 9 0.970 0.784 0.499 ATP6 11 1.075 0.838 0.613
Data were normalized to theGAPDH housekeeping gene. Values for microarray data are fold intensity. For each quantitative PCR experiment, values were determined by measuring samples in triplicate (mean ± standard deviation). Each experiment was performed independently at least three times.P values are derived from quantitative real-time PCR data
GJC1 and TICAM2 demonstrated the most statistically significant association with cystitis (rawP = 6.77e-05, adjP = 3.40e-04). ANPEP, EFNB2 and HGF were signifi-cantly associated with metaplasia and pathologic neovas-cularization (rawP and adjP < 0.01 in all). Other genes were significantly associated with airway obstruction and diabetes mellitus (rawP and adjP < 0.05 in all). In disease analysis of the 64 candidate genes in chromosomes other than HSA21, pathologic neovascularization showed the most statistically significant association with the differ-ently expressed genes in T21 (rawP = 2.88e-06, adjP = 3.00e-04). Unlike the results of disease
association analysis in whole genome, gestational dia-betes and vascular disease were significantly associated (rawP and adjP < 0.01 in all, Table 6).
The interactive signaling networks were constructed using genes that were differentially expressed in the T21 placenta compared to the normal placenta. Based on 77 genes that were up-regulated in T21 placentas, the inter-action network has significance beyond statistical data. Thirty-four genes made up the dynamic complex of sig-naling (P < 3.88e-09, data not shown). With regard to the 33 down-regulated genes in T21 placentas, there was only one expected edges between ADAMTS9 and
Table 4 GO analysis of candidate genes
Pathway Gene symbol rawP adjP
Up regulation in T21 Down regulation in T21 Whole genome
BP Hydrogen peroxide-mediated programmed cell death
MET HGF, MAP3K5 2.65e-07 2.01e-04
Ovulation from ovarian follicle ADAMTS1, LEP, NRIP1 MMP19 7.94e-07 4.00e-04
Negative regulation of hydrogen peroxide-mediated programmed cell death
MET HGF 4.17e-05 7.60e-03
Striated muscle cell differentiation APP, CAPN3, MET, MYLK3,OBSL1 COL4A5, EFNB2 4.00e-04 4.54e-02
MF Arginine/serine domain binding SON, U2AF1 - 8.00e-04 4.21e-02
Peptidase activity ADAMTS1, ADAMTS5, BACE2, CAPN3, CPXM2, USP16, USP25
ADAMTS9, ANPEP, HGF, MMP19 8.00e-04 4.21e-02 Metallopeptidase activity ADAMTS1, ADAMTS5, CPXM2 ADAMTS9, ANPEP, MMP19 1.00e-03 4.21e-02
Glucocorticoid receptor binding ETS2, NRIP1 - 1.40e-03 4.28e-02
CC Extracellular matrix ADAMTS1,ADAMTS5, CPXM2, FRAS1,
ADAMTS9, COL4A5, GPC4, LAMC3, MMP19, MMRN2, PXDN
3.64e-05 4.70e-04 Mitochondrial proton-transporting
ATP synthase complex, coupling factor
ATP5J, ATP5O - 1.20e-03 4.61e-02
Extracellular region part ADAMTS1, ADAMTS5, CPXM2, FLT1, LEP, MET
ADAMTS9, PXDN, COL4A5, GPC4, HGF, JAM3, LAMC3, MMP19, MMRN2
1.60e-03 4.61e-02
Basement membrane ADAMTS1 COL4A5, LAMC3, MMRN2 1.80e-03 4.61e-02
Chromosomes other than HSA21 BP Hydrogen peroxide-mediated
programmed cell death
MET HGF, MAP3K5 4.75e-08 3.28e-05
Anatomical structure formation involved in morphogenesis
CAPN3, FLT1, FZD5, KIF26B, MET, MYLK3, OBSL1, STXBP1
ANPEP, COL4A5, EFNB2, GJC1, HEYL, HGF, JAM3, MMP19, MMRN2, WLS,
8.78e-06 2.30e-03 Regulation of intracellular
protein kinase cascade
CAPN3,FLT1, FZD5, LEP, MET F2RL1, HGF, LITAF, MAP3K5, TICAM2, WLS, 3.23e-05 3.70e-03 Cell differentiation CAPN3,FLT1, FZD5, MCOLN3,
MET, MYLK3, LEP, OBSL1, STXBP1
ADAMTS9, ANPEP, COL4A5, EFNB2, F2RL1, GJC1, HEYL, HGF, JAM3, LAMC3, MMP19, PRICKLE2, SLC7A11
9.31e-05 4.90e-03
Circulatory system development FLT1, FZD5, GJC1, JAM3, MYLK3, OBSL1
ANPEP, EFNB2, HEYL, MMP19, MMRN2 7.93e-05 4.90e-03 CC Proteinaceous extracellular matrix - ADAMTS9, COL4A5, GPC4, LAMC,
MMP19, MMRN2, PXDN
2.00e-04 5.90e-03 Extracellular space CPXM2, FLT1, JAM3, LEP, MET, ADAMTS9, GPC4, HGF, MMRN2, PXDN 5.00e-04 1.11e-02
HSA21 human chromosome 21, BP biological process, MF molecular function, CC cellular component, T21 trisomy 21 rawP:p value from hypergeometric test, adjP: p value adjusted by the multiple test adjustment
CDKAL1 (P < 0.75, data not shown). The interaction network has significance beyond the statistical data with regard to all 110 genes that were differentially expressed between T21 and normal placentas. Fifty-three genes (40 up-regulated genes and 13 down-regulated genes) were an integral part of the dynamic complex of signaling under a confidence score of 0.4 (P < 1.39e-08, Fig. 2). In the interactive signaling net-works, various down-regulated genes act as connecting nodes in the dynamic complex of up-regulated genes. Of the 53 interacting genes, 11 were commonly up-regulated in the adult brain, fetal brain, and fetal placenta with T21 (green circle). Sixteen interacting genes were significantly associated with T21 (blue circle, P < 1.46e-34). One major cluster of the inter-active signaling networks was identified and consisted of 35 up-regulated and 8 down-regulated genes. Center gene of the cluster was synaptojanin 1(SYNJ1) that was
connected with 11 genes including STXBP1, DYRK1A,
PTTG1IP, NDUFV3, U2AF1, HUNK, CRYZL1, LTN1, TRAPPC10, GCFC1, and EFNB2.
Discussion
T21 is caused by an extra copy of all or part of HSA21. The main etiology of this disease is thought to result from the potential implications of imbalanced expression of genes on HSA21 [3–5]. Most studies have confirmed a primary gene dosage effect of HSA21 in T21. However, the downstream consequences of T21 are complex. Therefore, in addition to primary gene dosage effects, secondary (downstream) effects on disomic genes are also likely to play a major role in T21. On HSA21, gene expression may be regulated by dosage compensation or other mechanisms. Therefore, only a subset of those genes is expressed at the expected 50% increased levels. For genes assigned to chromosomes other than HSA21,
the effect of T21 could either be relatively subtle or mas-sively disruptive. Gene expression changes in HSA21 are likely to affect the gene expression on other chromo-somes through the modulation of transcription factors, chromatin remodeling proteins, or related molecules [15–17]. Another study about transcriptome analysis of monozygotic twins discordant for T21 identified the ex-istence of chromosomal domains of gene expression dys-regulation between trisomic and normal fibroblasts [12]. These results suggested that the nuclear compartments of trisomic cells undergo modifications of the chromatin environment affecting the overall transcriptome and that gene expression dysregulation domains may have an in-fluence on some T21 phenotypes [12]. Therefore, recent studies have suggested that the trisomy has effects on the expression of disomic genes. Understanding the whole genomic determinants that contribute to the vari-ous phenotypes of T21 has become a major objective in T21 research.
In this study, we investigated the whole genome of placentas from human fetuses with T21 compared to those of euploid fetuses. We found 110 genes that were differently expressed in the T21 placenta compared to in the euploid fetuses. Among them, 77 genes were up-regulated and 33 were down-up-regulated in the T21 placenta compared to their respective expression levels in euploid placentas. More than half of the up-regulated
genes (59.7%, n = 46) are located on HSA21, whereas
the down-regulated genes are located on various chro-mosomes, not including HSA21. Especially, 12 genes on
HSA21 (including APP, C21orf33, C2CD2, CSTB,
HSPA13, LTN1, MORC3, MRPL39, NRIP1, PTTG1IP, TRAPPC10, USP16) were commonly up-regulated in the adult brains, fetal brains, and fetal placentas with T21, regardless of tissue type or developmental stage. We also found that various genes on chromosomes other than
Table 5 Pathway analysis of candidate genes
Pathway name of KEGG Gene symbol rawP adjP
Up regulation in T21 Down regulation in T21 Whole genome
Focal adhesion FLT1, MET, MYLK3 COL4A5, HGF, LAMC3 1.32e-05 3.01e-05
Alzheimer’s disease APP,ATP5J,ATP5O, BACE2, NDUFV3 - 7.23e-05 9.15e-05
Parkinson’s disease ATP5J, ATP5O, NDUFV3, UBE2G2 - 4.00e-04 3.24e-03
Pathways in cancer FZD5, MET COL4A5, HGF, LAMC3 1.51e-03 7.21e-03
Cytokine-cytokine receptor interaction FLT1, LEP, MET HGF 4.79e-03 1.44e-02
Metabolic pathways AGPAT3, ATP5J, ATP5O, GART, NDUFV3, SYNJ1 ANPEP 2.59e-02 3.45e-02 Chromosomes other than HSA21
Focal adhesion FLT1, MET, MYLK3 COL4A5, HGF, LAMC3 5.53e-07 9.95e-06
Pathways in cancer FZD5, MET COL4A5, HGF, LAMC3 1.00e-04 9.00e-04
Cytokine-cytokine receptor interaction FLT1, LEP, MET HGF 7.00e-04 4.20e-03
HSA21 were up-regulated or down-regulated in the T21 placentas. Additionally, the results of functional annota-tion analysis using candidates of whole genome were in-cluded all those according to the presence or absence of HSA21 candidate genes. These results suggest that the whole genomic imbalance in T21 may have an influence on the various phenotypes of T21.
In addition, we identified several gene clusters associ-ated with T21 using in-silico pathway-based exploratory analysis of genes with expressions specific to T21 placentas. These clusters demonstrated an association between up-regulated genes and down-regulated genes in T21 placentas. In our study, network of the 33
down-regulated genes was only found betweenADAMTS9 and
CDKAL1. However, the 13 down-regulated genes were part of the network of 110 genes specific to T21 placen-tas. These genes acted as a connecting node of discon-nected clusters in the network of up-regulated genes. Therefore, we predicted one major cluster that consisted of 35 up-regulated genes and 8 down-regulated genes (red node, Fig. 1). The center gene of the cluster was synaptojanin 1(SYNJ1), which was connected with the
following 11 genes:CRYZL1, DYRK1A, EFNB2, GCFC1,
HUNK, LTN1, NDUFV3, PTTG1IP, STXBP1,
TRAPPC10, and U2AF1. The SYNJ1 is located on HSA21 and is coding the synapse associated protein that is of key interest in T21. The gene is present in triplicate in T21 [18]. SYNJ1 is a brain enriched phosphoinositide phosphatase [19] that is involved with endocytosis and synaptic vesicle cycling [20, 21]. A proper dosage of this gene is required for proper synaptic activity. Several studies using immunocytochemical or western blotting approaches have identified increased SYNJ1 protein levels in the DS brain [22], particularly within the frontal cortex [23]. Interestingly, our network shows the possi-bility of various new processes, including SYNJ1, in the molecular mechanisms related to the pathophysiology of T21. First, SYNJ1 could be related to APP via DYRK1A and MAP3K5. T21 patients, who carry a triplication of both SYNJ1 and APP, develop early-onset AD [24]. This could be the result of overexpressed APP alone; however, some lines of evidence argue in favor of the combined effects of these two genes in AD development. The beneficial impact of SYNJ1 reduction in AD was con-firmed in a mouse model of AD [25]. In these animals, the hemizygous deletion of SYNJ1 rescued deficits in learning and memory. This protective effect is a result of a decrease in amyloid plaque burden mediated through
Table 6 Disease association of candidate genes
Disease Gene symbol rawP adjP
Whole genome
Up-regulated genes in trisomy 21
Trisomy21 APP, ATP5O, BACE2, BACH1, BRWD1, BTG3, C2CD2, C21orf33, CRYZL1, DONSON, DYRK1A, ETS2, GART, GCFC1, NDUFV3, MCM3AP, MIS18A, PCP4, PSMG1, SETD4, SON, TTC3, UBE2G2,USP25
6.04e-34 5.80e-32
Chromosome disorders APP, BACE2, BACH1, BRWD1, C2CD2, C21orf33, CRYZL1, DYRK1A, ETS2, GART, PCP4, PSMG1, SETD4, SYNJ1, TRAPPC10, TTC3, UBE2G2, USP25
3.83e-20 1.84e-18 Mental retardation APP, BACE2, BACH1, BRWD1, C2CD2, CRYZL1, DYRK1A, ETS2, GART, PCP4,
PSMG1, SETD4, STXBP1, TTC3, UBE2G2, USP25
4.89e-17 1.56e-15 Neurobehavioral manifestations APP, BACE2, BACH1, BRWD1, C2CD2, CRYZL1, DYRK1A, ETS2, GART, PCP4,
PSMG1, SETD4, SON, TTC3,UBE2G2, USP25
2.63e-15 6.31e-14
Trisomy APP, BACH1, C2CD2, DYRK1A, ETS2, PCP4, PSMG1, TTC3, 2.17e-11 4.17e-10
Down-regulated genes in trisomy 21
Cystitis GJC1, TICAM2 6.77e-05 3.40e-04
Metaplasia ANPEP, EFNB2, HGF 3.00e-04 5.01e-03
Pathologic neovascularization ANPEP, EFNB2, HGF 2.00e-04 5.00e-03
Airway obstruction GPC4, WLS 6.00e-04 7.50e-03
Diabetes mellitus ADAMTS9, C4orf32, CDKAL1 1.00e-03 1.00e-02
Chromosomes other than HSA21
Pathologic Neovascularization ANPEP, FLT1, EFNB2, HGF, MET 2.88e-06 3.00e-04
Gestational diabetes ADAMTS9, CDKAL1, FLT1, LEP, 3.76e-06 3.00e-04
Metaplasia ANPEP, EFNB2, FLT1, HGF, MET 5.67e-06 3.00e-04
Cystitis GJC1, TICAM2 3.00e-04 5.40e-03
Vascular Diseases FLT1, HGF, LEP, NCEH1, OLR1 3.00e-04 5.40e-03
accelerated endosomal/lysosomal degradation of Aβ [26]. These data underline the potential of SYNJ1 reduc-tion as a possible therapeutic strategy to counteract AD pathology. Our network shows that SYNJ1 and APP in T21 could be simultaneously regulated by the
up-regulation of DYRK1A and down-regulation of
MAP3K5. This connection might provide new insight into the pathophysiology related with SYNJ1 and APP in T21 with AD. In addition, SYNJ1 could be associated with genes that play roles in mitochondrial function such as two genes encoding subunits of ATP synthase
(ATP5O and ATP5J) and mitochondrial ribosomal
pro-tein L39 (MRPL39) via CRYZL1. The expression levels
of these genes were increased in our microarray experi-ments, as well as in a previous study [10]. Additionally, various mitochondrion-related functional groups were significantly regulated. The abnormal regulation of these transcripts and functional groups could explain the im-paired mitochondrial function that has been observed in T21 [27]. Overall, our findings warrant further studies addressing these new clusters of genes associated with the pathogenesis of T21. However, a lot of our results were based on databases of bioinformatics tools. Al-though these in-silico bioinformatics’ tools are useful to predict the new insight of multi genes associated with the pathophysiology of disorder, these in-silico results could be not strong data to justify the functional signifi-cance of genes. Moreover, this study was limited by its small sample size. Therefore, a larger scale study is needed to provide enough evidence to highlight the functional significance of the identified genes in the pathophysiology of T21.
Conclusions
To our knowledge, this is the first study to comprehen-sively survey the whole human genomes from placentas of T21 fetuses. This study identified 110 genes that were differentially expressed in euploid fetuses and those with T21. Our results demonstrate that these genes may regulate the many biological pathways that have been implicated in T21 and its complications are possibly reg-ulated by these genes. Therefore, this work provides a variety of information that contributes to a better under-standing of the molecular mechanisms and biological pathways of T21.
Abbreviations
AD:Alzheimer’s disease; BP: Biological process; CC: Cellular component; CVS: Chorionic villus samples; FDR: False discovery rate; GO: Gene ontology; HSA21: Human chromosome 21; KEGG: Kyoto encyclopedia of genes and genomes; MF: Molecular function; T21: Trisomy 21
Acknowledgments
We thank the following physicians and their associated staff for their time and effort in this study; Jin Woo Kim, Da Eun Lee, Bom Yi Lee, Do Jin Kim, Ju Yeon Park, Shin Young Kim, Yeon Woo Lee, Shin Young Lee, Ah Rum Oh, and So Min Seo. Funding
This study was supported by grant of the Korea Health Technology R&D Project through the Korea Health Industry Development Institute (KHIDI), funded by the Ministry of Health & Welfare, Republic of Korea (grant number: HI16C0628 and A111550).
Availability of data and materials
The data supporting our findings is contained within the manuscript and supplemental data.
Authors’ contributions
Conception and design: LJH, HYJ, CSH, and RHM. Experimental part, analysis and interpretation of data: LJH, HYJ, KHJ, and PSY. Preparation of the manuscript: LJH, HYJ, KHJ, and KDW. Sample collection and maintaining patient database: HYJ, KDW, and RHM. Principal investigator of the project: CSH and RHM. All authors have read and approved the final manuscript. Ethics approval and consent to participate
The study was approved in accordance to the requirements of the Ethics Committee at Cheil General Hospital (#CGH-IRB-2011-85). Informed consent for the scientific use of biological material was obtained from all patients in accordance with the requirements of the ethics committees of the institution. Consent for publication
Not applicable. Competing interests
The authors declare that they have no competing interests.
Publisher’s Note
Springer Nature remains neutral with regard to jurisdictional claims in published maps and institutional affiliations.
Author details
1Laboratory of Medical Genetics, Medical Research Institute, Cheil General
Hospital and Women’s Healthcare Center, Seoul, South Korea.2Department
of Obstetrics and Gynecology, Cheil General Hospital and Women’s Healthcare Center, Dankook University College of Medicine, Seoul, South Korea.3Department of Obstetrics & Gynecology, Division of Maternal-Fetal
Medicine, Ewha Womans University, School of Medicine, Seoul, South Korea.
Received: 13 January 2017 Accepted: 1 August 2017
References
1. Mégarbané A, Ravel A, Mircher C, Sturtz F, Grattau Y, Rethoré MO, et al. The 50th anniversary of the discovery of trisomy 21: the past, present, and future of research and treatment of Trisomy 21. Genet Med. 2009;11(9):611–6. (See figure on previous page.)
Fig. 2 Interaction networks of genes that are differentially expressed in T21 placentas and euploid placentas. The list of the identified genes was subjected to STRING (v. 10.0) analysis to reveal functional interactions. Each node represents a protein, and each edge represents an interaction. Thicker lines represent stronger associations. Red letters and blue letters present up-regulated genes and down-regulated genes, respectively, in the fetal placentas with T21. Green circles represent genes that are concurrently up-regulated in the adult brain, fetal brain, and fetal placenta with T21. Blue circles represent genes that were significantly associated with T21 (P < 1.46e-34)
2. Korenberg JR, Kawashima H, Pulst SM, Ikeuchi T, Ogasawara N, Yamamoto K, et al. Molecular definition of a region of chromosome 21 that causes features of the Trisomy 21 phenotype. Am J Hum Genet. 1990;47(2):236–46. 3. Korenberg JR, Chen XN, Schipper R, Sun Z, Gonsky R, Gerwehr S, et al.
Down syndrome phenotypes: the consequences of chromosomal imbalance. Proc Natl Acad Sci U S A. 1994;91(11):4997–5001. 4. Pritchard MA, Kola I. The "gene dosage effect" hypothesis versus the
"amplified developmental instability" hypothesis in down syndrome. J Neural Transm Suppl. 1999;57:293–303.
5. Lyle R, Béna F, Gagos S, Gehrig C, Lopez G, Schinzel A, et al. Genotype-phenotype correlations in down syndrome identified by array CGH in 30 cases of partial trisomy and partial monosomy chromosome 21. Eur J Hum Genet. 2009;17(4):454–66.
6. Li CM, Guo M, Salas M, Schupf N, Silverman W, Zigman WB, et al. Cell type-specific over-expression of chromosome 21 genes in fibroblasts and fetal hearts with trisomy 21. BMC Med Genet. 2006;7:24.
7. Tang Y, Schapiro MB, Franz DN, Patterson BJ, Hickey FJ, Schorry EK, et al. Blood expression profiles for tuberous sclerosis complex 2, neurofibromatosis type 1, and Down's syndrome. Ann Neurol. 2004;56(6):808–14.
8. Giannone S, Strippoli P, Vitale L, Casadei R, Canaider S, Lenzi L, et al. Gene expression profile analysis in human T lymphocytes from patients with Trisomy 21. Ann Hum Genet. 2004;68(Pt 6):546–54.
9. Mao R, Zielke CL, Zielke HR, Pevsner J. Global up-regulation of chromosome 21 gene expression in the developing Trisomy 21 brain. Genomics. 2003; 81(5):457–67.
10. Mao R, Wang X, Spitznagel EL Jr, Frelin LP, Ting JC, Ding H, et al. Primary and secondary transcriptional effects in the developing human Trisomy 21 brain and heart. Genome Biol. 2005;6:R107.
11. Lim JH, Kim SY, Han JY, Kim MY, Park SY, Ryu HM. Comprehensive investigation of DNA methylation and gene expression in trisomy 21 placenta. Placenta. 2016;42:17–24.
12. Letourneau A, Santoni FA, Bonilla X, Sailani MR, Gonzalez D, Kind J, et al. Domains of genome-wide gene expression dysregulation in Down’s syndrome. Nature. 2014;508(7496):345–50.
13. Epstein CJ. The consequences of chromosome imbalance. Am J Med Genet Suppl. 1990;7:31–7.
14. Epstein CJ. Mechanisms of the effects of aneuploidy in mammals. Annu Rev Genet. 1988;22:51–75.
15. FitzPatrick DR. Transcriptional consequences of autosomal trisomy: primary gene dosage with complex downstream effects. Trends Genet. 2005;21(5): 249–53.
16. Benjamini Y, Hochberg Y. Controlling the false discovery rate: a practical and powerful approach to multiple testing. J R Statist Soc B. 1995;57(1):289–300. 17. Lockstone HE, Harris LW, Swatton JE, Wayland MT, Holland AJ, Bahn S. Gene
expression profiling in the adult down syndrome brain. Genomics. 2007; 90(6):647–60.
18. Cremona O, Nimmakayalu M, Haffner C, Bray-Ward P, Ward DC, De Camilli P. Assignment of SYNJ1 to human chromosome 21q22.2 and Synj12 to the murine homologous region on chromosome 16C3-4 by in situ hybridization. Cytogenet Cell Genet. 2000;88(1–2):89–90.
19. McPherson PS, Takei K, Schmid SL, De Camilli P. p145, a major Grb2-binding protein in brain, is co-localized with dynamin in nerve terminals where it undergoes activity-dependent dephosphorylation. J Biol Chem. 1994; 269(48):30132–9.
20. Cremona O, Di Paolo G, Wenk MR, Luthi A, Kim WT, Takei K, et al. Essential role of phosphoinositide metabolism in synaptic vesicle recycling. Cell. 1999;99(2):179–88.
21. Cossec JC, Lavaur J, Berman DE, Rivals I, Hoischen A, Stora S, et al. Trisomy for synaptojanin1 in down syndrome is functionally linked to the enlargement of early endosomes. Hum Mol Genet. 2012;21(14):3156–72. 22. Cheon MS, Kim SH, Ovod V, Kopitar Jerala N, Morgan JI, Hatefi Y, et al.
Protein levels of genes encoded on chromosome 21 in fetal down syndrome brain: challenging the gene dosage effect hypothesis (part III). Amino Acids. 2003;24(1–2):127–34.
23. Arai Y, Ijuin T, Takenawa T, Becker LE, Takashima S. Excessive expression of synaptojanin in brains with down syndrome. Brain and Development. 2002; 24(2):67–72.
24. Patterson D, Costa AC. Down syndrome and genetics - a case of linked histories. Nat Rev Genet. 2005;6(2):137–47.
25. McIntire LB, Berman DE, Myaeng J, Staniszewski A, Arancio O, Di Paolo G, et al. Reduction of synaptojanin 1 ameliorates synaptic and behavioral
impairments in a mouse model of Alzheimer's disease. J Neurosci. 2012; 32(44):15271–6.
26. Zhu L, Zhong M, Zhao J, Rhee H, Caesar I, Knight EM, et al. Reduction of synaptojanin 1 accelerates Aβ clearance and attenuates cognitive deterioration in an Alzheimer mouse model. J Biol Chem. 2013;288(44): 32050–63.
27. Busciglio J, Pelsman A, Wong C, Pigino G, Yuan M, Mori H, et al. Altered metabolism of the amyloid beta precursor protein is associated with mitochondrial dysfunction in Down's syndrome. Neuron. 2002;33(5):677–88.
• We accept pre-submission inquiries
• Our selector tool helps you to find the most relevant journal
• We provide round the clock customer support
• Convenient online submission
• Thorough peer review
• Inclusion in PubMed and all major indexing services
• Maximum visibility for your research Submit your manuscript at
www.biomedcentral.com/submit