RESEARCH ARTICLE
Epidemiology of fall and its socioeconomic
risk factors in community-dwelling Korean
elderly
Taekyoung Kim1, Sang D. Choi2, Shuping XiongID1*
1 Department of Industrial and Systems Engineering, Korea Advanced Institute of Science and Technology (KAIST), Yuseong-gu, Daejoen, Republic of Korea, 2 Department of Occupational and Environmental Safety and Health, University of Wisconsin, Whitewater, Wisconsin, United States of America
Abstract
Although falls in older people are a major public health problem globally, to date there are scarce reports on socioeconomic risk factors for falls. The aim of the present study was to investigate the epidemiology of fall, its associated socioeconomic risk factors and relative importance among community-dwelling Korean elderly. Secondary analysis of national sur-vey data with 31,684 community-dwelling Korean elderly was performed. Eleven socioeco-nomic factors (age, gender, household type, marital status, education level, current occupation, past occupation, income, wealth, number of children, and relationship satisfac-tion) were selected for analysing their associations with the epidemiology of fall through complex sample analysis and logistic regressions. Results showed that 15.9%~25.1% of community-dwelling Korean elderly experienced fall yearly. The groups with significantly higher fall risks were identified as older aged, being female, not married or widowed, less educated, unemployed, and having lower relationship satisfaction. Gender (adjusted odds ratio-AOR = 1.548) and relationship satisfaction (AOR = 1.276) were the utmost important fall risk factors, indicating being older female with lower relationship satisfaction were the foremost socioeconomic characteristics for risk of falling. These findings could contribute to better understanding of the socioeconomic fall risk profiles among Korean elderly and effec-tive strategies for fall prevention.
Introduction
Falls among the elderly are a major public health problem. Around one third of older adults aged 65 or over experience at least one fall each year [1,2]. Falls have been reported as a leading cause of fatal death and nonfatal injury in older people [3–5]. Several studies have investigated fall risk factors in community-dwelling older people. Age, gender, historical falls, physical or cognitive impairments, medication, and environmental hazards have been reported as signifi-cant risk factors for falls [2,6–10]. Those fall risk factors were widely utilized for not only fall risk assessment, but also management of the risks of falling in the older people [11].
a1111111111 a1111111111 a1111111111 a1111111111 a1111111111 OPEN ACCESS
Citation: Kim T, Choi SD, Xiong S (2020) Epidemiology of fall and its socioeconomic risk factors in community-dwelling Korean elderly. PLoS ONE 15(6): e0234787.https://doi.org/ 10.1371/journal.pone.0234787
Editor: Kyoung-Sae Na, Gachon University Gil Medical Center, REPUBLIC OF KOREA Received: October 22, 2019 Accepted: June 2, 2020 Published: June 19, 2020
Copyright:© 2020 Kim et al. This is an open access article distributed under the terms of the Creative Commons Attribution License, which permits unrestricted use, distribution, and reproduction in any medium, provided the original author and source are credited.
Data Availability Statement: The datasets analysed during the current study are available in the Health and Welfare Data Portal repository of Korea Institute for Health and Social Affairs:https:// data.kihasa.re.kr/microdata/apply/list.
Funding: This work was funded by Basic Science Research Program through the National Research Foundation of Korea (Grant No.
2017R1C1B2006811) and High Risk High Return Project of KAIST (Grant No. N10180020) to Dr. Shuping Xiong. The funders had no role in study
Socioeconomic status of the elderly is the social standing of an individual, which is typically measured by several indicators such as education, occupation, income and wealth. Higher socioeconomic status tends to be positively associated with better well-being and lower nutri-tional risk [12–15], therefore, older individuals with lower socioeconomic status may have higher fall risks. Nevertheless, very few studies have investigated the association between the elderly’s fall risk and socioeconomic factors, especially for Korean population.
South Korea is facing a rapid population aging [16] and a few studies on elderly fall risk tors applied cross-sectional designs that provide a snapshot of the fall prevalence and risk fac-tors in a single moment of time [17–21]. For example, we conducted a preliminary cross-sectional study at a single moment of time based on 2014 Korean national survey data with 10,451 older individuals [21]. Our earlier results showed that nine out of ten socioeconomic factors were significant for the risk of falls. Although these studies provide valuable insights on association between the risk factors and fall incidents, they typically suffer from selection bias, confounding and cannot identify periodic changes. To overcome the limitations of a single moment cross-sectional study, the use of research designs that provide data at several time points from independent samples of the population (hereafter referred to as “multi-period cross-sectional study”) is increasingly being advocated in the literature [22,23]. A multi-period cross-sectional study can investigate not only association robustly, but also periodic effects.
To date, few studies have been conducted with multi-period cross-sectional designs because the practical application of these multi-period designs is generally considered more complex, expensive, and time consuming. The objective of this study is to investigate the epidemiology of fall, its associated socioeconomic risk factors and relative importance among community-dwelling elderly in South Korea, utilizing a large national database from a multi-period cross-sectional research study.
Materials and methods
Description of the data sources
This secondary data analysis used original datasets from 2011 to 2017Korean National Survey on Elderly Living Conditions and Welfare Desire (KNSELCWD) conducted by Korea Institute for Health and Social Affairs (KIHASA). KIHASA is a government institute which studies and
evaluates national policies and programs related to health care, social welfare, social insurance and population [24]. The original survey data is publicly available throughhttps://data.kihasa. re.kr/index.jspso that anyone can access, use or share. The surveys were carried out every 3 years, 2011, 2014, and 2017 respectively, to examine conditions about living, relationships, support, health and activities in community-dwelling Korean older population aged 65 or over. The total sample size during the whole study period was 31,684 elderly individuals: 10,997 for year 2011, 10,451 for year 2014, and 10,236 for year 2017.KNSELCWD collected fall
incidents in the recent one year from each participant.
Sampling
The target population of the investigation by KIHASA was community-dwelling Korean elderly (aged 65 or over) living in 16 metropolitan cities and provinces. The sampled popula-tion was elderly in target populapopula-tion who are residing within areas for sample survey of ‘Popu-lation and Housing Census’. Stratified two-stage cluster sampling was used in collecting data. The primary sampling units were 90% of enumeration districts used in ‘Population and Hous-ing Census’ conducted by Statistics Korea and the secondary samplHous-ing units were households in the enumeration districts.
design, data collection and analysis, decision to publish, or preparation of the manuscript. Competing interests: The authors have declared that no competing interests exist.
There were three steps in computing the required sample size for theKNSELCWD in each
investigation period. Firstly, total sufficient sample size was computed usingEq (1). With 95% of confidence level and 4% of maximum margin, the sufficient sample size in each region was 600, so total sufficient sample size for 16 stratified regions was 9,600. Afterwards, the total suf-ficient sample size was allocated to each region in proportion to square root of the actual elderly population size in each region. Lastly, it was ascertained whether the sample size in each region meets the minimum sample size of 384, which was computed again usingEq (1) with 95% of confidence level and 5% of maximum margin. If the sample size in any region was less than 384, extra elderly individuals in the region were added randomly to meet the mini-mum sample size.
N ¼Za=2
2
pð1 pÞ
e2 ð1Þ
(Zα/2was a confidence coefficient in a confidence level of (1-α) ×100% 100%, e was the
maxi-mum margin of error, and p was population ratio. Because p was an unknown value, this sur-vey assumed p = 0.5 to obtain maximum value of p(1-p)).
Selection of socioeconomic factors
Studies of socioeconomic inequalities in older people should focus on a set of measures rather than a single indicator [15,25,26]. Education level, occupation (current or past), income, and wealth were the most widely used indicators in assessing individual’s socioeconomic status [27–29]. In addition, important socioeconomic factors including age, gender, type of house-hold, marital status, number of children, and relationship satisfaction with the children were also investigated due to their potential associations with the risk of falling [21,30,31]. There-fore, total 11 socioeconomic factors were chosen in this study to investigate their associations with the fall risk.
Statistical analysis
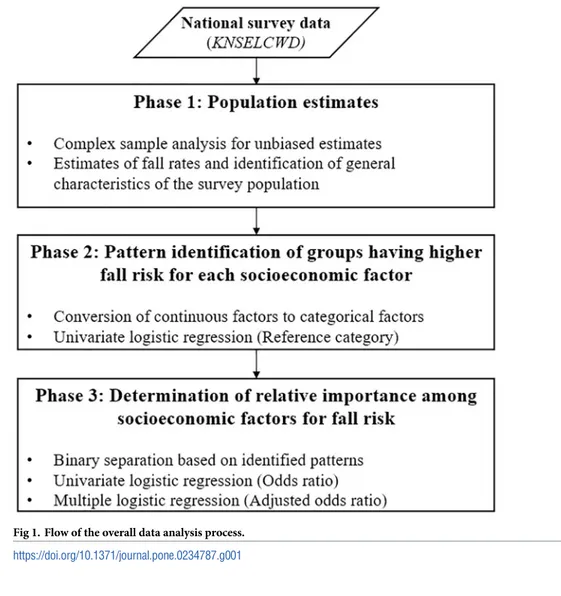
Statistical analysis was conducted in three sequential phases as outlined inFig 1. The first phase was to estimate fall rates and identify general characteristics of the survey population using the complex sample analysis to produce unbiased results [32–34]. The population in each survey year was estimated with weighting and stratifying adjustments. Weights were computed usingEq (2), and stratification was 25 geographic areas consisting of 7 metropolitan cities, and 1 rural area and 1 urban area from each of 9 provinces. In the second phase, patterns about which groups have higher fall risk in each socioeconomic factor were examined using the univariate logistic regression. The continuous factors were converted to categorical factors following the defined categories inKNSELCWD. In the univariate logistic regression, one
cate-gory was set as a reference, and regression coefficients provided the association with the refer-ence category [35]. The odds ratio (OR) greater than 1 indicated that the categories have higher fall risk than the reference category, while OR less than 1 indicated lower fall risk. The last phase was to find out the relative importance among socioeconomic factors using OR and adjusted odds ratio (AOR) of falls. In this phase, all socioeconomic factors were binarily sepa-rated into two levels [36], in order to calculate OR and AOR from univariate logistic regression and multiple logistic regression, respectively. Multiple logistic regression was conducted in this study to produce AOR for all socioeconomic factors, which controls the confounding fac-tors so that unbiased relative importance in each factor can be investigated [37]. IBM SPSS Sta-tistics 20 (IBM Corporation, New York, United States) was used for statistical analysis at a
significance level of 0.05. Weight ¼ Sh nhShi �Mhi mhi � � �Ahij ahij �wps ð2Þ
(Sh: total number of households in strata h, nh: the number of enumeration districts in the
strata h, Shi: the total number of households in the ith enumeration district of the strata h, Mhi:
the number of households in the ith enumeration district of the strata h, mhi: the number of
investigated households in the ith enumeration district of the strata h, Ahij: the number of the
elderly in the jth household in the ith enumeration district of the strata h, ahij: the number of
the investigated elderly in the jth household in the ith enumeration district of the strata h,wps:
the post-stratification weight, adjusted by Raking ratio method).
Results
Epidemiology of fall and general characteristics of the survey population
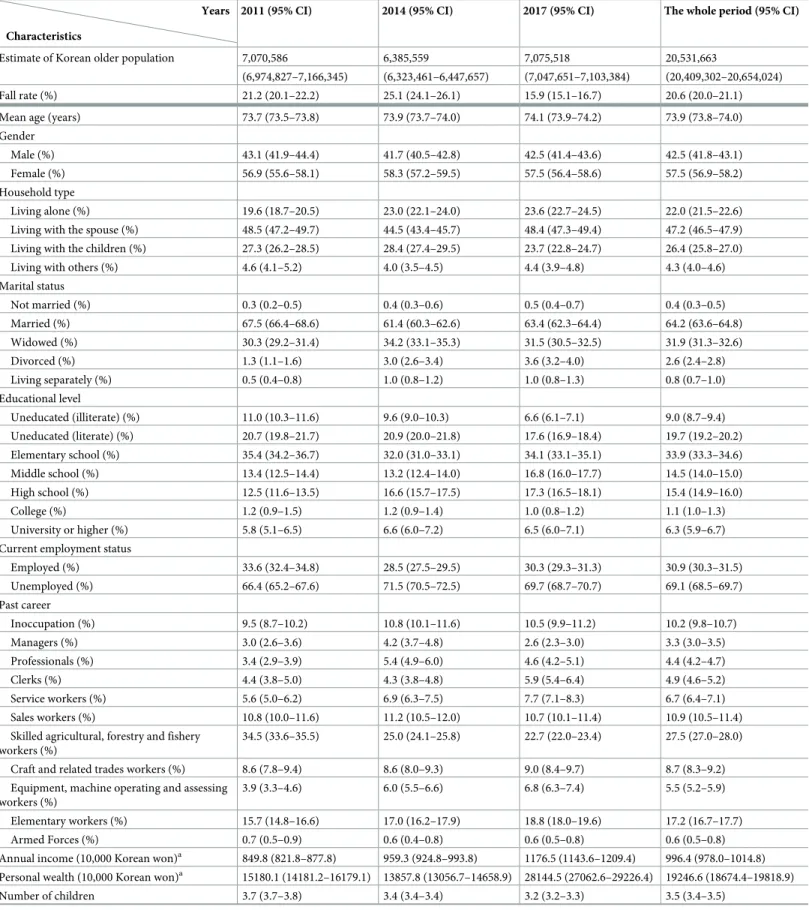
Table 1presents the fall rates and general characteristics of the survey population, segmented by survey year. The estimated fall rates in community-dwelling Korean elderly were 21.2%
Fig 1. Flow of the overall data analysis process. https://doi.org/10.1371/journal.pone.0234787.g001
Table 1. Fall rates and general characteristics of the survey population, segmented by survey year.
Characteristics
Years 2011 (95% CI) 2014 (95% CI) 2017 (95% CI) The whole period (95% CI)
Estimate of Korean older population 7,070,586 6,385,559 7,075,518 20,531,663
(6,974,827–7,166,345) (6,323,461–6,447,657) (7,047,651–7,103,384) (20,409,302–20,654,024)
Fall rate (%) 21.2 (20.1–22.2) 25.1 (24.1–26.1) 15.9 (15.1–16.7) 20.6 (20.0–21.1)
Mean age (years) 73.7 (73.5–73.8) 73.9 (73.7–74.0) 74.1 (73.9–74.2) 73.9 (73.8–74.0)
Gender
Male (%) 43.1 (41.9–44.4) 41.7 (40.5–42.8) 42.5 (41.4–43.6) 42.5 (41.8–43.1)
Female (%) 56.9 (55.6–58.1) 58.3 (57.2–59.5) 57.5 (56.4–58.6) 57.5 (56.9–58.2)
Household type
Living alone (%) 19.6 (18.7–20.5) 23.0 (22.1–24.0) 23.6 (22.7–24.5) 22.0 (21.5–22.6)
Living with the spouse (%) 48.5 (47.2–49.7) 44.5 (43.4–45.7) 48.4 (47.3–49.4) 47.2 (46.5–47.9)
Living with the children (%) 27.3 (26.2–28.5) 28.4 (27.4–29.5) 23.7 (22.8–24.7) 26.4 (25.8–27.0)
Living with others (%) 4.6 (4.1–5.2) 4.0 (3.5–4.5) 4.4 (3.9–4.8) 4.3 (4.0–4.6)
Marital status Not married (%) 0.3 (0.2–0.5) 0.4 (0.3–0.6) 0.5 (0.4–0.7) 0.4 (0.3–0.5) Married (%) 67.5 (66.4–68.6) 61.4 (60.3–62.6) 63.4 (62.3–64.4) 64.2 (63.6–64.8) Widowed (%) 30.3 (29.2–31.4) 34.2 (33.1–35.3) 31.5 (30.5–32.5) 31.9 (31.3–32.6) Divorced (%) 1.3 (1.1–1.6) 3.0 (2.6–3.4) 3.6 (3.2–4.0) 2.6 (2.4–2.8) Living separately (%) 0.5 (0.4–0.8) 1.0 (0.8–1.2) 1.0 (0.8–1.3) 0.8 (0.7–1.0) Educational level Uneducated (illiterate) (%) 11.0 (10.3–11.6) 9.6 (9.0–10.3) 6.6 (6.1–7.1) 9.0 (8.7–9.4) Uneducated (literate) (%) 20.7 (19.8–21.7) 20.9 (20.0–21.8) 17.6 (16.9–18.4) 19.7 (19.2–20.2) Elementary school (%) 35.4 (34.2–36.7) 32.0 (31.0–33.1) 34.1 (33.1–35.1) 33.9 (33.3–34.6) Middle school (%) 13.4 (12.5–14.4) 13.2 (12.4–14.0) 16.8 (16.0–17.7) 14.5 (14.0–15.0) High school (%) 12.5 (11.6–13.5) 16.6 (15.7–17.5) 17.3 (16.5–18.1) 15.4 (14.9–16.0) College (%) 1.2 (0.9–1.5) 1.2 (0.9–1.4) 1.0 (0.8–1.2) 1.1 (1.0–1.3) University or higher (%) 5.8 (5.1–6.5) 6.6 (6.0–7.2) 6.5 (6.0–7.1) 6.3 (5.9–6.7)
Current employment status
Employed (%) 33.6 (32.4–34.8) 28.5 (27.5–29.5) 30.3 (29.3–31.3) 30.9 (30.3–31.5) Unemployed (%) 66.4 (65.2–67.6) 71.5 (70.5–72.5) 69.7 (68.7–70.7) 69.1 (68.5–69.7) Past career Inoccupation (%) 9.5 (8.7–10.2) 10.8 (10.1–11.6) 10.5 (9.9–11.2) 10.2 (9.8–10.7) Managers (%) 3.0 (2.6–3.6) 4.2 (3.7–4.8) 2.6 (2.3–3.0) 3.3 (3.0–3.5) Professionals (%) 3.4 (2.9–3.9) 5.4 (4.9–6.0) 4.6 (4.2–5.1) 4.4 (4.2–4.7) Clerks (%) 4.4 (3.8–5.0) 4.3 (3.8–4.8) 5.9 (5.4–6.4) 4.9 (4.6–5.2) Service workers (%) 5.6 (5.0–6.2) 6.9 (6.3–7.5) 7.7 (7.1–8.3) 6.7 (6.4–7.1) Sales workers (%) 10.8 (10.0–11.6) 11.2 (10.5–12.0) 10.7 (10.1–11.4) 10.9 (10.5–11.4)
Skilled agricultural, forestry and fishery workers (%)
34.5 (33.6–35.5) 25.0 (24.1–25.8) 22.7 (22.0–23.4) 27.5 (27.0–28.0)
Craft and related trades workers (%) 8.6 (7.8–9.4) 8.6 (8.0–9.3) 9.0 (8.4–9.7) 8.7 (8.3–9.2)
Equipment, machine operating and assessing workers (%)
3.9 (3.3–4.6) 6.0 (5.5–6.6) 6.8 (6.3–7.4) 5.5 (5.2–5.9)
Elementary workers (%) 15.7 (14.8–16.6) 17.0 (16.2–17.9) 18.8 (18.0–19.6) 17.2 (16.7–17.7)
Armed Forces (%) 0.7 (0.5–0.9) 0.6 (0.4–0.8) 0.6 (0.5–0.8) 0.6 (0.5–0.8)
Annual income (10,000 Korean won)a 849.8 (821.8–877.8) 959.3 (924.8–993.8) 1176.5 (1143.6–1209.4) 996.4 (978.0–1014.8) Personal wealth (10,000 Korean won)a 15180.1 (14181.2–16179.1) 13857.8 (13056.7–14658.9) 28144.5 (27062.6–29226.4) 19246.6 (18674.4–19818.9)
Number of children 3.7 (3.7–3.8) 3.4 (3.4–3.4) 3.2 (3.2–3.3) 3.5 (3.4–3.5)
(95% CI: 20.1–22.2%), 25.1% (95% CI: 24.1–26.1%), and 15.9% (95% CI: 15.1–16.7%) in 2011, 2014, and 2017, respectively. The mean age of Korean elderly was 73.9 years (95% CI: 73.8– 74.0) in the whole period, 57.5% were female (95% CI: 56.9–58.2%).
Major socioeconomic factors related to fall risk in community-dwelling
Korean elderly
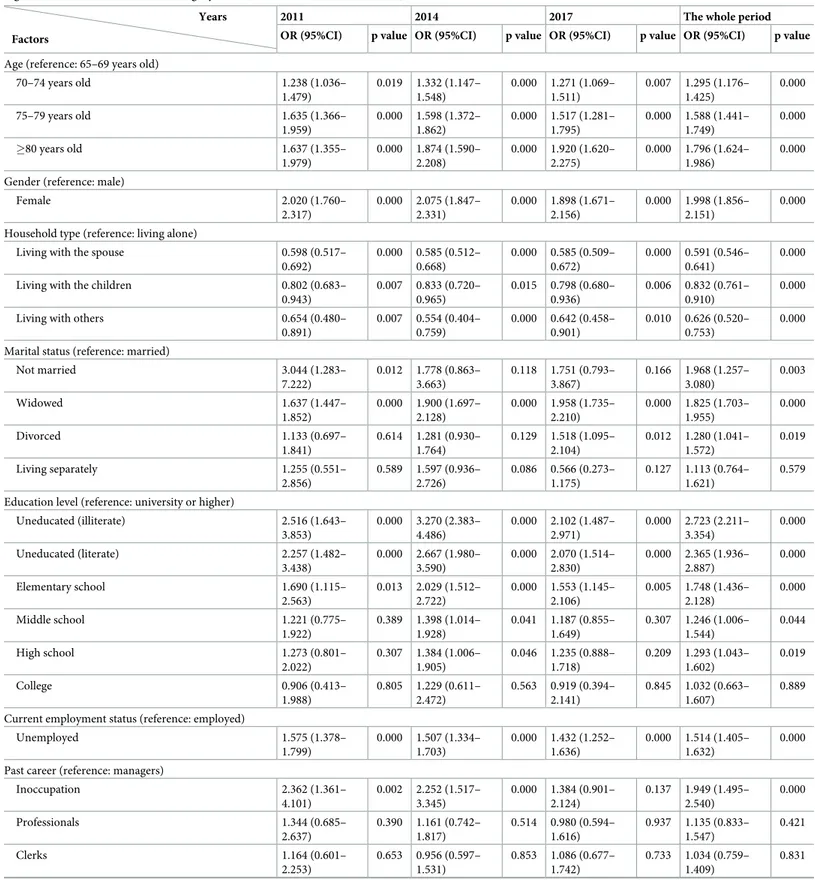
Patterns of socioeconomic factors associated with higher fall risk. The univariate
logis-tic regression was used to discover patterns of higher fall risk groups by each socioeconomic factor (Table 2). Groups with higher risk of falling were identified as older aged, being female, living alone, not married or widowed, less educated, unemployed, having had blue-collar jobs, with lower income and wealth, having lower relationship satisfaction, and having more children.
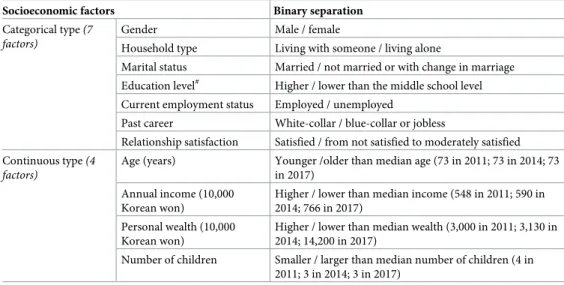
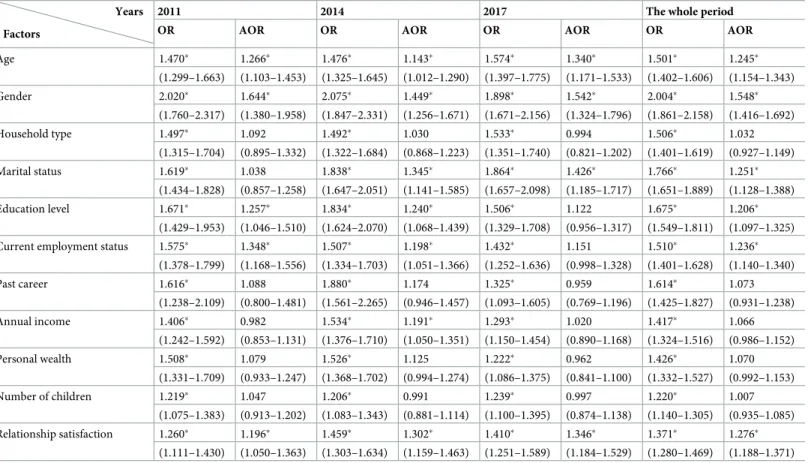
Relative importance of socioeconomic factors for elderly fall risks. Table 3summarizes the criteria used to generate binary groups based on each socioeconomic factor andTable 4 further shows the odds ratio (OR) and adjusted odds ratio (AOR) of falls for each socioeco-nomic factor based on the binary separation. All 11 socioecosocioeco-nomic factors showed statistical significance for fall risks from the univariate logistic regression analysis in the whole period, especially for gender (OR = 2.004), marital status (OR = 1.766), education level (OR = 1.675) and past career (OR = 1.614). However, after adjusting for potentially confounding effects from other socioeconomic factors by multiple logistic regression, 5 factors (‘household type’, ‘past career’, ‘income’, ‘wealth’, and ‘number of children’) became statistically insignificant for fall risks. ‘Gender’ still recorded the highest importance (AOR = 1.548) in the whole period, followed by ‘relationship satisfaction’ (AOR = 1.276), ‘marital status’ (AOR = 1.251), ‘age’ (AOR = 1.245), ‘current employment status’ (AOR = 1.236) and ‘education level’
(AOR = 1.206).
Discussion
The estimated fall rate increased by 3.9% from 2011 to 2014, but subsequently drastically dropped by 9.2% from 2014 to 2017. It seemed worthy of a further investigation to discover potential reasons for this sudden drop of fall rate in 2017. To begin with, we examined the par-ticipants’ physical conditions including subjective health condition fromKNSELCWD (2011,
2014, & 2017) and determined that physical functionality and subjective health condition did not have any significant differences over the study period. Yet,KNSELCWD examined the
impaired level of cognitive functionality of the Korean elderly people using a Korean version
Table 1. (Continued)
Characteristics
Years 2011 (95% CI) 2014 (95% CI) 2017 (95% CI) The whole period (95% CI)
Relationship satisfaction Very satisfied (%) 4.3 (3.8–4.9) 2.0 (1.7–2.4) 1.6 (1.4–2.0) 2.7 (2.4–2.9) Satisfied (%) 56.9 (55.6–58.1) 40.7 (39.5–41.8) 47.0 (45.9–48.0) 48.4 (47.7–49.1) Moderate (%) 31.8 (30.6–33.0) 47.0 (45.8–48.2) 42.8 (41.8–43.9) 40.4 (39.7–41.0) Rarely satisfied (%) 6.2 (5.7–6.9) 9.5 (8.8–10.3) 8.0 (7.4–8.6) 7.9 (7.5–8.2) Not satisfied (%) 0.8 (0.6–1.0) 0.8 (0.6–1.0) 0.6 (0.5–0.8) 0.7 (0.6–0.8)
a1USD � 1200 Korean won
Table 2. Results of the univariate logistic regression for identifying higher fall risk groups associated with the 11 selected socioeconomic factors (OR > 1 indicates higher fall risk than the reference category while OR < 1 indicates lower fall risk).
Factors
Years 2011 2014 2017 The whole period
OR (95%CI) p value OR (95%CI) p value OR (95%CI) p value OR (95%CI) p value Age (reference: 65–69 years old)
70–74 years old 1.238 (1.036– 1.479) 0.019 1.332 (1.147– 1.548) 0.000 1.271 (1.069– 1.511) 0.007 1.295 (1.176– 1.425) 0.000 75–79 years old 1.635 (1.366– 1.959) 0.000 1.598 (1.372– 1.862) 0.000 1.517 (1.281– 1.795) 0.000 1.588 (1.441– 1.749) 0.000 �80 years old 1.637 (1.355– 1.979) 0.000 1.874 (1.590– 2.208) 0.000 1.920 (1.620– 2.275) 0.000 1.796 (1.624– 1.986) 0.000 Gender (reference: male)
Female 2.020 (1.760– 2.317) 0.000 2.075 (1.847– 2.331) 0.000 1.898 (1.671– 2.156) 0.000 1.998 (1.856– 2.151) 0.000 Household type (reference: living alone)
Living with the spouse 0.598 (0.517–
0.692) 0.000 0.585 (0.512– 0.668) 0.000 0.585 (0.509– 0.672) 0.000 0.591 (0.546– 0.641) 0.000
Living with the children 0.802 (0.683–
0.943) 0.007 0.833 (0.720– 0.965) 0.015 0.798 (0.680– 0.936) 0.006 0.832 (0.761– 0.910) 0.000
Living with others 0.654 (0.480–
0.891) 0.007 0.554 (0.404– 0.759) 0.000 0.642 (0.458– 0.901) 0.010 0.626 (0.520– 0.753) 0.000 Marital status (reference: married)
Not married 3.044 (1.283– 7.222) 0.012 1.778 (0.863– 3.663) 0.118 1.751 (0.793– 3.867) 0.166 1.968 (1.257– 3.080) 0.003 Widowed 1.637 (1.447– 1.852) 0.000 1.900 (1.697– 2.128) 0.000 1.958 (1.735– 2.210) 0.000 1.825 (1.703– 1.955) 0.000 Divorced 1.133 (0.697– 1.841) 0.614 1.281 (0.930– 1.764) 0.129 1.518 (1.095– 2.104) 0.012 1.280 (1.041– 1.572) 0.019 Living separately 1.255 (0.551– 2.856) 0.589 1.597 (0.936– 2.726) 0.086 0.566 (0.273– 1.175) 0.127 1.113 (0.764– 1.621) 0.579 Education level (reference: university or higher)
Uneducated (illiterate) 2.516 (1.643– 3.853) 0.000 3.270 (2.383– 4.486) 0.000 2.102 (1.487– 2.971) 0.000 2.723 (2.211– 3.354) 0.000 Uneducated (literate) 2.257 (1.482– 3.438) 0.000 2.667 (1.980– 3.590) 0.000 2.070 (1.514– 2.830) 0.000 2.365 (1.936– 2.887) 0.000 Elementary school 1.690 (1.115– 2.563) 0.013 2.029 (1.512– 2.722) 0.000 1.553 (1.145– 2.106) 0.005 1.748 (1.436– 2.128) 0.000 Middle school 1.221 (0.775– 1.922) 0.389 1.398 (1.014– 1.928) 0.041 1.187 (0.855– 1.649) 0.307 1.246 (1.006– 1.544) 0.044 High school 1.273 (0.801– 2.022) 0.307 1.384 (1.006– 1.905) 0.046 1.235 (0.888– 1.718) 0.209 1.293 (1.043– 1.602) 0.019 College 0.906 (0.413– 1.988) 0.805 1.229 (0.611– 2.472) 0.563 0.919 (0.394– 2.141) 0.845 1.032 (0.663– 1.607) 0.889 Current employment status (reference: employed)
Unemployed 1.575 (1.378– 1.799) 0.000 1.507 (1.334– 1.703) 0.000 1.432 (1.252– 1.636) 0.000 1.514 (1.405– 1.632) 0.000 Past career (reference: managers)
Inoccupation 2.362 (1.361– 4.101) 0.002 2.252 (1.517– 3.345) 0.000 1.384 (0.901– 2.124) 0.137 1.949 (1.495– 2.540) 0.000 Professionals 1.344 (0.685– 2.637) 0.390 1.161 (0.742– 1.817) 0.514 0.980 (0.594– 1.616) 0.937 1.135 (0.833– 1.547) 0.421 Clerks 1.164 (0.601– 2.253) 0.653 0.956 (0.597– 1.531) 0.853 1.086 (0.677– 1.742) 0.733 1.034 (0.759– 1.409) 0.831 (Continued )
of mini mental state examination. Results showed that the estimated proportions of the elderly having low cognitive function were 20.5% (95% CI: 19.5–21.6%), 25.1% (95% CI: 24.2–26.1%) in 2011, 2014, and unexpectedly dropped to 15.1% (95% CI: 14.3–15.8%) in 2017, which closely follows a similar trend to that of the fall rates. Previous literature documented that low cognitive function is one of the major fall risk factors in the elderly people since cognitive impairment can delay the sensory integration and the selection/execution of proper corrective responses to prevent falls, especially for the critical situations such as slips, trips and missteps [17,38–40]. Moreover, as a response to rapidly growing the Korean elderly population, in 2015
Table 2. (Continued)
Factors
Years 2011 2014 2017 The whole period
OR (95%CI) p value OR (95%CI) p value OR (95%CI) p value OR (95%CI) p value
Service workers 2.055 (1.158– 3.646) 0.014 2.156 (1.435– 3.238) 0.000 1.386 (0.892– 2.155) 0.147 1.782 (1.356– 2.341) 0.000 Sales workers 1.772 (1.021– 3.073) 0.042 1.970 (1.328– 2.921) 0.001 1.580 (1.032– 2.419) 0.035 1.740 (1.336– 2.265) 0.000 Skilled agricultural, forestry and fishery workers 1.981 (1.173–
3.347) 0.011 2.132 (1.472– 3.088) 0.000 1.438 (0.961– 2.150) 0.077 1.820 (1.418– 2.337) 0.000
Craft and related trades workers 1.391 (0.782–
2.472) 0.261 1.248 (0.824– 1.892) 0.296 0.880 (0.557– 1.390) 0.583 1.139 (0.861– 1.506) 0.361 Equipment, machine operation and assembling
workers 1.307 (0.629– 2.715) 0.474 1.310 (0.843– 2.037) 0.230 0.940 (0.589– 1.501) 0.797 1.138 (0.836– 1.549) 0.412 Elementary workers 1.959 (1.144– 3.356) 0.014 2.205 (1.507– 3.228) 0.000 1.564 (1.039– 2.354) 0.032 1.845 (1.428– 2.383) 0.000 Armed Forces 0.914 (0.345– 2.425) 0.857 0.898 (0.349– 2.306) 0.822 1.156 (0.481– 2.776) 0.746 0.959 (0.561– 1.640) 0.877 Annual income#(reference: high income)
Middle income 1.792 (1.503– 2.135) 0.000 1.892 (1.631– 2.194) 0.000 1.585 (1.354– 1.855) 0.000 1.758 (1.601– 1.929) 0.000 Low income 1.838 (1.509– 2.237) 0.000 1.990 (1.685– 2.350) 0.000 1.483 (1.238– 1.777) 0.000 1.774 (1.597– 1.970) 0.000 Personal wealth#(reference: high wealth)
Middle wealth 1.420 (1.191– 1.694) 0.000 1.410 (1.221– 1.628) 0.000 1.196 (1.019– 1.404) 0.028 1.340 (1.222– 1.470) 0.000 Low wealth 1.999 (1.652– 2.421) 0.000 1.743 (1.490– 2.039) 0.000 1.451 (1.218– 1.728) 0.000 1.733 (1.568– 1.917) 0.000 Number of children#(reference: small size)
Middle size 1.089 (0.952– 1.246) 0.214 1.163 (1.017– 1.330) 0.027 0.953 (0.829– 1.095) 0.496 1.073 (0.992– 1.161) 0.079 Large size 1.360 (1.142– 1.620) 0.001 1.305 (1.119– 1.522) 0.001 1.377 (1.167– 1.626) 0.000 1.364 (1.242– 1.499) 0.000 Relationship satisfaction§(reference: satisfied)
Moderate 1.197 (1.045– 1.372) 0.010 1.327 (1.180– 1.439) 0.000 1.298 (1.145– 1.472) 0.000 1.272 (1.184– 1.367) 0.000 Not satisfied 1.566 (1.248– 1.964) 0.000 2.159 (1.796– 2.596) 0.000 2.019 (1.653– 2.466) 0.000 1.931 (1.721– 2.167) 0.000
#Continuous factors were categorized into 3 groups based on quartiles (Low/small: less than the first quartile Q1; High/large: larger than the third quartile Q3; Middle: in between Q1 and Q3).
§Due to too limited samples in two extreme categories (very satisfied and not satisfied) in relationship satisfaction, original five categories were regrouped into three categories to increase the sample size in each category for robust comparisons. ‘very satisfied’ and ‘satisfied’ were combined to a new category of ‘satisfied’, ‘rarely satisfied’ and ‘not satisfied’ were combined to ‘not satisfied’, while the original category of ‘moderate’ was kept unchanged.
Korean government announced key policies for the revitalization of the health welfare associ-ated with the elderly’s loneliness, deterioration in health, poverty, depression, dementia, and cognitive impairment [41]. We suspect that Korean government’s policies for the revitalization of the elderly’s health welfare initiatives might contribute to the reduction of proportion of elderly with cognitive impairment, and thus concurrently affected to the substantial decrease of fall rates in 2017 [16].
The identified higher fall risk groups in regard to socioeconomic factors included older aged, being female, living alone, not married, less educated, unemployed, having had blue-col-lar career, with lower income and wealth, with lower relationship satisfaction, and having more children. This is consistent with the findings from our earlier single-moment cross-sec-tional study [21] except on the number of children (seeTable 2). Previous literature reported that aging is a widely known fall risk factor [42–44] and older women are more prone to falling and injury than men [42,44–46]. This study also found that socioeconomic conditions of less education and lower income/wealth were associated with higher risk of falling. Low education level has been reported as an important indicator of cognitive impairment in older people [47] and highly educated elderly are more aware of the risk associated with falling and they can access education or other strategies to protect against fall risk [48]. In addition, older people with low income and wealth were at high risk of falling. This result is expected since the elderly in poverty are exposed to more environmental hazards and have lower accessibility to health care services, which induce greater risk of chronical diseases, limitation on physical condition and increased fall risks [3,29,46]. Importantly, our study found that ‘marital status’ and ‘rela-tionship satisfaction with the children’ were the main socioeconomic factors for the risk of fall-ing. Those two factors are associated with social support from the family and life satisfaction, older people having good relationship with the family and high life satisfaction tend to suffer less from isolation, depression and risk of falling [3,49]. Earlier studies also showed that ‘mari-tal status’ was associated with falls [44,48] and widowed/separated/divorced people did not have benefits about healthy behaviors such as good diet and physical activity [42]. Moreover, employed older people tend to have lower fall risks than unemployed older people. Generally, elderly who employed are considered to have sufficient capability to perform daily activities,
Table 3. Binary separation of the socioeconomic factors to examine relative importance for fall risks.
Socioeconomic factors Binary separation
Categorical type(7 factors)
Gender Male / female
Household type Living with someone / living alone
Marital status Married / not married or with change in marriage Education level# Higher / lower than the middle school level Current employment status Employed / unemployed
Past career White-collar / blue-collar or jobless
Relationship satisfaction Satisfied / from not satisfied to moderately satisfied Continuous type(4
factors)
Age (years) Younger /older than median age (73 in 2011; 73 in 2014; 73 in 2017)
Annual income (10,000 Korean won)
Higher / lower than median income (548 in 2011; 590 in 2014; 766 in 2017)
Personal wealth (10,000 Korean won)
Higher / lower than median wealth (3,000 in 2011; 3,130 in 2014; 14,200 in 2017)
Number of children Smaller / larger than median number of children (4 in 2011; 3 in 2014; 3 in 2017)
#
Compulsory education in South Korea is until year 9 (middle school). https://doi.org/10.1371/journal.pone.0234787.t003
and they have higher life satisfaction [50]. In addition, employed older people have more opportunities to interact with other people [51], the social interactions can help avoid social isolation and depression, thus reduce the risk of falling.
After identifying significant socioeconomic factors for elderly fall risks [21], it is important to further check their relative importance so that the measures/policies for fall prevention can be prioritized accordingly. In the present study, there are considerable differences between results of OR and AOR for relative importance of socioeconomic factors (Table 4). In the whole period, all the socioeconomic factors were significant in terms of OR, but AOR of ‘household type’, ‘past career’, ‘number of children’ ‘income’, and ‘wealth’ became insignificant after removing confounders. To gain insights for this phenomenon, multivariate logistic regression analyses were conducted to check the confounding effects among socioeconomic factors. Results showed that ‘past career’ was highly affected by education level and gender. In general, highly educated people had white-collar career while lowly educated people had blue-collar career in past Korea. Also males had higher chance to get jobs while females concen-trated on housework. Household type was dominantly associated with marital status. Married people typically lived with their spouse, and unmarried/divorced/widowed people generally lived alone. The number of children was influenced by age and education level. Traditionally, Korean formed large family because they need hands for helping the manual labour such as farming, but the trend changed due to the rapid industrialization and economic take off in
Table 4. Relative importance of socioeconomic factors for elderly fall risks.
Factors
Years 2011 2014 2017 The whole period
OR AOR OR AOR OR AOR OR AOR
Age 1.470� 1.266� 1.476� 1.143� 1.574� 1.340� 1.501� 1.245� (1.299–1.663) (1.103–1.453) (1.325–1.645) (1.012–1.290) (1.397–1.775) (1.171–1.533) (1.402–1.606) (1.154–1.343) Gender 2.020� 1.644� 2.075� 1.449� 1.898� 1.542� 2.004� 1.548� (1.760–2.317) (1.380–1.958) (1.847–2.331) (1.256–1.671) (1.671–2.156) (1.324–1.796) (1.861–2.158) (1.416–1.692) Household type 1.497� 1.092 1.492� 1.030 1.533� 0.994 1.506� 1.032 (1.315–1.704) (0.895–1.332) (1.322–1.684) (0.868–1.223) (1.351–1.740) (0.821–1.202) (1.401–1.619) (0.927–1.149) Marital status 1.619� 1.038 1.838� 1.345� 1.864� 1.426� 1.766� 1.251� (1.434–1.828) (0.857–1.258) (1.647–2.051) (1.141–1.585) (1.657–2.098) (1.185–1.717) (1.651–1.889) (1.128–1.388) Education level 1.671� 1.257� 1.834� 1.240� 1.506� 1.122 1.675� 1.206� (1.429–1.953) (1.046–1.510) (1.624–2.070) (1.068–1.439) (1.329–1.708) (0.956–1.317) (1.549–1.811) (1.097–1.325)
Current employment status 1.575� 1.348� 1.507� 1.198� 1.432� 1.151 1.510� 1.236�
(1.378–1.799) (1.168–1.556) (1.334–1.703) (1.051–1.366) (1.252–1.636) (0.998–1.328) (1.401–1.628) (1.140–1.340) Past career 1.616� 1.088 1.880� 1.174 1.325� 0.959 1.614� 1.073 (1.238–2.109) (0.800–1.481) (1.561–2.265) (0.946–1.457) (1.093–1.605) (0.769–1.196) (1.425–1.827) (0.931–1.238) Annual income 1.406� 0.982 1.534� 1.191� 1.293� 1.020 1.417� 1.066 (1.242–1.592) (0.853–1.131) (1.376–1.710) (1.050–1.351) (1.150–1.454) (0.890–1.168) (1.324–1.516) (0.986–1.152) Personal wealth 1.508� 1.079 1.526� 1.125 1.222� 0.962 1.426� 1.070 (1.331–1.709) (0.933–1.247) (1.368–1.702) (0.994–1.274) (1.086–1.375) (0.841–1.100) (1.332–1.527) (0.992–1.153) Number of children 1.219� 1.047 1.206� 0.991 1.239� 0.997 1.220� 1.007 (1.075–1.383) (0.913–1.202) (1.083–1.343) (0.881–1.114) (1.100–1.395) (0.874–1.138) (1.140–1.305) (0.935–1.085) Relationship satisfaction 1.260� 1.196� 1.459� 1.302� 1.410� 1.346� 1.371� 1.276� (1.111–1.430) (1.050–1.363) (1.303–1.634) (1.159–1.463) (1.251–1.589) (1.184–1.529) (1.280–1.469) (1.188–1.371) �p<0.05;
AOR of each investigated factor was the odds ratio adjusted by all other factors (confounders) and survey year. https://doi.org/10.1371/journal.pone.0234787.t004
Korea, which began in the early 1960s. In addition, gender and current employment status were identified to have a dominant influence on income and wealth. Therefore, the signifi-cance of ‘past career’, ‘household type’, ‘number of children’, ‘income’ and ‘wealth’ on elderly fall risks (indicated by univariate logistic regression) was likely due to the confounding effects from other relevant socioeconomic factors (education level, gender, marital status, age, current employment status etc.).
After adjusting for potentially confounding effects, gender was found to be the most impor-tant socioeconomic factor related to fall risk in Korean elderly (AOR in the whole peri-ods = 1.548), followed by relationship satisfaction (AOR = 1.276), marital status
(AOR = 1.251), age (AOR = 1.245), and current employment status (AOR = 1.236), with edu-cation level (AOR = 1.206) being statistically significant but least important. Therefore, it is possible to infer being older female with lower relationship satisfaction were the foremost socioeconomic characteristics for risk of falling in community-dwelling Korean elderly. Sur-prisingly, even though age has been considered as an important risk factor in elderly’s falls by many earlier studies, its effect after the adjustment, though still statistically significant, was found to be only moderate in this study (AOR = 1.245). This result is consistent with the find-ings from Oh et al. [49] and Bueno-Cavanillas et al. [52]. We believe the fundamental reason that age is a major fall risk factor in older people is the decline in physical, sensory and cogni-tive functions due to aging rather than age itself.
Some limitations are inherent within this study. Firstly, the selected factors for socioeco-nomic status are not fully representative. Some important factors such as home environment and religion were not covered in this study due to the lack of corresponding data. Secondly, due to the nature of retrospective study, we can only determine the associations between the socioeconomic factors and the risk of falling for the Korean elderly, not the causation. Last but not least, caution should be taken in generalizing the findings from this study to elderly popu-lations in other countries because socioeconomic characteristics can vary from different coun-tries or cultures.
Conclusions
The estimated annual fall rates of community-dwelling Korean elderly ranged from 15.9% to 25.1%. The groups with higher fall risks were identified as older aged, being female, not mar-ried or widowed, less educated, unemployed, and having lower relationship satisfaction. Gen-der (AOR = 1.548) and relationship satisfaction (AOR = 1.276) were the utmost important fall risk factors. Therefore, it is possible to infer being older female with lower relationship satisfac-tion were the foremost socioeconomic characteristics for risk of falling in community-dwelling Korean elderly. These findings could contribute to better understanding of the socioeconomic fall risk profiles among Korean elderly and effective strategies for fall prevention.
Author Contributions
Conceptualization: Sang D. Choi, Shuping Xiong. Data curation: Taekyoung Kim.
Formal analysis: Taekyoung Kim. Funding acquisition: Shuping Xiong.
Methodology: Taekyoung Kim, Sang D. Choi, Shuping Xiong. Project administration: Shuping Xiong.
Supervision: Sang D. Choi, Shuping Xiong. Validation: Taekyoung Kim, Shuping Xiong.
Writing – original draft: Taekyoung Kim, Shuping Xiong. Writing – review & editing: Sang D. Choi, Shuping Xiong.
References
1. Lord SR, Sherrington C, Menz HB. Falls in older people: Risk factors and strategies for prevention. Cambridge Univ Press 2007; 35:3–16.https://doi.org/10.1093/ageing/afl084.
2. Talbot LA, Musiol RJ, Witham EK, Metter EJ. Falls in young, middle-aged and older community dwelling adults: Perceived cause, environmental factors and injury. BMC Public Health 2005; 5:1–9.https://doi. org/10.1186/1471-2458-5-86PMID:15627405
3. World Health Organization. WHO Global Report on Falls Prevention in Older Age. Geneva: 2007. https://doi.org/9789241563536.
4. Burns ER, Stevens JA, Lee R. The direct costs of fatal and non-fatal falls among older adults—United States. J Safety Res 2016; 58:99–103.https://doi.org/10.1016/J.JSR.2016.05.001PMID:27620939 5. Qiu H, Xiong S. Center-of-pressure based postural sway measures: Reliability and ability to distinguish
between age, fear of falling and fall history. Int J Ind Ergon 2015; 47:28–35.https://doi.org/10.1016/j. ergon.2015.02.004.
6. Ambrose AF, Paul G, Hausdorff JM. Risk factors for falls among older adults: A review of the literature. Maturitas 2013; 75:51–61.https://doi.org/10.1016/j.maturitas.2013.02.009PMID:23523272
7. Bongue B, Dupre´ C, Beauchet O, Rossat A, Fantino B, Colvez A. A screening tool with five risk factors was developed for fall-risk prediction in community-dwelling elderly. J Clin Epidemiol 2011; 64:1152– 60.https://doi.org/10.1016/j.jclinepi.2010.12.014PMID:21463927
8. Pluijm SMF, Smit JH, Tromp EAM, Stel VS, Deeg DJH, Bouter LM, et al. A risk profile for identifying community-dwelling elderly with a high risk of recurrent falling: Results of a 3-year prospective study. Osteoporos Int 2006; 17:417–25.https://doi.org/10.1007/s00198-005-0002-0PMID:16416256 9. Ganz DA, Bao Y, Shekelle PG, Rubenstein LZ. Will My Patient Fall? Am Med Assoc 2007; 297:77–86.
https://doi.org/10.1001/jama.297.1.77.
10. Tinetti ME, Kumar C. The Patient Who Falls “It ‘ s Always a Trade-off”. JAMA 2010; 303:258–66.https:// doi.org/10.1001/jama.2009.2024PMID:20085954
11. Moncada L van V. Management of falls in older persons: A prescription for prevention. Am Fam Physi-cian 2011; 84:1267–76. PMID:22150660
12. Vafaei A, Pickett W, Zunzunegui MV, Alvarado BE. Neighbourhood social and built environment factors and falls in community-dwelling canadian older adults: A validation study and exploration of structural confounding. SSM—Popul Heal 2016; 2:468–75.https://doi.org/10.1016/j.ssmph.2016.06.003. 13. Zhou Y, Zhou L, Fu C, Wang Y, Liu Q, Wu H, et al. Socio-economic factors related with the subjective
well-being of the rural elderly people living independently in China. Int J Equity Health 2015; 14:1–9. https://doi.org/10.1186/s12939-015-0136-4PMID:25566790
14. Cohen S. Social Relationships and Health. Am Psychol 2004; 59:676–84. https://doi.org/10.1037/0003-066X.59.8.676PMID:15554821
15. Baker EH. Socioeconomic Status, Definition. Wiley Blackwell Encycl. Heal. Illness, Behav. Soc., John Wiley & Sons, Ltd; 2014.
16. Korea Institute for Health and Social Affairs. 2017 Statistics on the Aged. Sejong: 2017.
17. Delbaere K, Close JCT, Heim J, Sachdev PS, Brodaty H, Slavin MJ, et al. A multifactorial approach to understanding fall risk in older people. J Am Geriatr Soc 2010; 58:1679–85.https://doi.org/10.1111/j. 1532-5415.2010.03017.xPMID:20863327
18. Dhargave P, Sendhilkumar R. Prevalence of risk factors for falls among elderly people living in long-term care homes. J Clin Gerontol Geriatr 2016; 7:99–103.https://doi.org/10.1016/j.jcgg.2016.03.004. 19. Hung C-H, Wang C-J, Tang T-C, Chen L-Y, Peng L-N, Hsiao F-Y, et al. Recurrent falls and its risk
fac-tors among older men living in the veterans retirement communities: A cross-sectional study. Arch Ger-ontol Geriatr 2017; 70:214–8.https://doi.org/https://doi.org/10.1016/j.archger.2017.02.001PMID: 28214764
20. Sohng K-Y, Moon J-S, Song H-H, Lee K-S, Kim Y-S. Risk factors for falls among the community-dwell-ing elderly in Korea. J Korean Acad Nurs 2004; 34:1483–90.
21. Kim T, Choi SD, Xiong S. Relationship Between Socio-Economic Factors and Fall Risk for Elder Kore-ans. In: Goonetilleke R, Karwowski W, editors. Adv. Phys. Ergon. Hum. Factors. AHFE 2018. Adv. Intell. Syst. Comput., Orlando, Florida: Springer, Cham; 2019, p. 435–44.https://doi.org/https://doi. org/10.1007/978-3-319-94484-5_45.
22. Mokhtarian PL, Cao X. Examining the impacts of residential self-selection on travel behavior: A focus on methodologies. Transp Res Part B Methodol 2008; 42:204–28.https://doi.org/10.1016/j.trb.2007.07.006. 23. van de Coevering P, Maat K, van Wee B. Multi-period Research Designs for Identifying Causal Effects
of Built Environment Characteristics on Travel Behaviour. Transp Rev 2015; 35:512–32.https://doi.org/ 10.1080/01441647.2015.1025455.
24. Jo J. The Role of Korea Institute for Health and Social Affairs. Heal Policy Manag 2018; 28:217–21. 25. Huisman M, Kunst AE, Mackenbach JP. Socioeconomic inequalities in morbidity among the elderly; A
European overview. Soc Sci Med 2003; 57:861–73.https://doi.org/10.1016/S0277-9536(02)00454-9 PMID:12850111
26. Matthews RJ, Smith LK, Hancock RM, Jagger C, Spiers NA. Socioeconomic factors associated with the onset of disability in older age: A longitudinal study of people aged 75 years and over. Soc Sci Med 2005; 61:1567–75.https://doi.org/10.1016/j.socscimed.2005.02.007PMID:16005788
27. Schoufour JD, de Jonge EAL, Kiefte-de Jong JC, van Lenthe FJ, Hofman A, Nunn SPT, et al. Socio-economic indicators and diet quality in an older population. Maturitas 2018; 107:71–7.https://doi.org/ 10.1016/j.maturitas.2017.10.010PMID:29169585
28. Turrell G, Hewitt B, Patterson C, Oldenburg B. Measuring socio-economic position in dietary research: is choice of socio-economic indicator important? Public Health Nutr 2003; 6:191–200.https://doi.org/10. 1079/PHN2002416PMID:12675962
29. Choi KW, Lee I-S. Fall Risk in Low-Income Elderly People in One Urban Area. J Korean Acad Nurs 2010; 40:589–98.https://doi.org/10.4040/jkan.2010.40.4.589PMID:20820126
30. Ryu E, Juhn YJ, Wheeler PH, Hathcock MA, Wi C Il, Olson JE, et al. Individual housing-based socioeco-nomic status predicts risk of accidental falls among adults. Ann Epidemiol 2017; 27:415–20.https://doi. org/10.1016/j.annepidem.2017.05.019PMID:28648550
31. Todd C, Ballinger C, Whitehead S. Reviews of socio-demographic factors related to falls and environ-mental interventions to prevent falls amongst older people living in the community. Copenhagen: 2007. 32. Skinner C, Wakefield J. Introduction to the design and analysis of complex survey data. Stat Sci 2017;
32:165–75.https://doi.org/10.1214/17-STS614.
33. Saylor J, Friedmann E, Lee HJ. Navigating complex sample analysis using national survey data. Nurs Res 2012; 61:231–7.https://doi.org/10.1097/NNR.0b013e3182533403PMID:22551998
34. Parsons VL, Moriarity C, Jonas K, Moore TF, Davis KE, Tompkins L. Design and estimation for the national health interview survey, 2006–2015. Natl Cent Heal Stat 2014;Vital Heal:1–53.
35. Sperandei S. Understanding logistic regression analysis. Biochem Medica 2014; 24:12–8.https://doi. org/10.11613/BM.2014.003.
36. Altman DG, Royston P. The cost of dichotomising continuous variables. Br Med J 2006; 332:1080. https://doi.org/10.1136/bmj.332.7549.1080.
37. Pourhoseingholi MA, Baghestani AR, Vahedi M. How to control confounding effects by statistical analy-sis. Gastroenterol Hepatol from Bed to Bench 2012; 5:79–83.https://doi.org/10.22037/ghfbb.v5i2.246. 38. Lew FL, Qu X. Effects of mental fatigue on biomechanics of slips. Ergonomics 2014; 57:1927–32.
https://doi.org/10.1080/00140139.2014.937771PMID:25017252
39. Qiu H, Xiong S. New Hick’s law based reaction test App reveals “information processing speed” better identifies high falls risk older people than “simple reaction time”. Int J Ind Ergon 2017; 58:25–32.https:// doi.org/10.1016/j.ergon.2017.01.004.
40. Segev-Jacubovski O, Herman T, Yogev-Seligmann G, Mirelman A, Giladi N, Hausdorff JM. The inter-play between gait, falls and cognition: can cognitive therapy reduce fall risk? Expert Rev Neurother 2014; 11:1057–75.https://doi.org/10.1586/ern.11.69.
41. Choi H-J, Lee S-J. Development Direction of health promotion programs to prevent Korean elderly dementia. Korean J Sport Sci 2016; 25:329–37.
42. Chang VC, Do MT. Risk factors for falls among seniors: Implications of gender. Am J Epidemiol 2015; 181:521–31.https://doi.org/10.1093/aje/kwu268PMID:25700887
43. Noh JW, Kim KB, Lee JH, Lee BH, Kwon YD, Heui Lee S. The elderly and falls: Factors associated with quality of life A cross-sectional study using large-scale national data in Korea. Arch Gerontol Geriatr 2017; 73:279–83.https://doi.org/10.1016/j.archger.2017.08.008PMID:28886493
44. Wu H, Ouyang P. Fall prevalence, time trend and its related risk factors among elderly people in China. Arch Gerontol Geriatr 2017; 73:294–9.https://doi.org/10.1016/j.archger.2017.08.009PMID:28910753 45. Johansson J, Nordstro¨m A, Nordstro¨ m P. Greater Fall Risk in Elderly Women Than in Men Is
Associ-ated With Increased Gait Variability During Multitasking. J Am Med Dir Assoc 2016; 17:535–40.https:// doi.org/10.1016/j.jamda.2016.02.009PMID:27006336
46. Sotoudeh GR, Mohammadi R, Mosallanezhad Z, Viitasara E, Soares JJF. The prevalence, circum-stances and consequences of unintentional falls among elderly Iranians: A population study. Arch Ger-ontol Geriatr 2018; 79:123–30.https://doi.org/https://doi.org/10.1016/j.archger.2018.08.001PMID: 30205318
47. Park S, Hwang Y, Oh B, Lee J, Hong S, Kim S, et al. The Relationship between Socioeconomic Vulner-ability and Cognitive Impairment among Aged People in Korea 2017; 18:74–81.
48. Gill T, Taylor AW, Pengelly A. A population-based survey of factors relating to the prevalence of falls in older people. Gerontology 2005; 51:340–5.https://doi.org/10.1159/000086372PMID:16110237 49. Oh E, Hong GRS, Lee S, Han S. Fear of falling and its predictors among community-living older adults
in Korea. Aging Ment Heal 2017; 21:369–78.https://doi.org/10.1080/13607863.2015.1099034. 50. Kumar A, Carpenter H, Morris R, Iliffe S, Kendrick D. Which factors are associated with fear of falling in
community-dwelling older people? Age Ageing 2014; 43:76–84.https://doi.org/10.1093/ageing/aft154 PMID:24100619
51. Chang HH, Yen ST. Full-time, part-time employment and life satisfaction of the elderly. J Socio Econ 2011; 40:815–23.https://doi.org/10.1016/j.socec.2011.08.008.
52. Bueno-Cavanillas A, Padilla-Ruiz F, Jimenez-Moleon J, Peinado-Alonso C, Galvez-Vargas R. Risk fac-tors in falls among the older according to extrinsic and intrinsic precipitating causes. Eur J Epidemiol 2000; 16:849–59.https://doi.org/10.1023/APMID:11297228