Transient elastography and
ultrasonography for the prediction of
liver fibrosis in infants with biliary
atresia
Na-Young Shin
Department of Medicine
Transient elastography and
ultrasonography for the prediction of
liver fibrosis in infants with biliary
atresia
Na-Young Shin
Department of Medicine
Transient elastography and
ultrasonography for the prediction of
liver fibrosis in infants with biliary
atresia
Directed by Professor Myung-Joon Kim
The Master's Thesis
submitted to the Department of Medicine,
the Graduate School of Yonsei University
in partial fulfillment of the requirements for the degree
of Master of Medical Science
Na-Young Shin
This certifies that the Master's Thesis of
Na-Young Shin is approved.
---
Thesis Supervisor : Myung-Joon Kim
---
Ran Namgung
---
Seok Joo Han
The Graduate School
Yonsei University
ACKNOWLEDGEMENTS
I acknowledge my deep gratitude to Professor Myung-Joon
Kim, who is my thesis director, for supporting my efforts with
total commitment and facilitating every step of the process.
My appreciation for his guidance and encouragement is
tremendous.
Also, I am indebted to Professor Ran Namgung and Seok Joo
Han, for their help for pertinent advice to assure the superior
quality of this paper.
<TABLE OF CONTENTS>
ABSTRACT ··· 1
I. INTRODUCTION ··· 3
II. MATERIALS AND METHODS ··· 4
1. Subjects ··· 4
2. Ultrasonographic measurement ··· 5
3. Transient elastographic measurement ··· 5
4. Histologic analysis of the liver ··· 6
5. Statistical analysis ··· 6
III. RESULTS ··· 7
IV. DISCUSSION ··· 13
V. CONCLUSION ··· 17
REFERENCES ··· 17
ABSTRACT(IN KOREAN) ··· 22
LIST OF FIGURES
Figure 1. Scatterplots of (a) TE, (b) TC thickness, (c) HA
diameter, and (d) PV diameter for each fibrosis stage ··· 10
Figure 2. ROC curves for TE of (a) all, (b) the M probe group,
and (c) the S probe group patients for diagnosis of severe
fibrosis (≥F3) ··· 11
Figure 3. ROC curves for TE of (a) all, (b) the M probe group,
and (c) the S probe group patients for diagnosis of cirrhosis
(F4) ··· 12
LIST OF TABLES
Table 1. Clinical and laboratory characteristics of patients ··· 8
Table 2. TE measurements in all patients and M and S probe
groups ··· 9
Table 3. Median values of TE and US measurements for each
fibrosis stage ··· 11
Table 4. A
zValues, cut-off values and diagnostic performances
1
ABSTRACT
Transient elastography and ultrasonography for the prediction of liver
fibrosis in infants with biliary atresia
Na-Young Shin
Department of Medicine
The Graduate School, Yonsei University
(Directed by Professor Myung-Joon Kim)
Purpose: To compare transient elastography (TE) and sonographic
findings, such as triangular cord (TC) thickness and hepatic artery (HA)
and portal vein (PV) diameters, with histologic fibrosis stage for
assessing liver fibrosis in infants with biliary atresia (BA).
Materials and Methods: Between April 2007 and July 2010, 51 infants
with BA who underwent both TE and ultrasonography (US) before
surgery or liver biopsy were retrospectively included. Four patients who
had less than 5 valid shots on TE were excluded. Thus 47 of 51 patients
(19 boys, median age 60 days) were analyzed. The TC thickness and
diameters of the HA and PV were evaluated on US. TE measurements
and US findings were compared with the METAVIR fibrosis stage [F0
indicated no fibrosis (n=0); F1, portal fibrosis without septa (n=1); F2,
portal fibrosis with a few septa (n=27); F3, numerous septa without
cirrhosis (n=14); and F4 cirrhosis (n=5)]. The diagnostic value of TE and
US were evaluated. We used the M probe, a probe for general adult
population, until June 2009 and the S probe, a specific probe for children,
after July 2009. The effect of the M probe and the S probe on diagnostic
accuracy of TE was also assessed.
Results: Only TE (r=0.63; p<0.001) was significantly correlated with the
METAVIR fibrosis stage in infants with BA. Areas under the receiver
operating characteristic curve (A
z) of TE were 0.86 and 0.96 for the
diagnosis of severe fibrosis (≥F3) and cirrhosis (F4), respectively. Cut-off
values of TE measurements were >9.6 kPa (sensitivity 89.5%/specificity
2
75%) and >18.1 kPa (sensitivity 100%/specificity 90.5%) for the
diagnosis of severe fibrosis (≥F3) and cirrhosis (F4), respectively.
Success rate of the S probe (100%) was significantly higher than that of
the M probe (77%, p<0.001). Diagnostic performance of the S probe
(0.93) tends to be increased compared to the M probe (0.85) in predicting
severe fibrosis (≥F3), but not significant. The S and the M probe showed
compatible diagnostic accuracy in predicting cirrhosis (F4; 0.96 and 0.94,
respectively).
Conclusion: TE may be a useful, noninvasive method for the diagnosis of
severe fibrosis (≥F3) and cirrhosis (F4) in infants with BA. Success rate
of TE may be improved when using the S probe, a specific probe adapted
for children. Further study is needed for the evaluation of the effect of the
S probe on diagnostic accuracy of TE in assessing the degree of liver
fibrosis in infants with BA.
---
Key words : Transient elastography, ultrasonography, biliary atresia,
liver fibrosis
3
Transient elastography and ultrasonography for the prediction of liver
fibrosis in infants with biliary atresia
Na-Young Shin
Department of Medicine
The Graduate School, Yonsei University
(Directed by Professor Myung-Joon Kim)
I. INTRODUCTION
Hepatic fibrosis is a common and prominent feature of biliary atresia (BA). Since it is the most important prognostic factor in predicting outcome following portoenterostomy 1-3, it is important to evaluate the degree of hepatic fibrosis
aside from BA itself.
Ultrasonography (US) is usually used as the first step when a patient is suspicious for BA. Many US features have been suggested as predictors of BA. These include the triangular cord (TC) sign, abnormal gall bladder wall and shape, absent common bile duct, and enlarged hepatic artery (HA); they show an overall accuracy of 98% 4. The TC sign is a very specific finding, showing
sensitivity of 73-84% and specificity of 98-100% 4-6. Although Choi et al 7
mentioned there was no correlation between portal fibrosis and TC size, the study was performed with only 10 patients with BA.
Liver biopsy, followed by conventional histology, is still the gold standard to evaluate liver fibrosis. However, because of its invasiveness, it is difficult to use biopsy repeatedly for monitoring liver fibrosis 8. In addition, the accuracy of
liver biopsy is limited by both intra- and interobserver variability and sampling errors 9. As a result of these limitations, many investigators have been focused
on the evaluation of alternative, noninvasive methods for assessing liver fibrosis.
4
According to a recent systematic review and meta-analysis, transient elastography (TE, FibroScan®, Echosens, Paris, France) is a promising
noninvasive method for the assessment of liver fibrosis 10, 11. There have been a
few studies focused on children with chronic liver diseases of mixed etiology 12
and specific liver diseases such as cystic fibrosis-associated liver disease 13 and
nonalcoholic fatty liver disease 14. They all suggested that TE was an attractive
method to assess liver fibrosis. There were few data available on the use of TE in children with BA for evaluating the degree of hepatic fibrosis.
The aim of this study was to compare TE with sonographic findings, including TC thickness and HA and portal vein (PV) diameters, for the noninvasive assessment of liver fibrosis in infants with BA.
II. MATERIALS AND METHODS 1. Subjects
Between April 2007 and July 2010, 51 infants younger than 1 year of age who underwent TE and US before surgery or liver biopsy were included retrospectively. The interval between TE and US was less than 5 days. Since Kettaneh et al 15 suggested that at least 5 valid shots are requested for no significant loss in TE performance for the diagnosis of liver cirrhosis, we excluded 4 patients who had less than 5 valid shots on TE. Thus 47 patients (19 boys, 28 girls; median age, 60 days) were included in this study. Among the 47 patients, 27 patients (11 boys, 16 girls; median age, 63 days) underwent TE with the M probe, a probe for general adult population, and 20 patients (8 boys, 12 girls; median age, 49 days) with the S probe because the S probe, a specific probe for children, was available after July 2009.
Routine chemical studies, including measurement of total and direct serum bilirubin levels (TB: DB), aspartate and alanine aminotransferase (AST: ALT),
5
alkaline phosphatase (ALP), and gamma glutamyl transferase (GGT), were also performed in all patients. Reference ranges for the blood sample parameters used by our institution were: 0.2-1.2 mg/dL for TB, 0.1-0.4 mg/dL for DB, 13-34 IU/L for AST, 5-46 IU/L for ALT, 60-300 IU/L for ALP, and 12-54 IU/L for GGT.
2. Ultrasonographic measurement
Two pediatric radiologists (M.J.K. and M.J.L., with more than 15 years and 2 years of experience in pediatric US, respectively) performed US using 5–8-MHz curved linear and 5–12-MHz linear transducers (HDI 5000 and IU-22, respectively; Philips, Bothell, WA) in all patients, who had not been fed for at least 4 hours. At longitudinal scan, the thickness of TC was measured as thickness of echogenic anterior wall of the right portal vein just proximal to the right PV bifurcation site. We also evaluated the diameter of the proper HA, which runs parallel to the main PV and the PV diameter at the level of the proximal portion of the main PV.
3. Transient elastographic measurement
An experienced technician performed TE (FibroScan®502, Echosens, Paris,
France) under the supervision of a gastroenterologist. The probe was placed between the two ribs in the intercostal position on the right lobe of the liver with the children in the supine position with maximal abduction of the right arm. Elasticity was measured at a depth of 25-65 mm under the skin surface for the M probe, used until June 2009. The M probe is designed for the general population and used for adults, and its transducer frequency is 3.5 MHz. The measurement volume, a diameter of 1 cm and a length of 4 cm, was located at the free end of large vessels with the assistance of ultrasound M-mode and A-mode images.
6
We used the S probe, a specific probe for children, after July 2009. The S probe has a transducer reduced in size for narrower intercostal spaces and increased in frequency (5 MHz) for smaller chest, enabling adapted measurement for children. The depth calculation is also adapted from 15 to 50 mm for the smaller liver of children.
Results are expressed in kilopascals (kPa). Generally, 10 valid measurements should be obtained in each patient. The median value of the 10 valid measurements is considered representative of liver stiffness. The success rate is defined as the number of valid measurements divided by the total number of measurements. An examination is considered reliable when the success rate is higher than 60% and interquartile range is smaller than the third of median value. As mentioned, according to Kettaneh et al 15, we considered the
examination was acceptable only if at least five valid measurements were obtained.
4. Histologic analysis of the liver
All infants (n=47) with BA underwent Kasai operation with liver biopsy (n=43) or liver transplantation (n=4). One pathologist (Y.N.P) with more than 10 years of experience performed the histopathologic examination of the specimens. Liver fibrosis stage was described with the METAVIR scoring system using a 5-point (F0-F4) scale: Stage F0 indicated no fibrosis (n=0); F1, mild fibrosis (portal fibrosis without septa; n=1); F2, significant fibrosis (portal fibrosis and few septa; n=27); F3, severe fibrosis (numerous septa without cirrhosis; n=14); and F4, cirrhosis (n=5).
5. Statistical analysis
Whether data were normally distributed was determined using the Kolmogorov-Smirnov test. Accordingly, data that did or did not exhibit normal distribution were presented as mean ± standard deviation or median and
7
quantitative variables were compared using an unpaired t-test or the Mann-Whitney test, respectively. Correlations between the TE or US measurements and the histologic fibrosis stages were analyzed using Spearman or Pearson correlation coefficients when appropriate. We assessed diagnostic performance using receiver operating characteristic (ROC) curves. Areas under the receiver operating characteristic curve (Az) with 95% confidence intervals
were calculated based on the method developed by Hanley et al 16. A
comparison between ROC curves of the M probe and the S probe of TE was also performed. P<0.05 indicated a significant correlation or difference. Multivariate regression test was used to evaluate whether any clinical or laboratory variables could affect diagnostic performance of TE. All data management and statistical calculations were performed using SPSS, version17 software (SPSS, Chicago, IL) and MedCalc®, Version 9.5.0.0 software (MedCalc software, Mariakerke, Belgium).
III. RESULTS
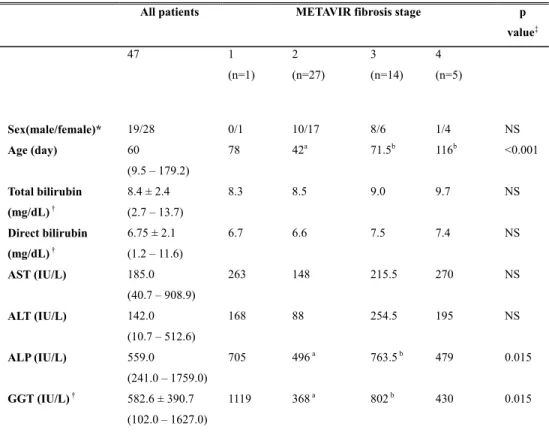
Between April 2007 and July 2010, 47 patients met the inclusion criteria. Among them, 27 patients and 14 patients had METAVIR fibrosis stage 2 and 3, respectively. Only 1 patient and 5 patients were graded as fibrosis stage 1 and 4, respectively. The patients with severe fibrosis (F3) and cirrhosis (F4) were significantly older than the patients with significant fibrosis (F2; Table 1).
The level of total and direct bilirubin, ALT, and AST did not show significant differences between each fibrosis group. The levels of ALP and GGT were significantly higher in the patients with severe fibrosis (F3) than those in the patients with significant fibrosis (F2), but tended to decrease in the patients with cirrhosis (F4; Table 1).
8
Table 1. Clinical and laboratory characteristics of patients
All patients METAVIR fibrosis stage p
value‡ 47 1 (n=1) 2 (n=27) 3 (n=14) 4 (n=5) Sex(male/female)* 19/28 0/1 10/17 8/6 1/4 NS Age (day) 60 (9.5 – 179.2) 78 42a 71.5b 116b <0.001 Total bilirubin (mg/dL) † Direct bilirubin (mg/dL) † 8.4 ± 2.4 (2.7 – 13.7) 8.3 8.5 9.0 9.7 NS 6.75 ± 2.1 (1.2 – 11.6) 6.7 6.6 7.5 7.4 NS AST (IU/L) 185.0 (40.7 – 908.9) 263 148 215.5 270 NS ALT (IU/L) 142.0 (10.7 – 512.6) 168 88 254.5 195 NS ALP (IU/L) 559.0 (241.0 – 1759.0) 705 496a 763.5b 479 0.015 GGT (IU/L) † 582.6 ± 390.7 (102.0 – 1627.0) 1119 368a 802b 430 0.015
Note.-Unless otherwise indicated, data are medians. Numbers in parentheses, where applicable, are 95% central range. ALP = alkaline phosphatase, ALT = alanine aminotransferase, AST = aspartate aminotransferase, GGT = γ-glutamyltransferase.
* Data are numbers of patients.
† Data are means ± standard deviations, and numbers in parentheses are range in all patients. ‡ P values for comparing each METAVIR fibrosis stage groups.
a, b p<0.05 between two groups
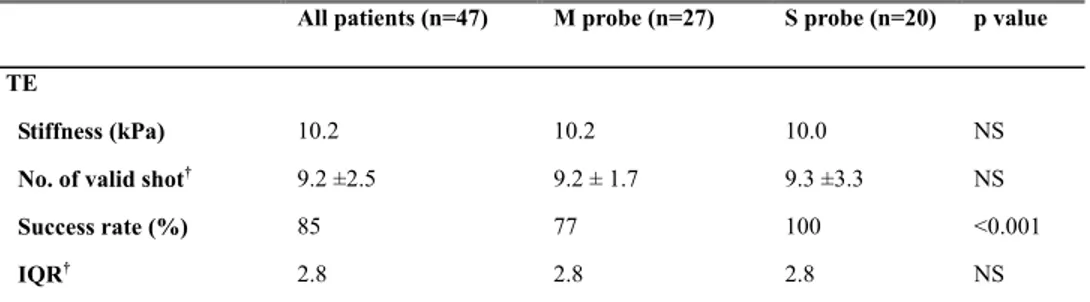
The success rate of TE was statistically different between the M and the S probe group: it was higher in the group using the S probe (100%) than that in the group using the M probe (77%, p<0.001; Table 2).
9
Table 2. TE measurements in all patients and M and S probe groups
All patients (n=47) M probe (n=27) S probe (n=20) p value TE
Stiffness (kPa) 10.2 10.2 10.0 NS
No. of valid shot† 9.2 ±2.5 9.2 ± 1.7 9.3 ±3.3 NS
Success rate (%) 85 77 100 <0.001
IQR† 2.8 2.8 2.8 NS
Note.-Unless otherwise indicated, data are medians. HA = hepatic artery, IQR = interquartile range, No. = number
† Data are means ± standard deviations.
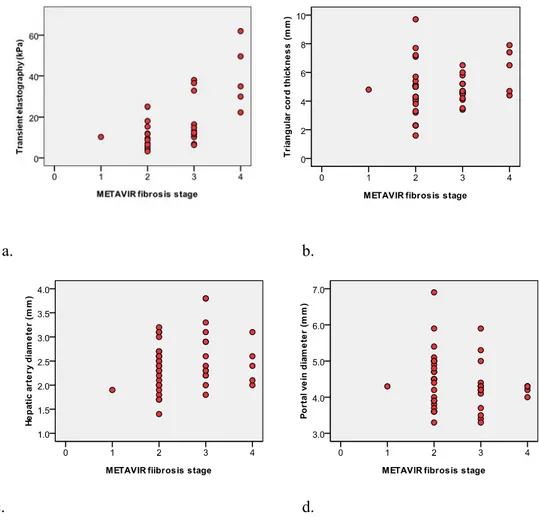
TE measurements were positively correlated to the METAVIR fibrosis stage (r=0.63, p<0.001), but not TC thickness and HA and PV diameters (Figure 1).
10 a. b.
c. d.
Figure 1. Scatterplots of (a) TE, (b) TC thickness, (c) HA diameter, and (d) PV diameter for each fibrosis stage. TE measurements are positively correlated to the fibrosis stages (r=0.63, p<0.001), while none of the sonographic findings are correlated to the fibrosis stages.
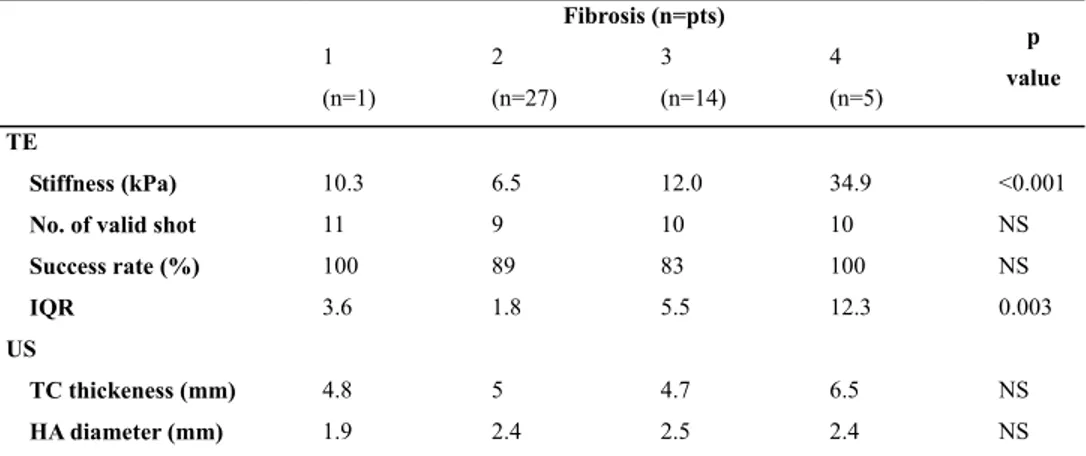
The corresponding median values of TE were 10.3, 6.5, 12.0, and 34.9 kPa for F1, F2, F3, and F4, respectively (Table 3).
11
Table 3. Median values of TE and US measurements for each fibrosis stage
Fibrosis (n=pts) p value 1 (n=1) 2 (n=27) 3 (n=14) 4 (n=5) TE Stiffness (kPa) 10.3 6.5 12.0 34.9 <0.001
No. of valid shot 11 9 10 10 NS
Success rate (%) 100 89 83 100 NS
IQR 3.6 1.8 5.5 12.3 0.003
US
TC thickeness (mm) 4.8 5 4.7 6.5 NS
HA diameter (mm) 1.9 2.4 2.5 2.4 NS
Note.-Unless otherwise indicated, data are medians. HA = hepatic artery, IQR = interquartile range, No. = number, TC = triangular cord.
Figure 2 and 3 show diagnostic performances of TE by ROC curves for the diagnosis of severe fibrosis (≥F3) and cirrhosis (F4).
a. b. c.
Figure 2. ROC curves for TE of (a) all, (b) the M probe group, and (c) the S probe group patients for the diagnosis of severe fibrosis (≥F3). The Az value of
TE in predicting severe fibrosis (≥F3) is 0.86. The Az value of the S probe
(0.93) is higher than that of the M probe (0.85) in predicting severe fibrosis (≥F3), but does not reach a level of significance.
12
a. b. c.
Figure 3. ROC curves for TE of (a) all, (b) the M probe group, and (c) the S probe group patients for the diagnosis of cirrhosis (F4). The Az value of TE in
predicting cirrhosis (F4) is 0.96. The Az value of the S probe (0.94) is
compatible with that of the M probe (0.96) in predicting cirrhosis.
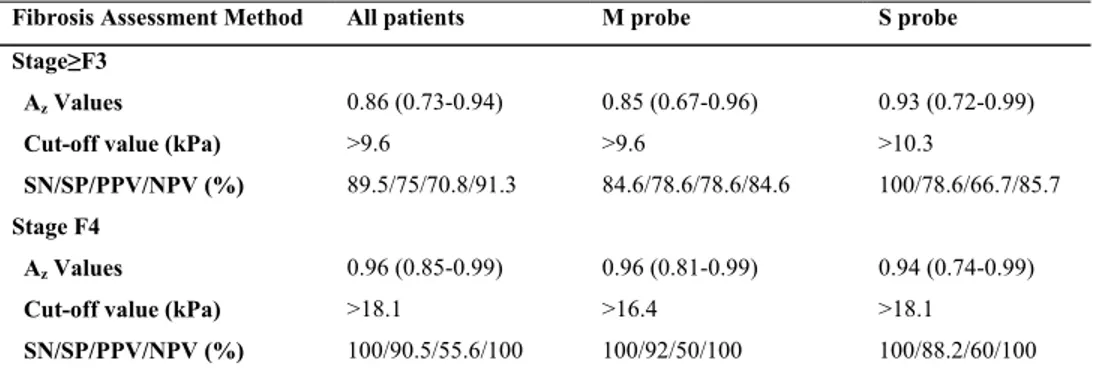
Table 4 shows the Az values, cut-off values, and corresponding sensitivity,
specificity, and positive and negative predictive values of TE in predicting severe fibrosis (≥F3) and cirrhosis (F4) in all, the M probe group, and the S probe group patients.
Table 4. Az values, cut-off values and diagnostic performances of TE for the
diagnosis of different histologic fibrosis stages
Fibrosis Assessment Method All patients M probe S probe
Stage≥F3
Az Values 0.86 (0.73-0.94) 0.85 (0.67-0.96) 0.93 (0.72-0.99)
Cut-off value (kPa) >9.6 >9.6 >10.3
SN/SP/PPV/NPV (%) 89.5/75/70.8/91.3 84.6/78.6/78.6/84.6 100/78.6/66.7/85.7
Stage F4
Az Values 0.96 (0.85-0.99) 0.96 (0.81-0.99) 0.94 (0.74-0.99)
Cut-off value (kPa) >18.1 >16.4 >18.1
SN/SP/PPV/NPV (%) 100/90.5/55.6/100 100/92/50/100 100/88.2/60/100
13
Diagnostic performance of TE was excellent (0.96) for the diagnosis of cirrhosis and good (0.86) for the diagnosis of severe fibrosis (≥F3). The Az
value of the S probe (0.93) is higher than that of the M probe (0.85) in predicting severe fibrosis (≥F3), but without statistic significance. The Az value
of the S probe (0.94) is compatible with that of the M probe (0.96) in predicting cirrhosis (F4). Multivariate regression showed that except for histologic fibrosis stage (bi=8.01, p=0.001), only age (bi=0.16,p=0.001) had an independent effect
on performance of TE.
IV. DISCUSSION
Liver fibrosis is a common feature in BA and the most important prognostic factor in predicting outcome following portoenterostomy 1-3. The pathogenesis
of liver fibrosis in BA is still unknown; novel hypotheses suggested that besides cholestasis from bile duct obliteration, other mechanisms such as recurrent cholangitis and oxidative stress may be involved 17. Therefore, even after portoenterostomy, liver fibrosis can be progressive, and can be associated with complications such as portal hypertension and esophageal and gastric varices, which can be life-threatening. Therefore, it is important to monitor the degree of liver fibrosis in BA both before and after portoenterostomy.
Liver biopsy is still the gold standard for the evaluation of liver fibrosis, but has shortcomings such as invasiveness, sampling error, and inter-observer variability 8, 9. Therefore, when it is used as a monitoring tool, it can be more
problematic. As a result of these limitations, efforts to identify and validate noninvasive methods for assessing liver fibrosis have been performed. TE, one promising method, performed excellent diagnostic accuracy in predicting cirrhosis, but was less accurate in predicting less severe fibrosis in a meta-analysis study 10. Similar studies were performed in adults. Few studies
14
focused on children 12-14. De Ledinghen et al 12 evaluated the feasibility of TE
and compared it with surrogate serum fibrosis markers such as Fibrotest and aspartate transaminase to platelet ratio index (APRI). They suggested that TE is feasible in children, with the highest diagnostic accuracy of 0.88 for the diagnosis of cirrhosis. However, they studied children with a wide age range (2 months to 20 years in age) and mixed etiology of chronic liver diseases. Meten et al 13 prospectively compared TE and US in children and adults with only
cystic fibrosis-associated liver disease and suggested TE as an attractive non-invasive way to assess and monitor liver disease in cystic fibrosis patients. There was, however, no histological evaluation as a reference standard. Nobili et al 14 also evaluated performance of TE compared with the histologic fibrosis
stages in pediatric patients with nonalcoholic steatohepatitis and it showed excellent diagnostic accuracy. Their study group also included patients with a quite wide age range (4-17 years). Chang et al 18 evaluated TE as a
preendoscopic screening tool in postoperative patients with BA, but this study did not focus on examining the degree of liver fibrosis.
In our study, TE was excellent (0.96) in diagnosing cirrhosis (F4), but less accurate (0.86) in diagnosing severe fibrosis (≥F3); this was compatible with the previous studies. Cut-off values of TE in predicting severe fibrosis (≥F3) and cirrhosis (F4) varied somewhat between the previous studies with a range of 7.9-11 kPa and 11.0-25.8 kPa, respectively 19-24. In our study, cut-off values of TE for the diagnosis of severe fibrosis (≥F3) and cirrhosis (F4) were >9.6 kPa and >18.1 kPa, which were compatible with the previous studies 14, 25. Because
most patients with BA were graded ≥F2, we could not evaluate diagnostic performance of TE in predicting significant fibrosis (≥F2) in this study.
The positive relationship between TE measurements and the degree of necroinflammatory activity, represented as the level of ALT, has been well described mostly in adult patients with viral hepatitis 26-29. In our study, the level
15
had an independent effect on TE measurements in multivariate logistic analysis. We could not investigate the cause of difference between the result of previous studies and our study because there was no avaiable histology-based assessment of the degree of necroinflammatory activity and there was no sufficient number of patients, especially in normal, mild fibrosis (F1), and cirrhosis (F4) groups in our retrospective study. A histology-based, larger scale study is needed.
Nobili et al 14 reported no relathionship between age and liver stiffness in
either the control group or the patients with cystic fibrosis. On the other hand, Roulot et al 30 performed TE in 429 healthy subjects with a mean age of 45.1
years, and their results showed that mean liver stiffness value tended to be higher with age. Our results also showed that age (bi=0.16,p=0.001) had a
significant effect on TE, even though our study subjects were limited to the infants younger than 1 year of age. Since there was no available data of TE in a group of children in the same age range without liver disease or with non BA, we could not compare our results with the group.
According to de Ledinghen et al 12, there were some limitations in using the M
probe of TE in children. Because children have smaller size of liver, the depth of measurement should be adapted. Because of narrow intercostal spaces, the transducer may not only push soft tissues but also ribs, causing several shear waves. The faster band corresponding to the wave propagating into interferences can lead to an overestimation of liver stiffness. Therefore, a specific probe for children, the S probe, has been developed. In our institution, the S probe was available from July 2009, and all patients in this study underwent TE with the S probe from that time. The success rate of the S probe (100%) was significantly higher than that of the M probe (77%). The diagnostic accuracy of the S probe in predicting severe fibrosis (≥F3) tended to be higher than that of the M probe, but did not reach a level of significance.
The TC sign on US is an important component for the diagnosis of BA, representing a fibrous ductal remnant in the porta hepatis. Ohi and Ibrahim 31
16
divided surgical morphologic findings into several types according to the pattern of the hepatic radicles at the porta hepatis in patients with BA. The types were as followed: triangular, cone-shaped, fibrous mass (67%); fibrous hepatic ducts (15%); aplasia of hepatic ducts (6%); dilated hepatic ducts (5%); hypoplastic hepatic ducts (4%); and bile lakes (3%). The most common type, fibrotic mass, can appear as a TC sign on US, but other types cannot. In BA, because TC thickness may be mainly influenced by the morphologic type of fibrous ductal remnant, the degree of fibrosis is of little importance in TC thickness. In our study, TC thickness did not show significant correlation with METAVIR fibrosis stage.
Burgener et al 32 found increases in the number and diameter of hepatic arterial
branches in advanced hepatic fibrosis. However, as some authors described, HA is hyperplastic and hypertrophied in patients with BA 33-35. Therefore, we tried
to evaluate whether the relationship between liver fibrosis and HA diameter can be applied to patients with BA. The hepatic arteriopathy may be a compensating change for the diminished PV flow in advanced liver fibrosis or a manifestation of ductal plate malformation, although its pathogenesis remains uncertain 34, 35.
Therefore, an enlarged HA cannot be explained only by liver fibrosis, especially in patients with BA, and our results showed no significant correlation between the diameter of HA and the histologic fibrosis stages.
The PV diameter also was not correlated with the histologic fibrosis stages. A diameter of PV may increase or decrease mostly with hepatopetal or hepatofugal blood flow, respectively 36, and this could explain our results.
Our study had limitations. This study was performed retrospectively, so we did not have data on infants without liver disease as a control group. Therefore, we had to compare our results to those of previous studies which were performed with adult patients. As mentioned above, age could change TE value in the same histologic fibrosis stages; therefore, a larger scale study is necessary to establish normal values in infants. Another limitation was that we did not obtain
17
information about the degree of necroinflammatory activity or cholestasis on the histologic liver analysis, although it might have led to an overestimation of liver stiffness 26, 28, 37. Laboratory data such as ALT, which is a poor marker of
inflammation 13, cannot accurately reflect factors influencing liver stiffness
other than fibrosis. Therefore, a histology-based analysis is needed to clarify other potential factors affecting liver stiffness. An additional limitation was that the numbers of patients with no fibrosis (F0), mild fibrosis (F1) or cirrhosis (F4) were small. As a result, we could not get reliable data from those patients.
V. CONCLUSION
In conclusion, TE can be used as a noninvasive method for the diagnosis of severe fibrosis (≥F3) and cirrhosis (F4) in infants with BA. Using the S probe, a specific probe adapted to children, may increase the success rate of TE in infants with BA. Further evaluation is needed for the evaluation of effect of the S probe on the diagnostic accuracy of TE in assessing the degree of liver fibrosis in infants with BA and control subjects. US findings including TC thickness and HA and PV diameters were not useful in predicting liver fibrosis in infants with BA.
REFERENCES
1. Davenport M, Howard ER. Macroscopic appearance at portoenterosto- my-a prognostic variable in biliary atresia. J Pediatr Surg 1996;31(10):1387-90. 2. Shteyer E, Ramm GA, Xu C, White FV, Shepherd RW. Outcome after portoenterostomy in biliary atresia: pivotal role of degree of liver fibrosis and intensity of stellate cell activation. J Pediatr Gastroenterol Nutr 2006;42(1):93-9.
18
3. Weerasooriya VS, White FV, Shepherd RW. Hepatic fibrosis and survival in biliary atresia. J Pediatr 2004;144(1):123-5.
4. Humphrey TM, Stringer MD. Biliary atresia: US diagnosis. Radiology 2007;244(3):845-51.
5. Lee HJ, Lee SM, Park WH, Choi SO. Objective criteria of triangular cord sign in biliary atresia on US scans. Radiology 2003;229(2):395-400. 6. Park WH, Choi SO, Lee HJ. The ultrasonographic 'triangular cord' coupled with gallbladder images in the diagnostic prediction of biliary atresia from infantile intrahepatic cholestasis. J Pediatr Surg 1999;34(11):1706-10. 7. Choi SO, Park WH, Lee HJ, Woo SK. 'Triangular cord': a sonographic finding applicable in the diagnosis of biliary atresia. J Pediatr Surg 1996;31(3):363-6.
8. Piccinino F, Sagnelli E, Pasquale G, Giusti G. Complications following percutaneous liver biopsy. A multicentre retrospective study on 68,276 biopsies. J Hepatol 1986;2(2):165-73.
9. Bedossa P, Dargere D, Paradis V. Sampling variability of liver fibrosis in chronic hepatitis C. Hepatology 2003;38(6):1449-57.
10. Friedrich-Rust M, Ong MF, Martens S, Sarrazin C, Bojunga J, Zeuzem S, et al. Performance of transient elastography for the staging of liver fibrosis: a meta-analysis. Gastroenterology 2008;134(4):960-74.
11. Andersen ES, Christensen PB, Weis N. Transient elastography for liver fibrosis diagnosis. Eur J Intern Med 2009;20(4):339-42.
12. de Ledinghen V, Le Bail B, Rebouissoux L, Fournier C, Foucher J, Miette V, et al. Liver stiffness measurement in children using FibroScan: feasibility study and comparison with Fibrotest, aspartate transaminase to platelets ratio index, and liver biopsy. J Pediatr Gastroenterol Nutr 2007;45(4):443-50.
13. Menten R, Leonard A, Clapuyt P, Vincke P, Nicolae AC, Lebecque P. Transient elastography in patients with cystic fibrosis. Pediatr Radiol
19 2010;40(7):1231-5.
14. Nobili V, Vizzutti F, Arena U, Abraldes JG, Marra F, Pietrobattista A, et al. Accuracy and reproducibility of transient elastography for the diagnosis of fibrosis in pediatric nonalcoholic steatohepatitis. Hepatology 2008;48(2):442-8. 15. Kettaneh A, Marcellin P, Douvin C, Poupon R, Ziol M, Beaugrand M, et al. Features associated with success rate and performance of FibroScan measurements for the diagnosis of cirrhosis in HCV patients: a prospective study of 935 patients. J Hepatol 2007;46(4):628-34.
16. Hanley JA, McNeil BJ. The meaning and use of the area under a receiver operating characteristic (ROC) curve. Radiology 1982;143(1):29-36. 17. Haafiz AB. Liver fibrosis in biliary atresia. Expert Rev Gastroenterol Hepatol 2010;4(3):335-43.
18. Chang HK, Park YJ, Koh H, Kim SM, Chung KS, Oh JT, et al. Hepatic fibrosis scan for liver stiffness score measurement: a useful preendoscopic screening test for the detection of varices in postoperative patients with biliary atresia. J Pediatr Gastroenterol Nutr 2009;49(3):323-8. 19. Castera L, Vergniol J, Foucher J, Le Bail B, Chanteloup E, Haaser M, et al. Prospective comparison of transient elastography, Fibrotest, APRI, and liver biopsy for the assessment of fibrosis in chronic hepatitis C. Gastroenterology 2005;128(2):343-50.
20. de Ledinghen V, Douvin C, Kettaneh A, Ziol M, Roulot D, Marcellin P, et al. Diagnosis of hepatic fibrosis and cirrhosis by transient elastography in HIV/hepatitis C virus-coinfected patients. J Acquir Immune Defic Syndr 2006;41(2):175-9.
21. Mueller S, Millonig G, Sarovska L, Friedrich S, Reimann FM, Pritsch M, et al. Increased liver stiffness in alcoholic liver disease: differentiating fibrosis from steatohepatitis. World J Gastroenterol 2010;16(8):966-72.
22. Corpechot C, El Naggar A, Poujol-Robert A, Ziol M, Wendum D, Chazouilleres O, et al. Assessment of biliary fibrosis by transient elastography
20
in patients with PBC and PSC. Hepatology 2006;43(5):1118-24.
23. Wong VW, Vergniol J, Wong GL, Foucher J, Chan HL, Le Bail B, et al. Diagnosis of fibrosis and cirrhosis using liver stiffness measurement in nonalcoholic fatty liver disease. Hepatology 2010;51(2):454-62.
24. Mueller S, Sandrin L. Liver stiffness: a novel parameter for the diagnosis of liver disease. 2010.
25. Zheng S, Luo Y, Wang W, Xiao X. Analysis of the pathomorphology of the intra- and extrahepatic biliary system in biliary atresia. Eur J Pediatr Surg 2008;18(2):98-102.
26. Arena U, Vizzutti F, Corti G, Ambu S, Stasi C, Bresci S, et al. Acute viral hepatitis increases liver stiffness values measured by transient elastography. Hepatology 2008;47(2):380-4.
27. Fraquelli M, Rigamonti C, Casazza G, Conte D, Donato MF, Ronchi G, et al. Reproducibility of transient elastography in the evaluation of liver fibrosis in patients with chronic liver disease. Gut 2007;56(7):968-73.
28. Coco B, Oliveri F, Maina AM, Ciccorossi P, Sacco R, Colombatto P, et al. Transient elastography: a new surrogate marker of liver fibrosis influenced by major changes of transaminases. J Viral Hepat 2007;14(5):360-9.
29. Friedrich-Rust M, Wunder K, Kriener S, Sotoudeh F, Richter S, Bojunga J, et al. Liver fibrosis in viral hepatitis: noninvasive assessment with acoustic radiation force impulse imaging versus transient elastography. Radiology 2009;252(2):595-604.
30. Roulot D, Czernichow S, Le Clesiau H, Costes JL, Vergnaud AC, Beaugrand M. Liver stiffness values in apparently healthy subjects: influence of gender and metabolic syndrome. J Hepatol 2008;48(4):606-13.
31. Ohi R, Ibrahim M. Biliary atresia. Semin Pediatr Surg 1992;1(2):115-24.
32. Burgener FA, Gutierrez OH, Logsdon GA. Angiographic, hemodynamic, and histologic evaluation of portal hypertension and periportal
21
fibrosis induced in the dog by intraportal polyvinyl alcohol injections. Radiology 1982;143(2):379-85.
33. Uflacker R, Pariente DM. Angiographic findings in biliary atresia. Cardiovasc Intervent Radiol 2004;27(5):486-90.
34. Ho CW, Shioda K, Shirasaki K, Takahashi S, Tokimatsu S, Maeda K. The pathogenesis of biliary atresia: a morphological study of the hepatobiliary system and the hepatic artery. J Pediatr Gastroenterol Nutr 1993;16(1):53-60. 35. dos Santos JL, da Silveira TR, da Silva VD, Cerski CT, Wagner MB. Medial thickening of hepatic artery branches in biliary atresia. A morphometric study. J Pediatr Surg 2005;40(4):637-42.
36. Goyal N, Jain N, Rachapalli V, Cochlin DL, Robinson M. Non-invasive evaluation of liver cirrhosis using ultrasound. Clin Radiol 2009;64(11):1056-66.
37. Millonig G, Reimann FM, Friedrich S, Fonouni H, Mehrabi A, Buchler MW, et al. Extrahepatic cholestasis increases liver stiffness (FibroScan) irrespective of fibrosis. Hepatology 2008;48(5):1718-23.
22
ABSTRACT(IN KOREAN)
담도폐쇄증이
있는 영아에서 간섬유화 정도의 예측에 대한
Transient elastography와 초음파의 진단적 유용성 비교
<지도교수 김명준>
연세대학교
대학원 의학과
신나영
목적
: 담도폐쇄증으로 진단된 영아에서 간섬유화 정도의 예측에
Transient elastography (TE)와 triangular cord (TC)의 두께, 간동맥
직경
, 간문맥 직경을 포함한 초음파 소견의 진단적 유용성을
비교하고자
한다.
재료
및 방법: 2007년 4월부터 2010년 7월까지 수술이나 간
조직검사를
받기 전에 TE와 초음파 모두를 시행한 51명의 영아
중
, TE 시행 시 valid shot이 5번 미만이었던 4명을 제외한 47명
(남아 19명, 여아 28명; 중앙 나이값, 60일)의 담도폐쇄증 영아를
대상으로
하였다. 초음파에서 TC 두께와 간동맥 및 간문맥의
직경을
측정하였다. TE 측정치와 초음파 소견을 조직학적
간섬유화
분류법인 METAVIR 섬유화 단계[F0, 섬유화 없음
(0명); F1, 격막 형성 없는 문맥 섬유화 (1명); F2, 소수의 격막을
가진
문맥 섬유화 (27명); F3, 다수의 격막을 형성하였으나
간경화
소견 없음 (14명); 간경화 (5명)]와 비교하여, 각각의
진단적
가치를 평가하였다. TE의 일반 성인을 위한 탐촉자인 M
탐촉자와
, 소아에 맞게 제작된 S 탐촉자의 진단의 정확도도
비교하였다
.
결과
: TE
측정치만이 METAVIR 섬유화 단계와 통계학적으로 유의한 상관관계를 보였다 (r=0.63; p<0.001). 중증도 섬유화( ≥F 3)와23
간경화(F4)를 진단하는 데 있어 TE의 areas under the receiver operating characteristic curve (Az ) 값은 각각 0.86과 0.96이었고, 해당하는 결정값은 >9.6 kPa (민감도 89.5%/특이도 75%)와 >18.1 kPa (민감도 100%/특이도 90.5%) 였다. S 탐촉자 (100%)를 사용 시 TE의 성공률은 M 탐촉자 (77%)를 사용하였을 때 보다 유의하게 높았다 (p<0.001). TE의 두가지 탐촉자의 진단적 정확도는, 중증도 섬유화 (≥F 3) 진단시에는 S 탐촉자 (0.93)가 M 탐촉자 (0.85)에 비해 Az 값이 높았으나 통계적인 차이는 없었다. 간경화 (F4) 진단 시에는 S 및 M 탐촉자의 Az 값이 각각 0.94와 0.96으로 큰 차이를 보이지 않았다. 결론: 담도폐쇄증 영아에서 중증도 섬유화(≥F 3)와 간경화(F4)의 진단에 TE가 비침습적인 방법으로 유용하며, 소아에게 적합하게 고안된 S 탐촉자의 사용은 TE 의 성공률을 높일 수 있었다. 향후 TE의 정확도에 S 탐촉자가 어떠한 영향을 주는 지에 대한 연구가 필요하다.