저작자표시-비영리-변경금지 2.0 대한민국 이용자는 아래의 조건을 따르는 경우에 한하여 자유롭게 l 이 저작물을 복제, 배포, 전송, 전시, 공연 및 방송할 수 있습니다. 다음과 같은 조건을 따라야 합니다: l 귀하는, 이 저작물의 재이용이나 배포의 경우, 이 저작물에 적용된 이용허락조건 을 명확하게 나타내어야 합니다. l 저작권자로부터 별도의 허가를 받으면 이러한 조건들은 적용되지 않습니다. 저작권법에 따른 이용자의 권리는 위의 내용에 의하여 영향을 받지 않습니다. 이것은 이용허락규약(Legal Code)을 이해하기 쉽게 요약한 것입니다. Disclaimer 저작자표시. 귀하는 원저작자를 표시하여야 합니다. 비영리. 귀하는 이 저작물을 영리 목적으로 이용할 수 없습니다. 변경금지. 귀하는 이 저작물을 개작, 변형 또는 가공할 수 없습니다.
A DISSERTATION
FOR THE DEGREE OF MASTER OF SCIENCE
Effects of dietary supplementation of two types of
propolis on growth performance, feed utilization, innate
immunity and disease resistance of olive flounder
Paralichthys olivaceus.
G.L. Buddhi Eranga Gunathilaka
Department of Marine Life Science
GRADUATE SCHOOL
JEJU NATIONAL UNIVERSITY
Effects of dietary supplementation of two types of propolis on
growth performance, feed utilization, innate immunity and disease
resistance of olive flounder Paralichthys olivaceus
G.L. Buddhi Eranga Gunathilaka
(Supervised by professor Kyeong-Jun Lee)
A dissertation submitted in partial fulfilment for the degree MASTER OF SCIENCE
2016
The dissertation has been examined and approved by
……….. Lee Kyeong-Jun, Prof. of Marine Life Science
……….. Choi Kwang-Sik, Prof. of Marine Life Science
……….. Lee Bong-Joo, Dr. of Marine Life Science
2016. 02
Department of Marine Life Science GRADUATE SCHOOL JEJU NATIONAL UNIVERSITY
i
국문 초록
이 연구는 사료 내 프로폴리스를 분말 또는 액상 형태로 첨가하여 넙치 치어의 성장, 사료효율, 비특이적 면역력, 질병저항성에 미치는 영향을 평가하기 위하여 수행되었다. 두 번의 사양실험에서 실험사료는 어분에 기초하여 제작되었고, 대조구와 7 개의 다른 실험구에 각 프로폴리스 분말을 0.25%, 0.5%, 0.75%, 1%씩 첨가하고, 액상형태로는 0.25%, 0.5%, 1%씩 첨가하여 제작하였다 (Control, P0.25, P0.5, P0.75, P1, L0.25, L0.5, L1). 실험 I 에서는 평균 30 g 의 넙치 치어를 대상으로 4 주갂 만복급이 하였다. 사양실험 기갂 동안 성장률과 사료효율에는 젂 실험구에서 유의적인 차이가 없었으나, 비특이적 면역력에 있어서는 P1 실험구와 L0.5 실험구가 유의적으로 높게 나타났다. 특히 P1 실험구는 다른 시험구와 비교하였을 때, Anti-Protease 분석에서 유의적으로 가장 높은 수치를 나타내었다. 실험 II 에서는 8.94 g 의 넙치를 이용하여 실험 I 과 동일핚 사료를 8 주갂 만복급이 하였다. 성장률과 사료효율에서는 유의적인 차이가 나타나지 않았다. 혈액학적 분석에서 hemoglobin 의 수치가 액상 형태로 첨가핚 사료를 섭이핚 그룹이 대조구에 비하여 유의적으로 높은 결과를 보였다. 사양실험 종료 후 15 마리의 넙치 치어를 대상으로 Streptococcus iniae 와 Hemorrhagic septicemiaii virus 를 주입하여 공격실험을 진행하였다. 공격실험 결과 대조구가 생존율이 가장 낮았으며, P0.75 실험구가 가장 높은 생존율을 나타내었다. 실험 I, II 의 결과, 사료 내 분말 또는 액상 형태의 프로폴리스 첨가는 넙치 치어의 비특이적 면역력, 질병저항성을 증가 시킬 수 있을 것이라 사료된다. 따라서, 넙치 사료 내 프로폴리스의 적정 첨가량은 0.75% 분말 형태인 것으로 판단된다.
iii
Abstract
These studies were conducted on the purpose of investigation the effects of dietary supplementation of two types (powder or liquid) of propolis on innate immunity and disease resistance of olive flounder Paralichthys olivaceus. For both experiments, a fish meal based diet was formulated and regarded as a control and seven other experimental diets were prepared by dietary supplementation of propolis at levels of 0.25, 0.5, 0.75 and 1 % of powder (P) form and 0.25, 0.5 and 1 % of liquid (L) form (designated as control, P0.25, P0.5, P0.75, P1, L0.25, L0.5 and L1).
In Exp-I, A total of 600 fish averaging 30 g were randomly distributed into 24 tanks in group of 25, and three tanks was assigned to one of eight experimental diets. At the end of the feeding trial, lysozyme and myeloperoxidase activities and total immunoglobulin level were significantly higher in fish fed P1 and L0.5 diets. P1 diet showed a significant increment in anti-protease activity compared to the control diet. Those results indicate that non-specific immune responses of olive flounder can be enhanced by dietary supplementation of powder and/or liquid forms of propolis and its optimum level would be 1% in powder form or 0.5% in liquid form. It seemed that growth performance and feed utilization are not affected by the propolis in olive flounder.
In Exp-II, A total of 1080 fish averaging 8.94 ± 0.02 g were randomly distributed into 24 tanks in group of 45, and each tank was assigned to one of three replicates of eight diets. At the end of the feeding trial, Growth performances of fish were not affected by dietary supplementation of propolis. Whereas, the hemoglobin amount of propolis liquid containing diet fed groups were significantly higher than the control groups. After challenge with Streptococcus iniae and viral hemorrhagic septicemia virus, highest disease resistance was observed in PP 0.75 diet fed groups and the control group obtained a
iv
significantly lower survival rate than all other treatments. Therefore, it seems like, disease resistance of juvenile olive flounder can be enhanced by dietary supplementation of powder and/or liquid forms of propolis and the optimum level of propolis supplementation for juvenile olive flounder would be 0.75% in powder form.
v
Dedication
This thesis is dedicated to
EVERYONE
who supported me
throughout the process and shares
their invaluable and irreplaceable
experience towards successful final result.
Without their support,
I could not have completed
vi
Acknowledgement
I would like to acknowledge the inspirational instruction and guidance of Dr Lee Kyeong-Jun as my advisor throughout the time it took me to complete this research work. He has been ideal advisor and motivator.
I would also like to express my sincere gratitude to fellows who are studying and studied at fish feed and nutrition lab, Department of marine life science, Jeju National University. Especially, my thank goes to Dr. Oh Dae-Han and Dr. Sanaz Khoshravi for their immeasurable support.
I am grateful to the members of my dissertation committee; (Prof. Lee Kyeong-Jun, Prof. Choi Kwang-Sik and Dr. Lee Bong-Joo; they have generously given their time and expertise to better my work.
vii
Table of content
Abstract i
Dedication v
Acknowledgement vi
List of table viii
List of figure ix
1. Introduction………...1
1.1. Immunostimulants 1.2. Propolis 1.3. Potential use of propolis in aquaculture 1.4. Olive flounder 2. Experiment I……….4
2.1. Materials and methods 2.2. Results 2.3. Discussion 3. Experiment II……….………21
3.1. Materials and methods 3.2. Results 3.3. Discussion 4. Conclusion.………36
viii
List of tables
Table Page
Table 1. Formulation of the basal diet (% dry matter).
12 Table 2. Growth performance of olive flounder Paralichthys olivaceus (Initial body
weight, 30 g) fed the eight experimental diets for 4 weeks.
13
Table 3. Blood parameters of olive flounder Paralichthys olivaceus fed the eight experimental diets for 4 weeks.
14
Table 4. Growth performance of olive flounder fed the eight experimental diets for 8 weeks.
28
Table 5. Blood parameters of olive flounder fed the eight experimental diets for 8 weeks.
29
Table 6. Non-specific immune responses of olive flounder fed the eight experimental diets for 8 weeks.
ix
List of figures
.
Figure Page
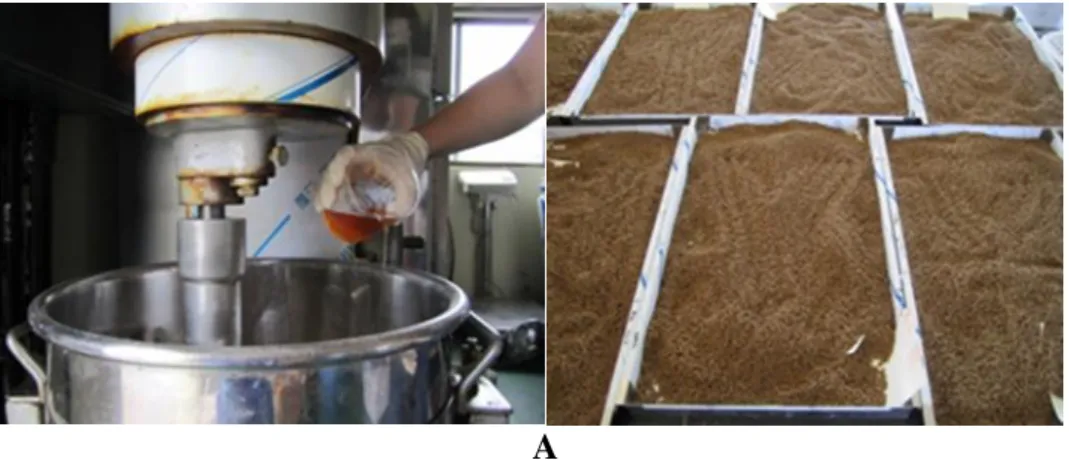
Figure 1. Preparation of experimental diets for four weeks feeding trial (A) and
experimental fish (B) 9
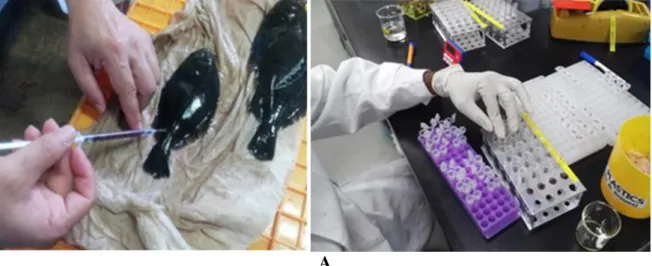
Figure 2. Blood sample collection, analysing in laboratory (A) and challenge
experiment (B) 10
Figure 3. Non-specific immune responses of olive flounder fed the eight experimental
diets for 4 weeks 13
Figure 4. Survival rate of olive flounder fed the eight experimental diets after the challenge with Edwerdsiella tarda.
14
Figure 5. Preparation of experimental diets (A), experimental fish (B) and challenge experiment in quarantine room (C)
26
Figure 6. Cumulative mortality of olive flounder fed the eight experimental
diets after challenge with VHS (A) and Streptococcus iniae (B) by injection
1
1. Introduction
1.1 Immunostimulants
Immunostimulants are chemical, drugs, stressor or an action; those can directly interact with cell of immune system and enhance the immunity against any kind of disease infection such as viruses, bacteria, fungi and parasites. Also, it has been suggested, administration of Immunostimulants may accelerate the defence mechanisms against infections to provide protection. Therefore, Immunostimulants have been being used in animal industry and aquaculture sector to improve disease resistance and general performance of animals. With the dramatic increase of the fish culture productions in the world (FAO, 2014), infectious diseases such as bacterial and viral diseases have become a highly cost threat in the aquaculture. Even though antibiotics are useful to control many bacterial diseases, there are many problems related with raised antibiotic resistant strains. Aquaculturists have been trying to use immunostimulants which are known to enhance the innate immunity by interacting directly with cells of the system, especially via diets as feed supplements (Galindo and Hosokawa et al., 2004). Recently, non-nutritional origin immunostimulant has been identified as a good choice to induce disease resistance of fishes compared to those in other forms.
1.2 Propolis
Propolis is a resinous material produced by bees using exudates of plants which are mixed with products of their salivary gland and wax. Khalil (2006) reported that more than 300 constituents exist in different types of propolis. Flavonoids, phenolids and various
2
aromatic compounds can be found as main chemical classes among the chemical composition of propolis (Bankova et al., 2000; Kolankaya et al., 2002). Even though the composition of propolis varies with the source, it contains a number of B complex vitamins and major and trace minerals (Burdock 1998). It has been used as a medicine since ancient times as it is comprised with many biological properties such as antimicrobial, antifungal, antiprotozoal, antiviral, antioxidative and antiulcer properties (Burdock 1998; Park et al., 1998; Alberto et al., 2005; Chu 2006; Cuesta et al., 2007). Several studies have previously reported immunostimulatory and anti-inflammatory effect of propolis in mammals (Zhang et al., 2009; Talas and Gulhan et al., 2009).
1.3 Potential use of propolis in aquaculture
Propolis has been reported to have an important effect on aquatic environment (Christybapita et al., 2007). As an immunostimulant, it has been used successfully via manipulation of feed. According to previous studies, non-specific immune responses and disease resistance of Nile tilapia enhanced through dietary supplementation (Abd-el-Rhaman et al., 2009). Physiological functions of fishes can be boosted by propolis and it may improve the health of fish consumers as well (Talas and Gulhan et al., 2009). Also, it has ability to alleviate oxidative stress and minimise the effects of immunosuppressive chemical compounds in fish, after both or either intraperitoneal administration or dietary intake (Cuesta et al 2005; Yonar et al 2011).
1.4 Olive flounder
South Korea is the top global producer of olive flounder where the production exceeds 60% of annual production of cultured fish (Bai and Kim, 2001). However,
3
diseases have become a huge problem which attracts the researcher’s attention towards the improvement of innate immunity of fish via feed formulations. It can be an important strategy to increase the productivity by suppressing diseases via non-specific defence mechanisms of fishes activated by the immunostimulants and thereby providing protections against fish pathogens (Siwicki et al., 1994).
Therefore, the purpose of these studies is to investigate the effects of different dietary supplementation levels of either powder or liquid forms of propolis on growth performance, feed utilization, non-specific immune responses and disease resistant against
4
2. Experiment I
2.1 Material and methods
Experimental diets
Eight experimental diets were formulated to be isonitrogenous (46% crude protein) and isocaloric (17.1 kJ/g). A fish meal based diet was formulated and regarded as a control and seven other experimental diets were prepared by dietary supplementaion of propolis at levels of 0.25, 0.5, 0.75 and 1 % of powder (P) form and 0.25, 0.5 and 1 % of liquid (L) form (designated as control, P0.25, P0.5, P0.75, P1, L0.25, L0.5 and L1). All dry ingredients were thoroughly mixed with fish oil and 20-30 % double distilled water. Then the mixed dough was extruded through a pellet machine. The pellets were subsequently dried in 25 ºCand stored at –20 ºC until use. Dietary formulation of the basal diet is given in Table 1 and the propolis was added in the basal diet in the expense of cellulose.
Preparation of propolis powder and liquid
A pure propolis of 20 g was dissolved in 1000 ml of 95% ethanol and incubated in 60 ºC for 3h. The solution was filtered through a 0.5 µm filter paper and then 95% purified propolis was extracted by drying, ground and mixed with 5% maltodextrin for the powder propolis. For the liquid one, after drying the alcohol in the extract process, water was added into the dried filtered-extract to be used as dietary supplement. The total flavonoids concentration of the final propolis in powder or liquid forms was analyzed to have 2.0% or higher.
5
Fish and feeding trial
Olive flounder were transported from a private hatchery (Dong-Won Fisheries, Seogwipo, Jeju Island, Korea) to the Marine Science Institute, Jeju National University, Jeju, South Korea. Fish were fed a commercial diet for 2 weeks to be acclimatized to the experimental condition and facilities. At the end of the acclimated period 600 fish (initial mean body weight, 30g) were randomly distributed into 24 polyvinyl circular tanks at the density of 25 fish per tank. Each tank was supplied with filtered sea water and aerattion to maintain sufficient dissolved oxygen. Triplicate groups of fish were fed one of the experimental diets twice a day (09:00h and 18:00h) to apparent satiation for 4 weeks. Fish growth performance was measured every 2 weeks. Feeding was stopped 24h prior to weighting to minimize fish stress.
Sample collection and analyses
At the end of the feeding trial, all the fish from each tank were bulk weighted to obtain total biomass. Three fish from each tank were randomly selected and, anesthetized with 2-Phenoxyethanol solution (200 ppm) and blood samples were collected from caudal vein with heparinized syringes for determination of hematocrit and hemoglobin level. Then plasma were separated by centrifugation at 5,000 g for 10 min and stored at –70oC for determination of total immunoglobulin level (Ig). Another set of blood samples were taken from the caudal vein of three fish from each tank using non heparinized syringes. The collected blood was allowed to clot at room temperature for 30 min and the serum was separated by centrifugation at 5,000 g for 10 min and stored at –70ºC for non-specific
6
immune response analyses including lysozyme, superoxide dismutase (SOD), anti-protease and myeloperoxidase (MPO).
Hematocrit was determined by microhematocrit technique described by Brown (1980) and hemoglobin was determined by using an automated blood analyzer (SLIM, SEAC Inc., Florence, Italy).
Serum lysozyme level was measured using turbidometric assay (Hultmark, 1980) with slight modification. Briefly, Micrococcus lysodeikticus (0.75 mg mL-1) was suspended in sodium phosphate buffer (0.1 M, pH 6.4). Then, 200 µL of suspension was placed in each well of 96-well plates and 20 µL of serum was added subsequently. The reduction in absorbance of samples was recorded at 570 nm after incubation at room temperature for 0 and 30 min in a microplate reader. Hen egg white lysozyme (Sigma) was used as standard. The values were expressed as µg mL-1.
Serum MPO activity was measured according to Quade and Roth (1997). Briefly, 20 µL of serum was diluted with HBSS (Hanks Balanced Salt Solution) without Ca2+ or Mg2+ (Sigma, USA) in 96-well plates. Then, 35 µL of 3,3’,5,5’-tetramethylbenzidine hydrochloride (TMB, 20 mM) (Sigma, USA) and H2O2 (5 mM) were added. The color
change reaction was stopped after 2 min by adding 35 µL of 4 M sulphuric acid. Finally, the optical density was read at 450 nm in a microplate reader.
SOD activity was measured by the percentage reaction inhibition rate of enzyme with WST-1 (Water Soluble Tetrazolium dye) substrate and xanthine oxidase using a SOD Assay Kit (Sigma, 19160) according to the manufacturer's instructions. Each endpoint assay was monitored by absorbance at 450 nm (the absorbance wavelength for the colored
7
product of WST-1 reaction with superoxide) after 20 min of reaction time at 37°C. The percent inhibition was normalized by mg protein and presented as SOD activity units.
The serum anti-protease activity was measured according to the method described by Ellis (1990) with slight modifications (Magnadóttir et al., 1999). Briefly, 20 µL of serum was incubated with 20 μL of standard trypsin solution (Type II-S, from porcine pancreas, 5 mg mL-1, Sigma-Aldrich) for 10 min at 22°C. Then, 200 μL of phosphate buffer (0.1 M, pH 7.0) and 250 μL azocasein (2%) (Sigma-Aldrich) were added and incubated for 1 h at 22°C. Five hundred microliter of trichloro acetic acid (10%) (TCA) was added and further incubated for 30 min at 22°C. The mixture was centrifuged at 6,000
g for 5 min and 100 μL of the supernatant was transferred to the wells of a 96 well flat
bottomed microplate containing 100 μL of NaOH (1 N). Optical density was read at 430 nm. For a 100% positive control, buffer was replaced for serum, while for the negative control; buffer replaced both serum and trypsin. The trypsin inhibition percentage was calculated using the following equation:
Trypsin inhibition (%) = (A1 – A2/A1) × 100 where A1 = control trypsin activity (without
serum); A2 = activity of trypsin remained after serum addition.
Plasma total Ig levels were determined according to the method described by Siwicki and Anderson (1993). Briefly, plasma total protein content was measured using a micro protein determination method (C-690; Sigma), prior to and after precipitating down the immunoglobulin molecules, using a 12% solution of polyethylene glycol (Sigma) where the difference in protein content represents the Ig content.
8
Challenge test
At the end of the feeding trial, 15 fish from each tank were randomly captured and injected intraperitoneally with E. tarda suspension containing 1×10⁵ CFU mL-1. E. tarda
(ATCC 15947, Korea Collection for Type Cultures) was used as the pathogenic agent (provided by the Marine Microbiology Laboratory of Jeju National University). The bacterium, originally isolated from diseased olive flounder, was cultured in 10 mL BHI broth (Difco, Detroit, MI, USA) with 1.5% NaCl and incubated with shaking for 24 h at 37°C. Bacterial growth was measured at an optical density of 700 nm followed by plate counting in BHI-NaCl. The isolated bacteria were identified using the API 20E commercial identification kit (bioMérieux, Marcy l'Etoile, France) After injection, the fish were distributed into plastic tanks of 65 L capacity and their mortality was monitored and recorded for 6 days.
Statistical analysis
All the treatments were assigned using a completely randomized design. Data were analyzed by one-way analysis of variance (ANOVA) using SPSS version 11.0 (SPSS Inc., Chicago, IL, USA). When the anova identified differences among groups, the differences in means were identified with Tukey’s HSD multiple range test. Statistical significance was determined at P < 0.05 and data are presented as mean ± SD.
9
A
B
Figure 1. Preparation of experimental diets for four weeks feeding trial (A) and
10
A
B
Figure 2. Blood sample collection, analysing in laboratory (A) and challenge experiment
11
2.2 Results
The growth performance and feed utilization of fish were not significantly affected by the dietary treatment (Table 2). No significant differences were found in hematological parameters of fish fed the experimental diets (Table 3). However, numerically higher hematocrit and hemoglobin values were detected in fish fed the L0.5 diet.
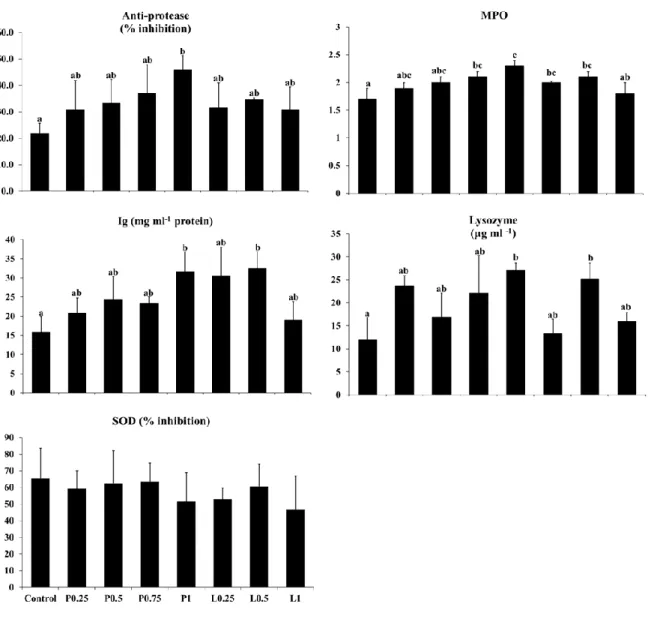
The non-specific immune response of fish fed the diets was provided in Figure 1. Dietary supplementation of the propolis at the level of 0.75 and 1% in powder form and 0.25 and 0.5% in liquid form resulted in significantly higher MPO activity compared to the control group. Significantly higher lysozyme activity and Ig level were found in fish fed the P1 and L0.5 diets than in fish fed the control diet. Anti-protease activity was significantly higher in fish fed P1 diet than those fed the control diet. However, SOD activity was not significantly different among all the treatments.
During the challenge test, the first dramatic mortality was observed on the third day after injection. Even though, fish fed the L0.5 diet showed slightly higher disease resistance than the control group, the difference was not significant.
12
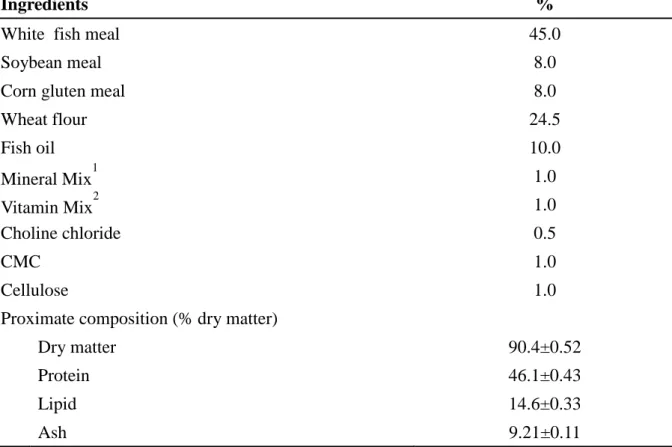
Table 1. Formulation of the basal diet (% dry matter)
Ingredients %
White fish meal 45.0
Soybean meal 8.0
Corn gluten meal 8.0
Wheat flour 24.5 Fish oil 10.0 Mineral Mix1 1.0 Vitamin Mix2 1.0 Choline chloride 0.5 CMC 1.0 Cellulose 1.0
Proximate composition (% dry matter)
Dry matter 90.4±0.52
Protein 46.1±0.43
Lipid 14.6±0.33
Ash 9.21±0.11
1
Mineral premix (g kg–1 of mixture): MgSO4.7H2O, 80.0; NaH2PO4.2H2O, 370.0; KCl,
130.0; Ferric citrate, 40.0; ZnSO4.7H2O, 20.0; Ca-lactate, 356.5; CuCl2, 0.2; AlCl3. 6H2O,
0.15; Na2Se2O3, 0.01; MnSO4.H2O, 2.0; CoCl2.6H2O, 1.0. 2
Vitamin premix (g kg–1 of mixture): L-ascorbic acid, 121.2; DL-α tocopheryl acetate, 18.8; thiamin hydrochloride, 2.7; riboflavin, 9.1; pyridoxine hydrochloride, 1.8; niacin, 36.4; Ca-D-pantothenate, 12.7; myo-inositol, 181.8; D-biotin, 0.27; folic acid, 0.68; p-aminobezoic acid, 18.2; menadione, 1.8; retinyl acetate, 0.73; cholecalficerol, 0.003; cyanocobalamin, 0.003.
13
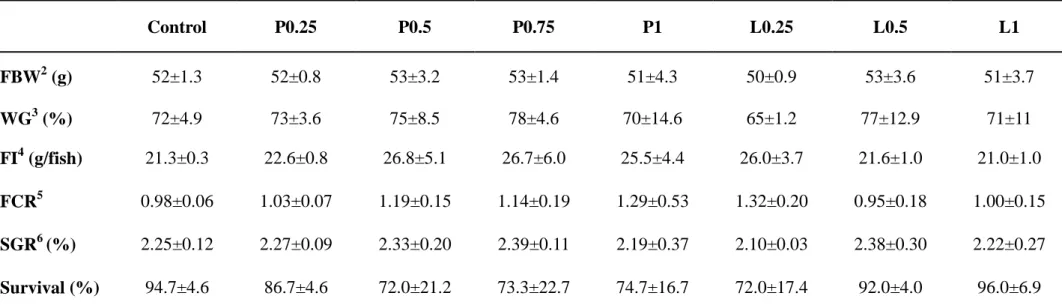
Table 2. Growth performance of olive flounder Paralichthys olivaceus (Initial body weight, 30 g) fed the eight experimental diets for 4
weeks1
1
Values are presented as mean ± SD. Values having different superscript letters in the same colomn are significantly different (P < 0.05) between groups: Control, 0% propolis; P0.25, 0.25 % propolis powder; P0.5, 0.5% propolis powder; P0.75, 0.75% propolis powder; P1, 1% propolis powder; L0.25, 0.25% propolis liquid; L0.5, 0.5% propolis liquid; L1, 1% propolis liquid.
2
FBW: final body weight
3
Weight gain (%) = 100× (final mean body weight – initial mean body weight) / initial mean body weight
4
Feed intake = dry feed consumed (g) / fish
5
Feed conversion ratio = feed intake (g) / weight gain (g)
6
SGR (%/day) = 100 × (In final body weight (g) – In initial body weight (g)) / experimental period (day)
Control P0.25 P0.5 P0.75 P1 L0.25 L0.5 L1 FBW2 (g) 52±1.3 52±0.8 53±3.2 53±1.4 51±4.3 50±0.9 53±3.6 51±3.7 WG3 (%) 72±4.9 73±3.6 75±8.5 78±4.6 70±14.6 65±1.2 77±12.9 71±11 FI4 (g/fish) 21.3±0.3 22.6±0.8 26.8±5.1 26.7±6.0 25.5±4.4 26.0±3.7 21.6±1.0 21.0±1.0 FCR5 0.98±0.06 1.03±0.07 1.19±0.15 1.14±0.19 1.29±0.53 1.32±0.20 0.95±0.18 1.00±0.15 SGR6 (%) 2.25±0.12 2.27±0.09 2.33±0.20 2.39±0.11 2.19±0.37 2.10±0.03 2.38±0.30 2.22±0.27 Survival (%) 94.7±4.6 86.7±4.6 72.0±21.2 73.3±22.7 74.7±16.7 72.0±17.4 92.0±4.0 96.0±6.9
14
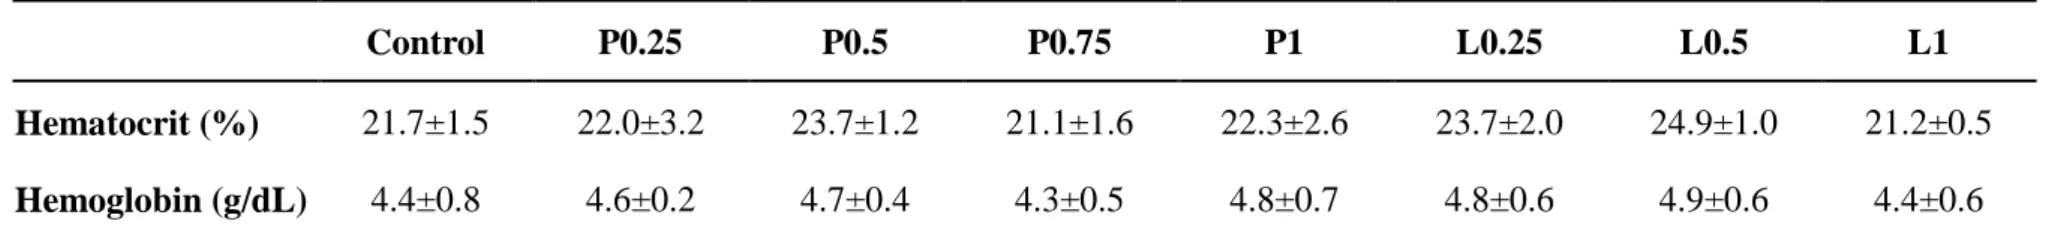
Table 3. Blood parameters of olive flounder Paralichthys olivaceus fed the eight experimental diets for 4 weeks1
Control P0.25 P0.5 P0.75 P1 L0.25 L0.5 L1 Hematocrit (%) 21.7±1.5 22.0±3.2 23.7±1.2 21.1±1.6 22.3±2.6 23.7±2.0 24.9±1.0 21.2±0.5
Hemoglobin (g/dL) 4.4±0.8 4.6±0.2 4.7±0.4 4.3±0.5 4.8±0.7 4.8±0.6 4.9±0.6 4.4±0.6
1
Values are presented as mean ± SD. Values having different superscript letters in the same colomn are significantly different (P < 0.05) between groups: Control, 0% propolis; P0.25, 0.25 % propolis powder; P0.5, 0.5% propolis powder; P0.75, 0.75% propolis powder; P1, 1% propolis powder; L0.25, 0.25% propolis liquid; L0.5, 0.5% propolis liquid; L1, 1% propolis liquid.
15
Figure 3. Non-specific immune responses of olive flounder fed the eight experimental diets
for 4 weeks. Different letters on the bars indicates significant difference (P < 0.05) between groups: Control, 0% propolis; P0.25, 0.25 % propolis powder; P0.5, 0.5% propolis powder; P0.75, 0.75% propolis powder; P1, 1% propolis powder; L0.25, 0.25% propolis liquid; L0.5, 0.5% propolis liquid; L1, 1% propolis liquid.
16
Figure. 4. Survival rate of olive flounder after the challenge with Edwerdsiella tarda: Control, 0% propolis; P0.25, 0.25 % propolis powder; P0.5, 0.5% propolis powder; P0.75, 0.75% propolis powder; P1, 1% propolis powder; L0.25, 0.25% propolis liquid; L0.5, 0.5% propolis liquid; L1, 1% propolis liquid.
17
2.3 Discussion
A significant enhancement in growth performance of juvenile rainbow trout (Deng et al., 2011) and Nile tilapia (Abd-El-Rhman et al., 2009; Abbass et al., 2012) has been observed by dietary supplementation of propolis. Further, Bae et al (2012) suggested that dietary crude propolis level for optimum growth of juvenile eel (Anguilla japonica) could be lower than the level for optimum immune responses and their conclusion was 0.25% - 0.5% in diet for optimum growth and feed efficiency. Even though, we have used similar doses to Bae et al (2012) and Abd-El-Rhman et al (2009), dietary supplementation of propolis showed no significant effect on growth performance and feed utilization of juvenile olive flounder fed different levels of propolis for 4 weeks. In accordance with the present results, specific growth rate of gilthead sea bream was not significantly affected by the dietary intake of propolis at 0.1 and 10 g propolis kg-1 diet (Cuesta et al. 2005). Despite the limited evidence, it seems that the effectiveness of the propolis in fish growth performance and feed efficiency may relate to the type of the propolis product and the fish species. Hence, further investigation is required to investigate the exact effect of propolis products in different forms as their contents and compositions may alter according to their source and manufacturing procedure.
In the present study, hemoglobin and hematocrit values were not significantly affected by propolis supplementation. Dietary supplementation of propolis at 2% and 4% significantly decreased the hemoglobin level of juvenile eel (Bae et al., 2012). Yonar et al. (2012) found that oral intake of propolis can significantly increase the leucocyte counts of juvenile common carp compared to that of fish fed the control diet (no supplementation). However, their experiment was to evaluate the effects of propolis on chlorpyrifos-induced change in hematological parameters of common carp and they suggested that propolis
18
might help the fish to combat the stress resulted from exposing to toxic material such as chlorpyrifos.
MPO is an enzyme that produces hypochlorous acid from oxidative radicals to destroy bacteria and pathogens and it is mostly released by the azurophilic granules of neutrophils during oxidative respiratory burst (Heinecke et al., 1993; Dalmo et al., 1997; Das et al., 2013). Unfortunately, there are no previous reports available regarding the effects of propolis on MPO activity of olive flounder. However, in the present study, MPO activity of olive flounder fed propolis powder or liquid forms was significantly higher than that of the control group and highest significant difference was observed in 1% propolis powder fed group.
Serum lysozyme activity is mostly used to measure the innate immune responses in fish and it is one of the defensive factors against invasion by microorganisms (Galindo et al., 2003). Lysozyme is a hydrolytic enzyme that restricts bacterial growth by attacking peptidoglycan of bacterial cell wall and enhances the immune response of animals including fish. Ig is a protein produced by plasma B-cells and it has ability to recognize and neutralize foreign objects (Litman et al., 1993; Solem and Stenvik, 2006). In addition, there are five types of Ig that have been identified in fish immune system (Vesely et al., 2006). In the present study, significantly higher serum lysozyme activity and plasma Ig were observed in fish fed 1% propolis in powder form and 0.5% propolis in liquid form. Similar to this result, Bae et al. (2012) found that 1% propolis supplementation improves the serum and mucus lysozyme level of Anguila japonica but more than 1% supplementation decreases the lysozyme activity of eel. Furthermore, ethanolic-extract and crude propolis significantly increased the serum lysozyme activity of Nile tilapia (Abd-El-Rhman et al., 2009) and lysozyme activity of Chinese sucker has been increased by dietary
19
supplementation of mixture of propolis and herba epimedii extract (Zhang et al., 2009). Also, plasma Ig level of rainbow trout was significantly increased by oral administration of propolis (Yonar et al., 2011). Moreover, propolis stimulated Ig production in rats regardless of season and origin (Sforcin 2005, 2007) and an ethanol extract of propolis increased Ig production of mice (Scheller et al., 1988).
Anti-protease is an enzyme inhibitor in the serum and it may play an important role in the defence against bacteria (Ellis 2001). Furthermore, propolis has ability to inhibit the action of protease enzyme of bacteria (Bulman et al., 2011). In the present study, significantly higher anti-protease activity was obtained by fish group fed the 1% of propolis powder than control group.
SOD activity of plasma, liver and kidney was not significantly increased by dietary supplementation of ethanolic-extract of propolis in rainbow trout (Yonar et al., 2011). Likewise, no significant difference was observed in serum SOD activity of fish fed the experimental diets in the present study.
Bae et al. (2012) indicates that higher propolis supplementation can cause a reduction of innate immunity in Japanese eel. Also, reductions of some immune parameters have been observed in Nile tilapia (Abd-El-Rhman, 2009; Dotta et al., 2014). Burdock (1998) also reported a toxic effect by the high level propolis supplementation in rabbits and mice. However, in the present study, no toxic effect was found in the fish fed up to 1.0% propolis in diet. Further study is needed to clearly verify any toxic effects in fishes by high level of dietary propolis supplementation.
According to the results of the challenge test, even though numerically higher survival rate was observed in 0.5% propolis liquid form than other diets, the result was not
20
significant in this study. The challenged fish died so quickly that we could not detect any significant difference in the groups, even though we injected the fish with proper dose of the pathogen following suggested doses from the previous studies. It seems that the bacteria dose was too high in this case. Therefore, further researches are required to determine the effects of dietary supplementation of propolis on disease resistance of olive flounder against E. tarda.
In conclusion, non-specific immune responses of olive flounder can be enhanced by dietary supplementation of propolis and its optimum level is likely to be approximately 1% in powder form or 0.5% in liquid form in diets for olive flounder. However, it seemed that growth performance and feed utilization are not affected by the propolis in olive flounder.
21
3. Experiment II
3.1 Material and methods
Experimental diets
Eight experimental diets were formulated to be isonitrogenous (46% crude protein) and isocaloric (17.1 kJ/g). A fish meal based diet was formulated and regarded as a control and seven other experimental diets were prepared by dietary supplementaion of propolis at levels of 0.25, 0.5, 0.75 and 1 % of powder (P) form and 0.25, 0.5 and 1 % of liquid (L) form (designated as control, P0.25, P0.5, P0.75, P1, L0.25, L0.5 and L1). All dry ingredients were thoroughly mixed with fish oil and 20-30 % double distilled water. Then the mixed dough was extruded through a pellet machine. The pellets were subsequently dried in 25 ºCand stored at –20 ºC until use. Dietary formulation of the basal diet is given in Table 1 and the propolis was added in the basal diet in the expense of cellulose.
Preparation of propolis powder and liquid
A pure propolis of 20 g was dissolved in 1000 ml of 95% ethanol and incubated in 60 ºC for 3h. The solution was filtered through a 0.5 µm filter paper and then 95% purified propolis was extracted by drying, ground and mixed with 5% maltodextrin for the powder propolis. For the liquid one, after drying the alcohol in the extract process, water was added into the dried filtered-extract to be used as dietary supplement. The total flavonoids concentration of the final propolis in powder or liquid forms was analyzed to have 2.0% or higher.
22
Fish and feeding trial
Olive flounders were transported from private hatchery (Dong-Won Fisheries, Seogwipo, Jeju Island, Korea) to the Marine and environmental research institute, Jeju National University, Jeju, Korea. All fish were acclimatized under experimental condition and facilities for two weeks feeding commercial diet. 1080 fish (initial mean weight: 8.94 ± 0.02 g) were randomly distributed among 24 polyvinyl circular tanks of 150L capacity (45 fish / tank). Each tank was randomly assigned to one of three replicates of 8 dietary treatments and supplied with sand filtered sea water at a flow-rate of 2-3 L min-1 and aerated by sandstone to maintain sufficient dissolved oxygen. A photoperiod of 12 h light and 12 h dark was used. The average water temperature during the experiment was dependent on the natural temperature (18-23ºC). Fish were fed the experimental diets twice a day (09.00am and 18.00pm) until satiation for 4 weeks. Growths of fish were measured after 2 weeks. Feeding was stopped 24 hour prior to weighting to minimize stress.
Sample collecting and analyses
At the end of the feeding trial, all the fish from each tank collectively weighted to obtain total biomass. Three fish from each tank were randomly selected, anesthetized with 2-Phenoxy methanol solution and blood was collected from caudal vein with heparinized syringes for determine NBT activity, haematocrit (Hc) and haemoglobin (Hb).
Another set of blood samples were taken from the caudal vein of four fish from each tank using non heparinized syringes, allowed to clot at room temperature for 30 min and the serum was separated by centrifugation for 10 min at 5000×g and stored at -70 c for
23
analysis of innate immune response parameters including lysozyme, superoxide dismutase (SOD), anti-protiase and myeloperoxidase (MPO).
The oxidative radical production by phagocytes during respiratory burst was measured through NBT assay described by Anderson and Siwicki (1994). Briefly, blood and nitro-blue-tetrazolium (0.2%) (NBT; Sigma, USA) were mixed in equal proportion (1:1), incubated for 30 min at room temperature, then 50 µl was taken out and dispensed into glass tubes. Then, 1 ml of dimethylformamide (Sigma, USA) was added and centrifuged at 2000×g for 5 min. Finally, the optical density of supernatant was measured at 540 nm using spectrophotometer. Dimethylformamide was used as blank.
Hematocrit was determined by microhematocrit technique described by Brown (1980) and hemoglobin was determined by using an automated blood analyzer (SLIM, SEAC Inc., Florence, Italy).
Serum lysozyme level was measured using turbidometric assay through the method described by Hultmark (1980) with slight modification. Briefly, Micrococcus lysodeikticus (0.75 mg ml-1) was suspended in sodium phosphate buffer (0.1 M, pH 6.4). Then, 200 µl of suspension was placed in each well of 96-well plates and 20 µl of serum was added subsequently. The reduction in absorbance of samples was recorded at 570 nm after incubation at room temperature for 0 and 30 min in a microplate reader. Hen egg white lysozyme (Sigma) was used as standard. The values were expressed as µg ml-1.
Serum MPO activity was measured according to Quade and Roth (1997). Briefly, 20 µl of serum was diluted with HBSS (Hanks Balanced Salt Solution) without Ca2+ or Mg2+ (Sigma, USA) in 96-well plates. Then, 35 µl of 3,3’,5,5’-tetramethylbenzidine hydrochloride (TMB, 20 mM) (Sigma, USA) and H2O2 (5 mM) were added. The color
24
change reaction was stopped after 2 min by adding 35 µl of 4 M sulphuric acid. Finally, the optical density was read at 450 nm in a microplate reader.
SOD activity was measured by the percentage reaction inhibition rate of enzyme with WST-1 (Water Soluble Tetrazolium dye) substrate and xanthine oxidase using a SOD Assay Kit (Sigma, 19160) according to the manufacturer's instructions. Each endpoint assay was monitored by absorbance at 450 nm (the absorbance wavelength for the colored product of WST-1 reaction with superoxide) after 20 min of reaction time at 37 °C. The percent inhibition was normalized by mg protein and presented as SOD activity units.
The serum anti-protease activity was measured according to the method described by Ellis (1990a), with slight modifications (Magnadóttir et al., 1999). Briefly, 20 µl of serum was incubated with 20 μl of standard trypsin solution (Type II-S, from porcine pancreas, 5 mg ml-1, Sigma-Aldrich) for 10 min at 22 °C. Then, 200 μl of phosphate buffer (0.1 M, pH 7.0) and 250 μl azocasein (2%) (Sigma-Aldrich) were added and incubated for 1 h at 22 °C. Five hundred microliter of trichloro acetic acid (10%) (TCA) was added and further incubated for 30 min at 22 °C. The mixture was centrifuged at 6000 g for 5 min and 100 μl of the supernatant was transferred to the wells of a 96 well flat bottomed microplate containing 100 μl of NaOH (1 N). Optical density was read at 430 nm. For a 100% positive control, buffer was replaced for serum, while for the negative control; buffer replaced both serum and trypsin. The trypsin inhibition percentage was calculated using the following equation:
Trypsin inhibition (%) = (A1 – A2/A1) × 100
Where A1 = control trypsin activity (without serum); A2 = activity of trypsin remained
25
Challenge test
Challenge test was conducted to evaluate the effect of propolis forms in the diet on fish disease resistance using Streptococcus iniae as the bacterial pathogenic agent and VHS virus as the viral pathogen agent that provided by Marine microbiology laboratory of Jeju national university. At the end of the feeding trial, fish from the each experimental group were injected intraperitoneally with 100 ml of bacteria per fish at a concentration of 1×10⁸ CFU ml-1 or 10 µlof virus solution and separately distributed into acrylic tanks in a quarantine room. Mortality of the each tank of Streptococcus iniae and VHS virus injected fish were observed and recorded for 24 and 26days respectively.
Statistical analysis
All the data were subjected to ANOVA using SPSS version 22.0 (SPSS Inc., Chicago, IL, USA) to test the effects of dietary treatment. When a significant treatment effects were observed, Tukey’s HSD test at the 5% level of significance (P<0.05) was used to compare means. Data are presented as mean ± SD.
26
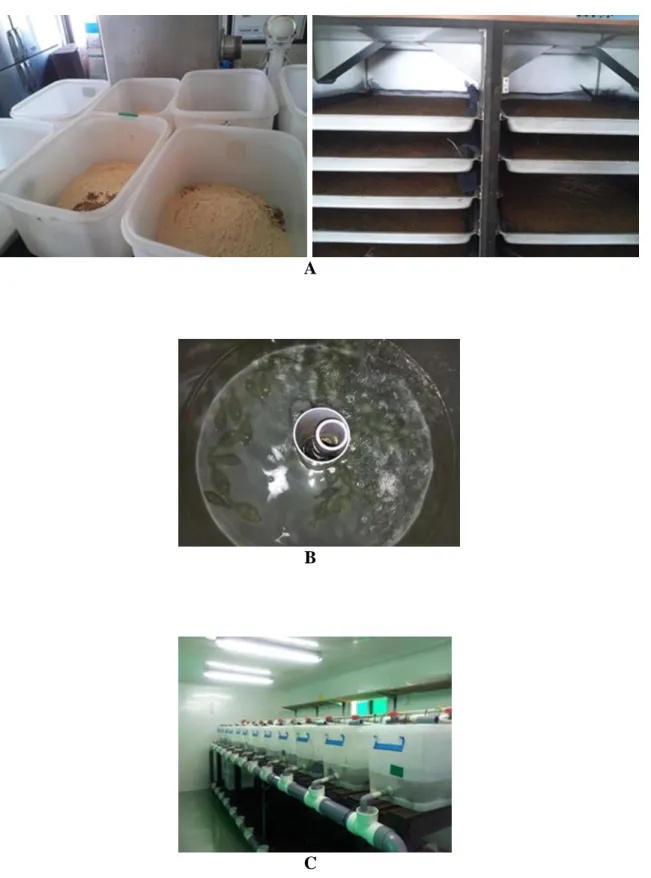
A
B
C
Figure 5. Preparation of experimental diets (A), experimental fish (B) and challenge
27
3.2 Results
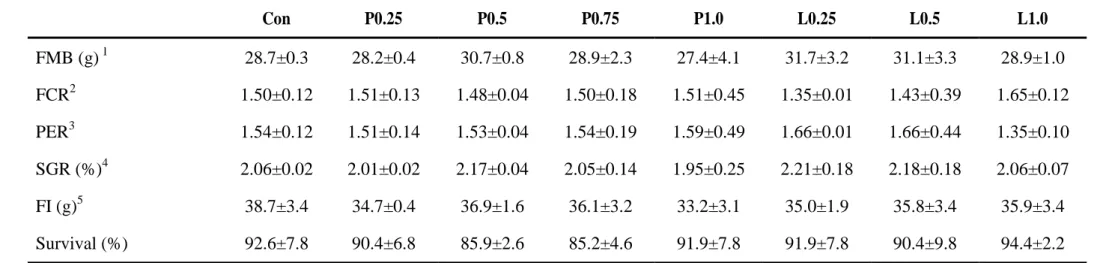
At the end of the feeding trial, no significant differences were observed in growth performance of any dietary treatment (Table 4). However, 0.25% and 0.5% propolis liquid fed fish groups were obtained numerically higher FMB, SGR and PER values and lowest FCR value than those of fish fed the other dietary treatments including control.
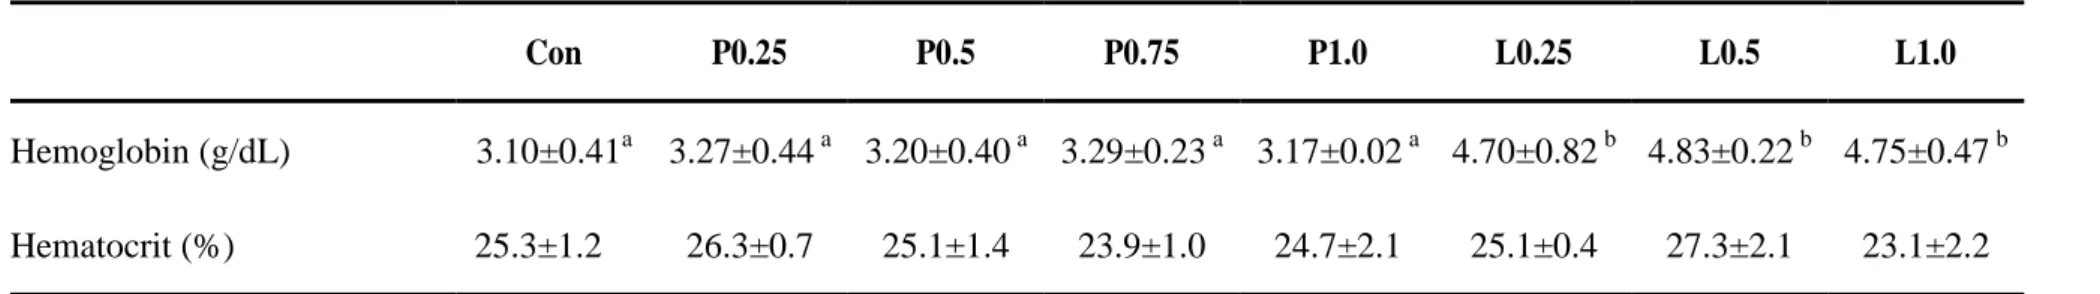
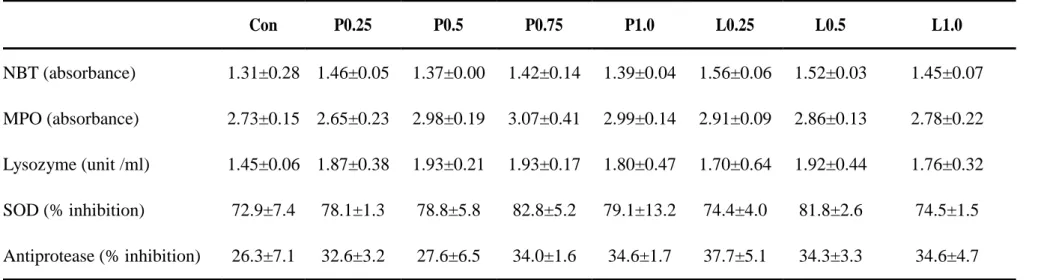
Blood Hb amount of juvenile olive flounders were significantly higher in all propolis liquid supplemented group than control and propolis powder supplemented groups (Table 5). However, Hc percentages of fish blood were not significantly affected by dietary supplementation of propolis. Also, no significant differences were observed in innate immune parameters of fish by dietary supplementation of propolis powder or liquid forms (Table 6).
At the end of the challenge test, highest survival rates were obtained by 0.75 propolis powder fed fish and every propolis supplemented diets fed groups were showed higher survival rates than control groups in both VHS virus (Figure 3A) and Streptococcus
iniae (Figure 3B) challenged groups. On the other hand, significantly lower survival rates
28
Table 4. Growth performance of olive flounder fed the eight experimental diets for 8 weeks.
Con P0.25 P0.5 P0.75 P1.0 L0.25 L0.5 L1.0 FMB (g) 1 28.7±0.3 28.2±0.4 30.7±0.8 28.9±2.3 27.4±4.1 31.7±3.2 31.1±3.3 28.9±1.0 FCR2 1.50±0.12 1.51±0.13 1.48±0.04 1.50±0.18 1.51±0.45 1.35±0.01 1.43±0.39 1.65±0.12 PER3 1.54±0.12 1.51±0.14 1.53±0.04 1.54±0.19 1.59±0.49 1.66±0.01 1.66±0.44 1.35±0.10 SGR (%)4 2.06±0.02 2.01±0.02 2.17±0.04 2.05±0.14 1.95±0.25 2.21±0.18 2.18±0.18 2.06±0.07 FI (g)5 38.7±3.4 34.7±0.4 36.9±1.6 36.1±3.2 33.2±3.1 35.0±1.9 35.8±3.4 35.9±3.4 Survival (%) 92.6±7.8 90.4±6.8 85.9±2.6 85.2±4.6 91.9±7.8 91.9±7.8 90.4±9.8 94.4±2.2
Mean values of triplicate groups, values are presented as mean ± SD. Values in the same row having different superscript letters are significantly different (P< 0.05).
1
FMB = final mean body weight
2
Feed conversion ratio = dry feed fed/wet weight gain
3
Protein efficiency ratio = wet weight gain/total protein given
4
Specific growth rate (%) = [(loge final body weight – loge initial body weight)/days] × 100
5
29
Table 5. Blood parameters of olive flounder fed the eight experimental diets for 8 weeks.
Con P0.25 P0.5 P0.75 P1.0 L0.25 L0.5 L1.0
Hemoglobin (g/dL) 3.10±0.41a 3.27±0.44 a 3.20±0.40 a 3.29±0.23 a 3.17±0.02 a 4.70±0.82 b 4.83±0.22 b 4.75±0.47 b Hematocrit (%) 25.3±1.2 26.3±0.7 25.1±1.4 23.9±1.0 24.7±2.1 25.1±0.4 27.3±2.1 23.1±2.2
Mean values of triplicate groups, values are presented as mean ± SD. Values in the same row having different superscript letters are significantly different (P< 0.05).
30
Table 6. Non-specific immune responses of olive flounder fed the eight experimental diets for 8 weeks.
Con P0.25 P0.5 P0.75 P1.0 L0.25 L0.5 L1.0 NBT (absorbance) 1.31±0.28 1.46±0.05 1.37±0.00 1.42±0.14 1.39±0.04 1.56±0.06 1.52±0.03 1.45±0.07 MPO (absorbance) 2.73±0.15 2.65±0.23 2.98±0.19 3.07±0.41 2.99±0.14 2.91±0.09 2.86±0.13 2.78±0.22 Lysozyme (unit /ml) 1.45±0.06 1.87±0.38 1.93±0.21 1.93±0.17 1.80±0.47 1.70±0.64 1.92±0.44 1.76±0.32 SOD (% inhibition) 72.9±7.4 78.1±1.3 78.8±5.8 82.8±5.2 79.1±13.2 74.4±4.0 81.8±2.6 74.5±1.5 Antiprotease (% inhibition) 26.3±7.1 32.6±3.2 27.6±6.5 34.0±1.6 34.6±1.7 37.7±5.1 34.3±3.3 34.6±4.7
Mean values of triplicate groups, values are presented as mean ± SD. Values in the same row having different superscript letters are significantly different (P< 0.05).
31
Figure 6. Cumulative mortality of olive flounder fed the eight experimental diets after challenge
32
3.3 Discussion
Based on previous studies, growth performances of fish were positively influenced by dietary propolis supplementation (Deng et al., 2011; Abd-El-Rhman et al., 2009; Abbass et al., 2012). In some cases, no effects were found on growth performance by dietary propolis (Cuesta et al., 2005). On the other hand, Bea et al (2012) suggested that dilatory crude propolis level for optimum growth of juvenile eel (Anguilla japonica) could be lower than the level for optimum immune responses and their conclusion was level of propolis supplementation could be 0.25% - 0.5% in diet for optimum growth and feed efficiency of juvenile eel. However, no significant effects were found in growth parameters of juvenile olive flounder in the present study and no previous reports are available regarding the effects of dietary propolis supplementation on growth performance of juvenile olive flounder. Therefore, further investigation is required to determinate the effectiveness of dietary propolis supplementation on growth performance and feed utilization of juvenile olive flounder.
Hb amount of juvenile olive flounder’s blood were significantly increased in this study by propolis liquid supplementation and all dietary propolis supplemented groups were obtained higher Hb values than the control group. Whereas, Hc percentage of any liquid or powder form of propolis supplemented groups were not significantly affected compared with the control group. In the line with this finding, Dotta et al (2014) was not found significantly different Hc percentages by dietary supplementation of propolis. Talas and Gulhan et al (2009) found that 0.02 and 0.03 g/L propolis ethanol extract cause to reduction of Hc and Hb of rainbow trout when its use as blood treatment. Moreover, Hc percentage of juvenile eel was significantly reduced by 2% and 4% propolis
33
supplementation and 0.25%, 0.5% and 1% propolis supplementation were not obtained significant differences than control group (Bae et al., 2012). Further, Yonar et al (2014) observed that 10mg/kg fish/day propolis fed common carp have no significant differences in Hb amount or Hc percentage compared to control group. However, Hb amount and Hc percentage of rainbow trout (Oncorhynchus mykiss) has been significantly increased by exposing 10 ppm of 30% propolis ethanol extract (Orun et al,. 2014).
Innate immune responses of juvenile olive flounders those examined in this study were not significantly affected by dietary supplementation of propolis liquid or powder form. However, NBT activities of all propolis supplemented groups were numerically higher than the control group. The experiment conducted by Yonar et al (2011) regarding the effects of propolis on oxytetracycline induced oxidative stress and immunosuppression in rainbow trout observed that NBT activity was significantly increased by alone supplementation of 50 mg of propolis ethanol extract per kg of fish body weight and they denoted that propolis can be used as antioxidant and immunostimulant in fish. Also, Yonar et al (2014) observed significantly higher NBT activity compared with control group by supplementing 10mg of propolis per kg of fish weight of common carp (Cyprinus carpio). MPO activity of juvenile olive flounder was not significantly affected by dietary supplementation of powder or liquid form of propolis in the present study. However, no previous reports are available regarding the effects of powder or liquid form of propolis on the serum MPO activity of juvenile olive flounder.
Serum lysozyme activity, SOD activity and anti-protease activity of juvenile olive flounder were not significantly increased by dietary supplementation of propolis powder or liquid forms. However, all propolis supplemented groups obtained numerically higher values than control groups. Similarly, numerically and significantly higher serum
34
lysozyme activity of juvenile eel was observed by dietary supplementation of 0.5% and 1% propolis powder (Bea et al., 2012). Also, Abd-El-Rhman et al (2009) reported that serum lysozyme activity of nile tilapia (Oreochromis niloticus) can be increased by dietary supplementation of crude propolis or its ethanolic-extract. In addition, they have observed significantly higher performance by propolis ethanolic-extract supplemented group. However, SOD activity of plasma, liver and kidney of rainbow trout were not significantly affected by dietary supplementation of propolis ethanol extract (Yonar et al 2011; 2012; 2014).
An ethanol extract of Iranian propolis has shown anti-microbial effect against gram-positive bacteria, including Streptococcus iniae (Tukmechi et al., 2010). Also, Santos et al (2002) has observed anti-bacterial activity of propolis. In the present study, significantly higher survival rates were observed by all propolis supplemented groups against VHS virus and Streptococcus iniae bacteria challenge and highest survival rates were shown by 0.75% propolis powder fed fish groups at the end of the challenge test. In line with these findings, Bae et al (2012) and Zhang et al (2009) observed higher survival rates in propolis fed fish groups than control groups. Moreover, Abd-El-Rhman et al (2009) observed lower mortality in 1% crude propolis and propolis ethanol extract supplemented nile tilapia than the control group against Aromonas hydrophila.
According to the present study, propolis liquid supplemented groups obtained significantly higher blood Hb amount than propolis powder supplemented groups and significantly higher survival percentages were obtained by 0.75% propolis powder supplemented group. Also increment of some immune parameters like NBT, Serum lysozyme activity, sod activity and antiprotease activity were observed in the present study. Therefore, this study indicates that dietary propolis supplementation may increase
35
the innate immune responses and disease resistance of juvenile olive flounder. In addition, reductions of some immune parameters have been observed in fish by dietary supplementation of propolis (Abd-El-Rhman et al., 2009; Dotta et al., 2014) and Burdock (1998) elucidates the immunosuppressive effects of propolis.
In conclusion, disease resistance of juvenile olive flounder can be enhanced by dietary supplementation of powder and/or liquid forms of propolis. The optimum level of dietary propolis supplementation for juvenile olive flounder might be 0.75% of powder form in the diet and propolis powder would be the best form of propolis supplementation. However, further studies are required to determine the effects of physical forms of propolis on disease resistance and non-specific immune responses of juvenile olive flounder.
36
4. Conclusion
According to experiment one, non-specific immune responses of olive flounder can be enhanced by dietary supplementation of propolis and optimum level is likely to be approximately 1% in powder form or 0.5% in liquid form in diets for olive flounder. It seemed that growth performance and feed utilization are not affected by the propolis in olive flounder. According to second experiment, disease resistance of juvenile olive flounder can be enhanced by dietary supplementation of powder and/or liquid forms of propolis and thehe optimum level of dietary propolis supplementation for juvenile olive flounder might be 0.75% of powder form in the diet and propolis powder would be the best form.
However, further studies are required to determine the effects of physical forms of propolis on disease resistance and non-specific immune responses of olive flounder.
37
5. References
Abbass AA, El-Asely AM and Kandiel MMM. 2012. Effects of dietary propolis and pollen on growth performance, fecundity and some hematological parameters of
Oreochromis niloticus. Turkish J Fish Aquat Sci 12, 851-859.
Abd-El-Rhman AMM. 2009. Antagonism of Aeromonas hydrophila by propolis and its effect on the performance of nile tilapia, Oreochromis niloticus. Fish Shellfish Immunol 27, 454-459.
Alberto C, Alejandro R, Esteban MA and Jose M. 2005. In vivo effects of propolis, a honeybee product, on gilt head sea bream innate immune responses Fish Shellfish Immunol. 18, 71-80.
Bae JY, Park GH, Lee JY, Okorie OE and Bai SC. 2012. Effects of dietary propolis supplementation on growth performance, immune responses, disease resistance and body composition of juvenile eel, Anguilla japonica. Aquacult Int 20, 513-523.
Bai SC and Kim KW. 2001. Present status and future prospects of aquaculture in Korea. World Aquacult 32, 28-32.
38
Bankova V, De Castro SL and Marcucci MC. 2000. Propolis: Recent advances in chemistry and plant origin. Apidologie. 31, 3-15.
Bulman Z, Le P, Hudson AO and Savka MA. 2011. A novel property of propolis (bee glue): Anti-pathogenic activity by inhibition of N-acyl-homoserine lactone mediated signaling in bacteria. J Ethnopharmacol 138, 788- 797.
Burdock GA. 1998. Review of the biological properties and toxicity of bee propolis (propolis). Food Chem Toxicol 36,347-363.
Christybapita D, Divyagnaneswari M and Michael RD. 2007. Oral administration of
Eclipta alba leaf aqueous extract enhances the non-specific immune responses and
disease resistance of Oreochromis mossambicus. Fish Shellfish Immunol 23, 840-852.
Chu WH. 2006. Adjuvant effect of propolis on immunization by inactivated Aeromonas
hydrophila in carp, Carassius auratus gibelio. Fish Shellfish Immunol 21, 113-117.
Cuesta A, Rodríguez A, Esteban MA and Meseguer J. 2005. In vivo effects of propolis, a honeybee product, on gilthead seabream innate immune responses. Fish Shellfish Immunol 18, 71-80.
39
Cuesta-Rubio O, Piccinelli AL, Fernandez MC, Hernández IM, Rosado A, Rastrelli L. 2007. Chemical characterization of Cuban propolis by HPLC-PDA, HPLC-MS, and NMR: the brown, red, and yellow Cuban varieties of propolis. J. Agric. Food. Chem. 55, 7502–7509.
Dalmo RA, Ingebrigtsen K and Bogwald J. 1997. Non-specific defence mechanisms in fish, with particular reference to the reticuloendothelial system (RES). J Fish Diseas 20, 241-273.
Das A, Nakhro K, Chowdhury S and Kamilya D. 2013. Effects of potential probiotic
Bacillus amyloliquifaciens FPTB16 on systemic and cutaneous mucosal immune
responses and disease resistance of catla (Catla catla). Fish Shellfish Immunol 35, 1547-1553.
Deng J, An Q, Bi B, Wang Q, Kong L, Tao L and Zhang X. 2011. Effect of ethanolic extract of propolis on growth performance and plasma biochemical parameters of rainbow trout (Oncorhynchus mykiss). Fish Physiol Biochem 37, 959-967.
Dotta G, Andrade JIAD, Gonçalves ELT, Brum A, Mattos JJ, Maraschin M and Martins ML. 2014. Leukocyte phagocytosis and lysozyme activity in nile tilapia fed
40
supplemented diet with natural extracts of propolis and Aloe barbadensis. Fish Shellfish Immunol 39, 280-284.
Ellis AE. 2001. Innate host defense mechanisms of fish against viruses and bacteria. Dev Comp Immunol 25, 827-839.
Ellis AE, Stolen JS, Fletcher TC, Anderson DP, Roberson WB and Van muiswinker WB. 1990. Serum antiprotease in fish. Techniques in Fish Immunology, SOS Publication, Fair Haven, U.S.A., pp. 95–99.
FAO, 2014. The State of World Fisheries and Aquaculture., Opportunities and challenges. Food and Agriculture Department. Food and Agriculture Organization of the United Nations, Rome, pp. 233.
Galindo D, Tort L, Balasch JC and Mackenzie S. 2003. Fish immune system. A crossroads between innate and adapataive responses. Imunologia 22, 277-286.
Galindo-villegas J and Hosokawa H. 2004. Immunostimulants: Towards temporary prevention of disease in marine fish.Trend Aqua Nut VII, 279-319.
41
Heinecke JW, Li W, Francis GA and Goldstein JA. 1993. Tyrosyl radical generated by myeloperoxidase catalyzes the oxidative cross-linking of proteins. J Clinic Investigat 91, 2866-2872.
Hultmark D. 1980. Insert immunity: purification and properties of three inducible bactericidal proteins from hemolymph of immunized pupae of Hyalophora cecropia. Eur. J. Biochem. 106, 7-16.
Kanbur M, Eraslan G and Silici S. 2009. Antioxidant effect of propolis against exposure to propetamphosin rats. Ecotox Environ Safe 72, 909-915.
Khalil ML. 2006. Biological activity of bee propolis in health and disease. Asian Pac J Cancer Prev 7, 22-31.
Kolankaya D, Selmanoglu G, Sorkun K and Salih B. 2002. Protective effects of Turkish propolis on alcohol induced serum lipid changes and liver injury in male rats. Food Chem 78, 213-217.
Litman GW, Rast JP, Shamblott MJ, Haire RN, Hulst M, Roess W Litman RT, Hinds-Frey KR, Zilch A and Amemiyag CT. 1993. Phylogenetic diversification of immunoglobulin genes and the antibody repertoire. Mol Bid Evol 10, 60-72.
42
Magnadóttir B, Jonsdottir H, Helgason S, Bjornsson B, Jørgensen T and Pilströ L. 1999. Humoral immune parameters in Atlantic cod Gadus morhua L I: the effects of environmental temperature. Comp. Biochem. Physiol. 122, 173-180.
Orun I, Talas ZS, Gulhan MF and Erdogan K. 2014. Role of propolis on biochemical and hematological parameters of Oncorhynchus mykiss exposed to cypermethrin. J. Surv. Fish. Sci. 1, 21-35.
Park YK and Ikegaki M. 1998. Preparation of water and ethanolic extracts of propolis and evaluation of preparations. Biosci Biotechnol Biochem 62, 2230-2232.
Quade MJ and Roth JA. 1997. A rapid direct assay to measure degranulation of bovine neutrophil primary granules. Vet Immunol Immunopathol. 58, 239-248.
Santos FA, Bastos EMA, Uzeda M, Carvalho MAR, Farias LM, Moreira ESA and Braga FC. 2002. Antibacterial activity of Brazilian propolis and fractions against oral anaerobic bacteria. J. Ethnopharmacol. 80, 1-7.
Scheller S, Gazda G, Pietsz G, Gabrys J, Szumlas J, Eckert L and Shani J. 1988. The ability of ethanol extract of propolis to stimulate plaque formation in immunized mouse spleen cells. Pharmacolog Res Commun 20, 323-328.
43
Sforcin JM, Orsi RO and Bankova V. 2005. Effect of propolis, some isolated compounds and its source plant on antibody production. J Ethnopharmacol 98, 301-305.
Sforcin JM. 2007. Propolis and the immune system: a review. J Ethnopharmacol 113, 1-14.
Siwicki AK, Anderson DP and Rumsey GL. 1994. Dietary intake of immunostimulants by rainbow trout affects non-specific immunity and protection against furunculosis. Vet. Immunol. Immunopathol 41, 125-139.
Solem ST and Stenvik J. 2006. Antibody repertoire development in teleosts – a review with emphasis on salmonids and Gadus morhua , L. Developm Comp Immunol 30, 57–76.
Talas ZS and Gulhan MF. 2009. Effects of various propolis concentrations on biochemical and hematological parameters of rainbow trout (Oncorhynchus mykiss). Ecotox Environ Safe 72, 1994-1998.
Tukmechi A, Ownagh A and Mohebbat A. 2010. In vitro antibacterial activities of ethanol extract of Iranian propolis (EEIP) against fish pathogenic bacteria (Aeromonas
44
hydrophila, Yersinia ruckeri & Streptococcus iniae). Braz. J. Microbiol. 41,
1086-1092.
Vesely T, Reschova S, Pokorova D, Hulova J and Nevorankova Z. 2006. Production of monoclonal antibodies against immunoglobulin heavy chain in common carp (Cyprinus carpio L.). Veterinarni Medicina 51, 296-302.
Yonar ME, Yonar SM and Silici S. 2011. Protective effect of propolis against oxidative stress and immunosuppression induced by oxytetracycline in rainbow trout (Oncorhynchus mykiss, W.). Fish Shellfish Immunol 31, 318-325.
Yonar ME, Yonar SM, Ural MS, Silici S and Düsükcan M. 2012. Protective role of propolis in chlorpyrifos-induced changes in the haematological parameters and the oxidative/antioxidative status of Cyprinus carpio carpio. Food Chem Toxicol 50, 2703-2708.
Yonar SM, Ural MŞ, Silici S and Yonar ME. 2014. Malathion-induced changes in the haematological profi le, the immune response, and the oxidative/antioxidant status of
Cyprinus carpio carpio: Protective role of propolis. Ecotoxicol. Environ. Saf. 102,
45
Zhang G, Gong S, Yu D and Yuan H. 2009. Propolis and Herba Epimedii extracts enhance the non-specific immune response and disease resistance of Chinese sucker,