Impacts of Urban Land Cover Change on Land Surface Temperature
Distribution in Ho Chi Minh City, Vietnam
Le, Thi Thu Ha
1)·Nguyen, Van Trung
2)·Pham, Thi Lan
3)·Tong, Thi Huyen Ai
4)·
La, Phu Hien
5)Abstract
Urban expansion, particularly converting sub-urban areas to residential and commercial land use in metropolitan areas, has been considered as a significant signal of regional economic development. However, this results in urban climate change. One of the key impacts of rapid urbanization on the environment is the effect of UHI (Urban Heat Island). Understanding the effects of urban land cover change on UHI is crucial for improving the ecology and sustainability of cities. This research reports an application of remote sensing data, GIS (Geographic Information Systems) for assessing effects of urban land cover change on the LST (Land Surface Temperature) and heat budget components in Ho Chi Minh City, where is one of the fastest urbanizing region of Vietnam. The change of urban land cover component and LST in the city was derived by using multi-temporal Landsat data for the period of 1998 - 2020. The analysis showed that, from 1998 to 2020 the city had been drastically urbanized into multiple directions, with the urban areas increasing from approximately 125.281 km2 in 1998 to 162.6 km2 in 2007, and 267.2 km2 in 2020, respectively. The results of retrieved LST revealed
the radiant temperature for 1998 ranging from 20.2ºC to 31.2ºC, while that for 2020 remarkably higher ranging from 22.1ºC to 42.3ºC. The results also revealed that given the same percentage of urban land cover components, vegetation area is more effective to reduce the value of LST, meanwhile the impervious surface is the most effective factor to increase the value of the LST.
Keywords : Urbanization, Land surface temperature, Landsat data, GIS spatial analysis, Ho Chi Minh city.
1. Introduction
Urbanization, the conversion of other types of land use associated with the growth of populations and the economy, is the main type of land use and land cover change in human history(Xiao et al., 2006). Land cover change, including changes in biotic diversity, actual and
potential primary productivity, soil quality runoff, and sedimentation rates(Turner et al., 1990) cannot be well understood without the knowledge of land use change that drives them. Therefore, land use and land cover changes have environmental implications at local and regional levels and perhaps are linked to the global environmental process(Weng et al., 1999; Zhang et al., 2016; Kumar
Received 2020. 09. 19, Revised 2020. 10. 13, Accepted 2020. 12. 19
1) Faculty of Geomatics and Land Administration, Hanoi University of Mining and Geology, Vietnam (Email: [email protected]) 2) Faculty of Geomatics and Land Administration, Hanoi University of Mining and Geology, Vietnam (Email: [email protected]) 3) Faculty of Geomatics and Land Administration, Hanoi University of Mining and Geology, Vietnam (Email: [email protected])
4) Space Technology Institute, Vietnam Academy of Science and Technology, 18 Hoang Quoc Viet, Hanoi, Vietnam (Email: [email protected]) 5) Corresponding Author, Faculty of Water Resources Engineering, Thuyloi University, 175 TaySon, Hanoi, Vietnam(Email: [email protected])
https://doi.org/10.7848/ksgpc.2021.39.2.113 Original article
et al., 2012). One of the ecological consequences of
urbanization is the UHI (Urban Heat Island) effect, which is defined as the phenomenon of higher temperatures in urban areas than surrounding areas, mainly attributed to changes in the biophysical properties of the land surface, is one of the most critical factors affecting the quality of human life(Cao et al., 2018; Mirzaei, 2015). This thermal difference, in conjunction with waste heat released from urban houses, transportation, and industry, contribute to the development of the urban heat(Hala et al., 2014). In addition, it exacerbates heat waves and creates a negative effect on life expectancy on urban inhabitants(EPA, 2008). Typically, the average surface emissivity in urban areas is about 2% lower than the typical rural areas. Without emissivity correction and neglecting these difference temperature retrievals of urban-rural environments can show differences of 1.5ºC or more(Howard, 1820). This growth and strength of the heat island areas during this time bring challenges for energy, health of urban residents, water supplies, urban infrastructure and social comfort(Rhinane
et al., 2012). Therefore, effective monitoring of the urban
thermal environment is necessary, the obtained insights of urban thermal spatial and urban development changes can help to improve ecological environment of urban human settlements(Weimin et al., 2019).
In recent years, the relationship between urban LULC (Land Use/Land Cover) and environmental quality has been an interested subject in both planning research and practice. The transition from natural land surface type to urban impervious can result in significant regional climate change(Wang et al., 2019). However, the interaction between land covers and thermal environmental variables is very complicated(Buyantuyev and Wu, 2010). Therefore, many scientists have focused on finding correlations between UHI and land-use/land cover composition in urban area. (Nastran et al., 2018) reported the relationship between urban heat islands and green land use in European cities. (Chen et al., 2006) examined the relationship between UHI and land-use change, in certain cities of the Guangdong Province in Southeast China, using Landsat images from 1990 to 2000. A similar study on the relationship between UHI, land-use change, and population density was also
conducted in Nagpur, India(Kotharkar et al., 2016). Other studies relevant to UHI effects were also conducted(Jusuf
et al., 2007; Yuan et al., 2007; Rotem-Mindali et al., 2015;
Estoque et al., 2017; Singh, et al., 2017; Son et al., 2017; Hoan et al., 2018). These studies have revealed that urban temperatures are highly correlated with urban land use/land cover composition(water, vegetation, built-up, and others). These studies provide similar conclusions that vegetation cover plays a key role in minimizing the UHI effect. The minimization of the UHI effect tends to be beneficial to the community because it may result in the enhancement of dangerous natural phenomena, in addition to its impacts on ecosystems and human health(Hoan et al., 2018).
Advanced models and techniques are required to describe this process, especially for typical urban-suburban areas. Many studies of UHI are based on surface radiative temperature from remote sensors(Voogt, 2002). Among the remote sensed data, Landsat imagery revealed advantages for a long-term monitoring of urbanization and UHI effects due to the availability of its free historical archives since the 1970s(Alipour et al., 2007; Mallick et al., 2008; Kumar et
al., 2012; Son et al., 2017; ). Many studies have used Landsat
data for urban and UHI monitoring(Alipour et al., 2007; Mallick et al., 2008; Kumar et al., 2012; Grishchenko, 2012; Tran et al., 2009; Trinh, 2014, Son et al., 2017,). Meanwhile, the impervious surface area is a direct consequence of the urbanization and impervious land cover has been characteristic of urban areas. Because of the complex urban landscape, directly mapping impervious distribution with remotely sensed data is often difficult(Weng et al., 2004). Different approaches have been employed to study changes in impervious surfaces over time. Changes in LULC or impervious surfaces in a time series image can be detected by change detection on a per-pixel basis between adjacent image). However, the per-pixel approach has caused ‘mixed pixel’ problems particularly for specific urban classes(Son
et al., 2017). Besides, the traditional pixel-based image
analysis is limited because it relies only on the spectral information without taking into account the spatial information of the objects in the scene. Different from pixel-based method, object-oriented approach takes the form, textures and spectral information of the imagery objects
into account. It is therefore can improve the accuracy of urban landcover classification.
Among the biggest cities of Vietnam, Ho Chi Minh city located in the South has very a hot climate. In this city, hot summer lasts 6 months, especially, in some periods the common temperature is from 35ºC-36ºC that greatly affects citizen’s health. Therefore, understanding the spatiotemporal urban impacts on UHI and its drivers in Ho Chi Minh city is very important. However, there are no studies analyzing this issue of the city. As such, this study aims at quantitatively monitoring and analyzing the impact of the urban growth on land surface temperature in Ho Chi Minh city of Vietnam. Our objectives are threefold: (1) determine the extent and rate of the outnumber of impervious surface in the city center, (2) assess the land surface temperature changes in the city between 1998 and 2020, (3) assess the quantitative relationships between the composition of the main urban land-cover types and LST in the city. The results are expected to help government manage urban environment not only for this city but also for other cities in Vietnam.
2. Study Area, Data Collection and
Methodology
2.1 Study area
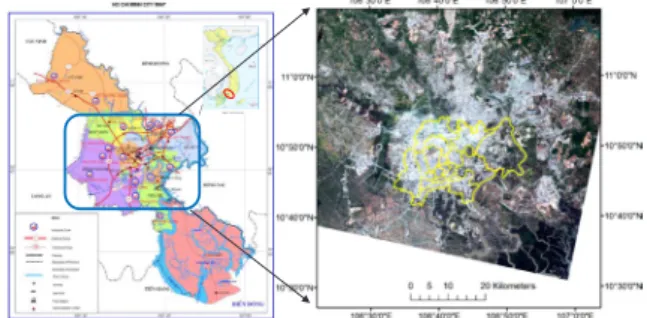
Ho Chi Minh city is the largest city in Vietnam, covering approximately 2095 km2 and lying between 10°10’ – 10°38’
North and 1060°2’ – 106°54’ East (see Fig. 1). The city has urbanized at unprecedented rates after the launch of a reformed economic policy in 1987(Son et al., 2017). According to the census in 2019, Ho Chi Minh City has a population of over 8.9 million people within the city proper and over 21 million within the metropolitan area(GSO, 2019). The transformation of agricultural land to built-up land increased the total urban area in the city from approximately 142 square kilometer to 494 square kilometer during 1997–2008(Du & Fukushima, 2009). Over the last decades, the city has been remarkably urbanized into multiple directions linking with neighboring centers of other provinces and the population is expected to reach more than 10 million people by 2020 to become a mega-urban city(Son et al., 2017). However, the rapid mega-urbanization
without a proper urban planning has created several impacts on the city’s environment, including UHI effects due to the sealing of surfaces and increasing building volumes with less ventilation(Van, 2008). The increase in temperature has triggered deterioration of air and water quality, consequently affecting human health and lessening the liveability of the city.
1 2 3 4
Fig. 1. Location of the study area: inner Ho Chi Minh city (yellow polygon) overlaid on a Landsat 8 satellite 5
image acquired on 26 March 2020. 6
/
Fig. 1. Location of the study area: inner Ho Chi Minh city (yellow polygon) overlaid on a Landsat 8 satellite
image acquired on 26 March 2020
2.2 Data collection
Multi-temporal Landsat data were used for this study. Three Landsat images selected to classify urban land cover and land surface temperature of study area consist of two Landsat-5 TM images acquired on March 3th, 1998,
March 25th, 2008 and a Landsat 8 OLI image acquired on
March 26th, 2020 (freely available at http://glovis.usgs.
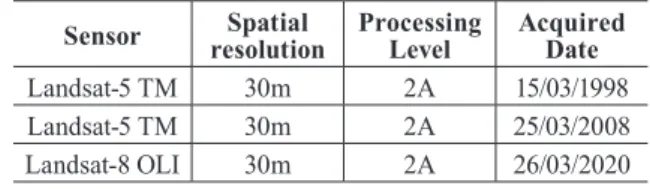
gov). These years were chosen because they marked the significant change of land use/land cover types in the city. In this study, six spectral bands (i.e., Bands 1–5 and 7 for Landsat TM, and bands 2–7 for Landsat OLI) for each set of data were used for urban land-cover mapping, while the thermal bands (i.e. band 6 for Landsat TM and band 10 for Landsat OLI) were used for derivation of LST used for the UHI assessment. The spectral bands are generally between the visible and short-wavelength-infrared regions, except for band 9 of Landsat 8 image, which has a cirrus wavelength between 1.36 and 1.38 µm. The Landsat TM and Landsat OLI data have been geometrically and radiometrically corrected to account for positional errors and atmospheric inferences. Details of the Landsat data were described in Table 1.
Table 1. Characteristics of satellite data used in the study Sensor resolutionSpatial Processing Level Acquired Date
Landsat-5 TM 30m 2A 15/03/1998
Landsat-5 TM 30m 2A 25/03/2008
Landsat-8 OLI 30m 2A 26/03/2020
2.3 Methodology
2.3.1 Urban expansion detection and analysis Land cover maps of Ho Chi Minh city in 1998, 2008 and 2020 were classified from three Landsat images acquired in the aforementioned years. An object-oriented approach available in eCognition Developer 8.7 software was used to improve classification accuracy. The derived land cover maps consist of four classes: 1. impervious surface, 2. water, 3. vegetation, and 4. barren soil. The process of the object-based image classification can be split into three steps: 1-segmentation; 2-classification; 3-accuracy assessment.
Firstly, the MR (Multi-Resolution) segmentation algorithms available in eCognition Developer 8.7 software were used. Parameters for the segmentation including scale, shape ratio, and compactness/smoothness ratio were examined at different values. “Scale” is one of the important criteria in the segmentation process. Scale value directly affects the size of the segmentation objects(Trimble, 2011). Shape ratio value refers to the form and the structure of individual objects. The change in the shape ratio optimizes the spectral or spatial homogeneity of the resulting segmentation. While “smoothness” is defined as the ratio of an object’s perimeter to the perimeter of this object’s boundaries that run parallel to the image borders; “compactness” is the ratio of an object’s perimeter to the square root of the number of pixels within that image object. We hereby chose this segmentation as the most appropriate for the purpose of our work. In segmenting these images, the spatial and spectral characteristics of the image pixels were considered. The segmentation of this study was conducted on a scale of 10, color/shape ratio (0.8/0.2), and compactness/smoothness ratio (0.5/0.5).
The second step in the object-oriented method was to classify image objects. The classification stage was done using the segmented image in association with the training data(class signatures) to achieve a good classification of
the land cover pattern. Because the MNDWI (Modified Normalized Difference Water Index) is more suitable for enhancing and extracting water information for a water region with a background dominated by built-up land areas because of its advantage in reducing and even removing built-up land noise (Xu, 2006), the water class was extracted based on MNDWI. After that, the SAVI (Soil Adjusted Vegetation Index), and the were used to establish a high-quality rule-set for vegetation and impervious surface. Information on image bands, image reflectance, and the relationships between neighboring objects is required to develop a highly accurate rule-set. To improve the accuracy of the classification, manual editing was carried out.
Finally, to assess the accuracy of the classified maps, the ground truth data were used. The classification accuracy is achieved by comparing the ground truth data points with the classified images, points were sampled along main roads, focusing on typical land-cover types in the region. The accuracy of the resulting maps was examined based on 200 ground control points taken from high-resolution Google Earth images, land use maps and fieldwork. The Kappa coefficient, which is calculated according to the Congalton’s formula(Congalton, 1991), deals with the experiment between the remote sensing data and the in-situ observation.
2.3.2 Method of determining surface temperature from the infrared thermal images
To calculate LST, in the first step, the pixel values of the Landsat thermal band must be converted to TOA spectral radiance using the radiance rescaling factors provided in the metadata file by using Eq. (1) (USGS, 2020):
Lλ=MLQcal+AL (1)
where: Lλ - TOA spectral radiance (Watts/( m2 * srad * μm)); ML - Band-specific multiplicative rescaling factor from the metadata (RADIANCE_MULT_BAND_x, where x is the band number); AL - Band-specific additive rescaling factor from the metadata (RADIANCE_ADD_ BAND_x, where x is the band number); Qcal - Quantized and calibrated standard product pixel values (DN).
In the second step, the spectral radiance is converted to brightness temperature using the following equation (USGS):
𝑇𝑇 =𝑙𝑙𝑛𝑛 (𝐾𝐾1𝐾𝐾2 𝐿𝐿𝜆𝜆+1) (2) 𝐿𝐿𝑆𝑆𝑇𝑇 = 𝑇𝑇 1+�𝜆𝜆∗𝑇𝑇𝜌𝜌�∗𝑙𝑙𝑛𝑛𝜀𝜀 (3) Ε 𝜌𝜌 =ℎ.𝜎𝜎 σ (2)
where: T is At satellite brightness temperature (K); K1 is Calibration constant 1 [W/(m2.sr.µm)] and K
2 is Calibration constant 2 [Kelvin] shown in Table 2.
Table 2. LANDSAT thermal band calibration constants obtained from the metadata file
No. Data type Band K1 (W/
(m2.sr.µm)) (Kelvin) K2
1 LANDSAT 5 TM 6 607.66 1260.56
2 LANDSAT 8 OLI 10 774.89 1321.08
Finally, LST can be calculated by the following equation (Grishchenko, 2012; Trinh, 2014; Kumar, 2012): 𝑇𝑇 = 𝐾𝐾2
𝑙𝑙𝑛𝑛 (𝐾𝐾1𝐿𝐿𝜆𝜆+1) (2)
𝐿𝐿𝑆𝑆𝑇𝑇 = 𝑇𝑇
1+�𝜆𝜆∗𝑇𝑇𝜌𝜌�∗𝑙𝑙𝑛𝑛𝜀𝜀 (3)
Ε 𝜌𝜌 =ℎ.𝜎𝜎 σ
(3)
Where: T - brightness temperature (K0), λ - wavelength
(11,5 µm); ε - land surface emissivity,
𝑇𝑇 = 𝐾𝐾2
𝑙𝑙𝑛𝑛 (𝐾𝐾1𝐿𝐿𝜆𝜆+1) (2)
𝐿𝐿𝑆𝑆𝑇𝑇 = 𝑇𝑇
1+�𝜆𝜆∗𝑇𝑇𝜌𝜌�∗𝑙𝑙𝑛𝑛𝜀𝜀 (3)
Ε 𝜌𝜌 =ℎ.𝜎𝜎, h - Plank’s σ
constant (6,626.10-34 J.sec), c - velocity of light (2,998.108
m/sec), σ - Stefan Boltzmann’s constant, which is equal to 5,67.10-8 Wm-2 K-4.
There are several methods to obtain the land surface emissivity, including the TES (Temperature/Emissivity Separation) method(Gillespie et al., 1998) and the emissivity classification scheme(Snyder et al., 1998) if one has the detailed LCLU map. Here we employed an alternative and easy-to-apply approach to obtain land surface emissivity (ε) reported by (Van, 2008). In Vietnamese, many studies in Ho Chi Minh City have determined the clearance of bare soil and vegetative cover for LANDSAT images respectively 0.904, 0.991, and 0.95 for other land cover type(Trinh, 2014; Van, 2008).
3. Results and Discussions
3.1. Image classification accuracy and land
cover maps
For accuracy assessment, a total of 200 reference samples containing approximately 1000 validation pixels for each sample, randomly extracted from the ground reference map were compared with those regions synchronized from the classification maps. The overall accuracies achieved for the 1998, 2008, and 2020 were 78.54%, 79.02%, and 86,87% respectively. The Kappa Coefficient, which measures the difference between the actual agreement and the agreement expected by chance, also confirmed a strong agreement between these two datasets with the values reached 0.81 for 1998, 0.82 for 2008, and 0.89 for 2020.
Fig. 2. Distribution of the ground truth points and field survey photos in the research
3.2. Urban expansion in Ho Chi Minh city from
1998 to 2020
Image analysis was conducted by using Trimble’s eCognition Developer 8.7 software. Classification rules of different features of objects were shown in Table 3. These rules were obtained based on empirical analysis.
Table 3. Classification rules Land cover
class Rule
Water MNDWI = 0.01, and NDVI < 0
Vegetation SAVI ≥0.45, and Mean pixel value of Blue band ≤ 238 Impervious NBI ≥ -0.55, 1600 ≥ Brightness ≥ 1250, and Mean pixel value of SWIR-2 band ≥ 1400
Although, the accuracy assessment mentioned in the section 4.1 showed that the classified images were quite good, the fragmentation in parcels leads to highly mixed patterns of urban land cover, including the case of the industrial zones or among groups of houses found in bare soil area. Because the industrial zones in those zones have a similar spectral response to bare soil, relying solely on spectral response can lead to misclassification of impervious and bare soil. According to the eCognition Developer 8.7-User Guides(Trimble, 2011), manual editing of image objects and thematic objects allows users to manually influence the result of an image analysis. Therefore, the Classify Image Objects Manually and Cut an Object Manually available in the software have used to improve the accuracy of our image classification results.
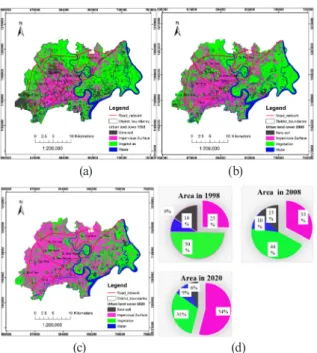
Once classified images were obtained from Landsat images in 1998, 2008, and 2020 (see Fig. 3), they were overlaid by using the Tabulate Area tool available in ESRI-ArcGIS to compute the extent and rate of changes of urban land cover for the two periods: (1) from 1998 to 2008, and (2) from 2008 to 2020.
(a) (b)
(c) (d)
Fig. 3. Distributions of urban land-cover classes in the study area: (a) 1998, (b) 2008, (c) 2020, and (d) Chart of
the land-cover classes area for three years
Fig. 3 (a), (b) and (c) shows the spatial distributions of the four urban land-cover types in Ho Chi Minh city obtained from Landsat images. It can be seen that within 22 years from 1998 to 2020, impervious surface in the inner Ho Chi Minh City expanded and developed strongly. The impervious areas extended from the central area to the North, Northeast, Northwest and West, Southwest of the city. The urban land-cover maps for 1998, 2008, and 2020 were compared to examine the decade urbanization in the study region during over 20-year period. The results indicated that the area of impervious surface in 1996 was approximately 125.3 km2, mostly concentrated in the city center; but it had
been remarkably increased to approximately 162.6 km2
in 2008, and 267.2 km2 in 2020 (see Fig.4). The city
had been drastically urbanized into multiple directions in 2008 and 2020, spatial expansion of the impervious surface mostly concentrated in the North, Northeast, Northwest and West, southwest of the city, owing to advantages of infrastructures and the areas planned for residential, industrial, and commercial zones located near main roads. In contrast, the green area of vegetation decreased strongly from 50% in 1996 to 31% in 2020, the area of vegetation had been remarkably decreased to approximately 94 km2 in 22 years. Besides, the bare soil
has also decreased significantly, decreasing by 10%, corresponding to a decrease of more than 50.125 km2 in
the whole period. Meanwhile, the area of water surface nearly unchanged from 1998 to 2020.
Fig. 4. Area of urban land cover component for 1998, 2008, and 2020
3.3. Spatial distribution of LST in Ho Chi Minh city
Fig. 5 and Table 5 show the distribution of surface temperature across Ho Chi Minh city. The results of LST retrieval from Landsat data were categorized into sixth classes using the natural break (Jenks) method for characterized spatial distributions and temporal changes of LST in the study region during the periods 1998–2008–2020. Observation maps show the lowest and highest LST during study period ranges from 20.2ºC to 31.2ºC, from 21.5ºC to 35.0ºC, and 22.1ºC to 42.3ºC in 1998, 2008 and 2020, respectively. In general, the LST values were relatively higher in the built-up areas than in the nearby suburbs. Hotspots of UHI were apparently more intensive in the central part of the city, where dense residential areas were constructed. There were also many smaller hotpots of UHI along main roads connected to the city center. In 1998, the LST in most of the study region was lower than 30.1ºC. Only 15.02%, corresponding to 74.282 km2 of theregion revealed the LST values in ranges of 30.1–32.0ºC (see Table 5). However, in 2008, the region with LST higher than 30.1ºC had significantly increased with over one-third area of the city has LTS greater than 30.1ºC. Obviously, the most intensive LST was observed in 2020 that the regions hotter than 30.1ºC cover almost three-forth area of the city.
(a) (b)
(c)
Fig. 5. Spatial distributions of LST retrieved from Landsat data for (a) 1998, (b) 2008, and (c) 2020.
3.4. Change of urban land cover components
impact on surface temperature
Fig. 3, Fig. 5 and Table 5 show the relationship between the change of the proportion of urban land cover and LST from 1998, 2008 to 2020. To improve our understanding of UHI impacts due to the rapid urbanization in the study region, the proportion of urban land cover and averaged LST
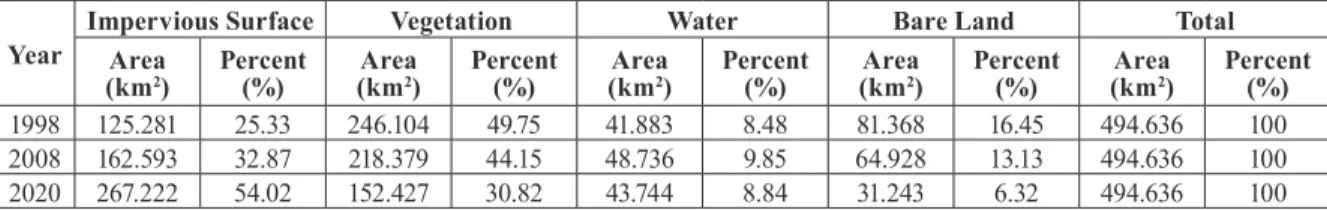
Year Impervious SurfaceArea Vegetation Water Bare Land Total
(km2) Percent (%) (kmArea2) Percent (%) (kmArea2) Percent (%) (kmArea2) Percent (%) (kmArea2) Percent (%)
1998 125.281 25.33 246.104 49.75 41.883 8.48 81.368 16.45 494.636 100
2008 162.593 32.87 218.379 44.15 48.736 9.85 64.928 13.13 494.636 100
2020 267.222 54.02 152.427 30.82 43.744 8.84 31.243 6.32 494.636 100
Table 4. Summary for the four major land-cover types of 1998, 2008, and 2020
No. LST (0C) 1998 2008 2020 Km2 % Km2 % Km2 % 1 20.2 – 25.0 195.147 39.45 93.353 18.87 1.997 4.04 2 25.1- 28.0 126.167 25.51 91.668 18.53 35.252 7.13 3 28.1 – 30.0 99.039 20.02 125.014 25.27 68.998 13.95 4 30.1 - 32.0 74.282 15.02 149.113 30.15 98.698 16.30 5 32.1 - 35.0 0 0 35.488 7.18 258.395 52.24 6 35.1 - 42.3 0 0 0 0 31.296 6.34 Total 494.63 100 494.63 100 494.63 100
Table 5. The proportion of LST corresponding to each LST interval categorized based on the natural breaks for 1998, 2008, and 2020
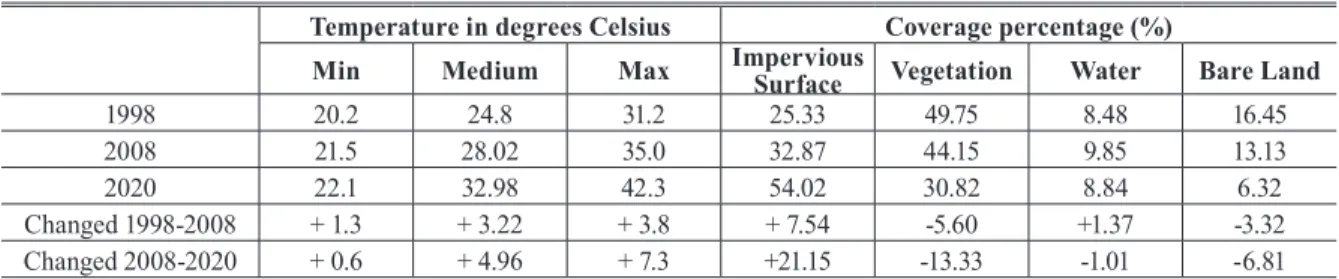
was calculated and showed in Table 6. In 1998, the coverage percentage of vegetation was around 50%, while impervious surface, water, and bare land were almost 50%. In the same year 1998, the LST in most of the study region was lower than 30.1ºC, averaged LST of 1998 reached only 24.8ºC (see Table 6). Because of the rapid urbanization by converting vegetated to impervious surface reflected by the increased proportion of impervious surface in 2008 and 2020, the average LST increased significantly, which is higher than 28ºC for 2008 and close to 33ºC for 2020.
Although the most influential factor controlling UHI effects was the distribution of urban surface characteristics (e.g., Building materials, geometry, and density) that exhibited a unique radioactive, thermal, moisture, and aerodynamic properties, and related to their surrounding site environment, the urbanization had clearly effected on the heat energy balance in the study region. The rapid urban development brought up higher LST values by replacing natural environment (e.g., vegetation, water, and agricultural land) with non-transpiring surfaces, such as stone, metal, and concrete. This research also demonstrates that a substantial decrease in LST can be achieved by increasing the proportion of vegetation and water, which are important component to provide comfortable and sustainable living in the city.
4. Conclusions
In this study, an evaluation of rapid urban expansion and its impact on surface temperature inner Ho Chi Minh city, Viet Nam was conducted by integrating remote sensing and GIS technique. Results revealed a notable increase in urban land use/cover of the city between 1998 and 2020. The
research findings confirmed the validity of our approach for automatically delineating spatiotemporal urbanization in Ho Chi Minh city from Landsat data to produce satisfactory results. The urban land-cover maps compared with the ground reference data revealed the overall accuracies and Kappa coefficients generally higher than 81% and 0.78, respectively. During 1998–2020, the city had been drastically urbanized into multiple directions, with the urban areas, increasing from approximately 125.281 km2
in 1998 to 162.6 km2 in 2007, and 267.2 km2 in 2020. The
LST analysis also indicated the LST ranging from 20.2ºC to 31.2ºC in 1998, from 21.5ºC to 35.0ºC, and 22.1ºC to 42.3ºC in 2008 and 2020, respectively. The increase of surface radiant temperature could be related to the decrease of biomass. Given the same percentage of urban green area, it is more effective to reduce the value of the LST. In contrast, given the same percent impervious surface, it is more effective to increase the value of the LST. Therefore, high density, low-rise residential areas with low vegetation cover should be avoided in urban planning.
Identification of factors affecting the land surface temperature in urban areas is very important. Because the temperature of cities was higher than the countryside and this phenomena is due to an increase in land surface temperature and thereby creating urban heat islands are happening. The main cause of increase in urban land surface temperature is changing in the structure of the Earth's surface or the so-called change of urban land use/ land cover components in this study. The increment of land surface temperature in the long-term causes a lot of damage to the urban environment and its inhabitants as well. By identifying the effect of land use type on land surface temperature, better urban planning can be done for
Table 6. Coverage percentage of urban land-cover and LST (ºC) from 1998 to 2020 Temperature in degrees Celsius Coverage percentage (%)
Min Medium Max Impervious Surface Vegetation Water Bare Land
1998 20.2 24.8 31.2 25.33 49.75 8.48 16.45
2008 21.5 28.02 35.0 32.87 44.15 9.85 13.13
2020 22.1 32.98 42.3 54.02 30.82 8.84 6.32
Changed 1998-2008 + 1.3 + 3.22 + 3.8 + 7.54 -5.60 +1.37 -3.32
urban development and partly can prevent from increasing temperatures and heat island phenomenon in urban areas.
Acknowledgments
We would like to express our thanks to the project of Hanoi University of Mining - Geology, T19-44 for supporting for this study.
References
Alipour, T., Sarajian, M. R., Esmaseily, A. (2004), Land surface temperature estimation from thermal band of LANDSAT sensor, case study: Alashtar city, The
International Archives of the Photogrammetry. Remote Sensing and Spatial Information Sciences, Vol. 38-4/C7,
pp.1-6.
Buyantuyev, A., Wu, J. (2010), Urban heat islands and landscape heterogeneity: linking spatiotemporal variations in surface temperaturesto land-cover and socioeconomic patterns, Landscape Ecology, Vol. 25, pp.17–33.
Cao, Q., Yu, D., Georgescu, M., Wu, J., Wang, W. (2018), Impacts of future urban expansion on summer climate and heat-related human health in eastern China, Environment
International, Vol. 112, pp.134–146.
Congalton, R. G. (1991), A review of assessing the accuracy of classifications of remotely sensed data, Remote Sensing
and Environment, Vol. 37, pp. 35-46.
Du, P.T., Fukushima, S. (2009), Transformation of Socio-economic structure of Ho Chi Minh City Under the Doi– Moi policy and the accompanying globalization process,
Meijo Asian Research Journal, Vol. 1, pp. 33–45.
EPA (2008), Reducing Urban Heat Islands: Compendium of Strategies Urban Heat Island Basics, Available online at https://www.epa.gov/heatislands/heat-island-compendium (accessed August 15 2020).
Estoque, R.C., Murayama, Y., Myint, S.W. (2017), Effects of landscape composition and pattern on land surface temperature: An urban heat island study in the megacities of Southeast Asia, Science of The Total Environment, Vol. 577, pp. 349–359.
Gillespie, A., Rokugawa, S., Matsunaga, T., Cothern, J.S., Hook, S., & Kahle, A.B. (1998), A temperature and emissivity separation algorithm for Advanced Spaceborne Thermal Emission and Reflection Radiometer (ASTER) images, IEEE Transactions on Geoscience and Remote
Sensing, Vol. 36, No. 4, pp. 1113–1126.
Grishchenko, M. Y. (2012), ETM+ thermal infrared imagery application for Moscow urban heat island study, Current
Problems in Remote Sensing of the Earth from Space, Vol.
9, No. 4, pp. 95-101 (In Russian).
GSO (2019), Statistical Yearbook of Vietnam, General Statistics Office of Vietnam.
Hala, A.E, Lamyaa, G-E.D.T , Kamel, F.M. (2014), Change Detection of Land cover and Urban Heat Islands Using Multi-Temporal Landsat Images, Application in Tanta City, Egypt, Open Journal of Remote Sensing and Positioning, Vol. 1, No. 2, pp. 1-15.
Hoan, N.T., Liou, Y.A., Anh, N.K., Sharma, R.C., Phien, T.D., Ling, L.C., Cham, D.D. (2018), Assessing the Effects of Land-Use Types in Surface Urban Heat Islands for Developing Comfortable Living in Hanoi City, Remote
Sensing, Vol. 10, No. 12, 1965.
Howard, L. (1820), The climate of London, International Association for Urban Climate, this is the printing of this edition of the climate of London.
Jusuf, K.S., Wong, N.H., Hagen, E., Anggoro, R., Hong, Y. (2007), The influence of land use on the urban heat island in Singapore, Habitat International, Volume 31, Issue 2, Pages 232-242.
Kotharkar, R.; Surawar, M. (2016), Land Use, Land Cover, and Population Density Impact on the Formation of Canopy Urban Heat Islands through Traverse Survey in the Nagpur Urban Area, India. J. Urban Plan. Dev., 142, 04015003.
Kumar, K.S., Bhaskar, P.U., Padmakumari, K. (2012), Estimation of land surface temperature to study the urban heat island effect using LANDSAT ETM+ image,
International Journal of Engineering Science and technology, Vol. 4, No. 2, pp.771 - 778.
Mallick, J., Kant, Y., Bharath, B. D. (2008), Estimation of land surface temperature over Delhi using LANDSAT 7 ETM+. Geophysics Union, Vol. 3, pp. 131 - 140.
Mirzaei, P.A. (2015), Recent challenges in modeling of urban heat island, Sustainable Cities and Society, Volume 19, Pages: 200-206.
Nastran, M., Kobal, M., Eler, K. (2018), Urban heat islands in relation to green land use in European cities. Urban
Forestry and Urban Green, Vol. 37, pp. 33-41.
Rotem-Mindali, O., Michael, R., Helman, D., Lensky, I.M. (2015), The role of local land-use on the urban heat island effect of Tel Aviv as assessed from satellite remote sensing,
Applied Geography, Vol. 56, pp. 145-153.
Rhinane, H., Hilali, A., Bahi, H., Berrada, A. (2012), Contribution of Landsat TM Data for the Detection of Urban Heat Islands Areas Case of Casablanca, Journal of
Geographic Information System, Vol. 4, pp. 20-26.
Singh, S.C., Hananto, N., Qin, Y., Leclerc, F., Avianto, P., Tapponnier, P.E., Carton, H., S. Wei, A.B. Nugroho, W.A. Gemilang, K. Sieh, and Barbot, S. (2017), The discovery of a conjugate system of faults in the Wharton Basin intraplate deformation zone, Science Advances, Vol. 3, No. 1, pp. 1-9.
Snyder, W.C., Wan, Z., Zhang, Y., & Feng, Y.Z. (1998), Classification-based emissivity for land surface temperature measurement from space, International
Journal of Remote Sensing, Vol. 19, No. 14, pp. 2753–2774.
Son, N.T., Chen, C.F., Chen, C.R., Thanh, B.X., Vuong, T.H. (2017), Assessment of urbanization and urban heat islands in Ho Chi Minh City, Vietnam using Landsat data,
Sustainable Cities and Society, Vol. 30, pp.150–161.
Tran, T.V., Hoang, T.L., Le, V.T. (2009), Thermal remote sensing method in study on urban surface temperature distribution, Vietnam Journal of Earth Sciences, Vol. 31, No. 2, pp.168 - 177.
Trimble (2011), eCognition Developer 8.7: User Guide, Trimble Germany GmbH, Trappentreustr. 1, D-80339 München, Germany.
Trinh, L.H. (2014), Studies of land surface temperature distribution using LANDSAT multispectral image,
Vietnam Journal of Earth Sciences, Vol. 36, No. 1, pp. 82
- 89.
Turner, B.L., William, C.C., Robert, W.K., John, F.R., Jessica, T.M., William, B.M. (1990), The Earth as Transformed
by Human Action: Global and Regional Changes in the
Biosphere over the Past 300 Years, Cambridge University
Press: Cambridge, UK.
USGS (2020), Landsat 7-8 Data Users Handbook, Available online at https://www.usgs.gov/core-science-systems/nli/ landsat/science (accessed August 15 2020).
Van, T.T. (2008), Research on the effect of urban expansion on agricultural land in Ho Chi Minh City by using remote sensing method, VNU Journal of Science Earth Sciences, Vol. 24, pp. 104–111.
Voogt, J.A. (2002), Urban heat island. In I. Douglas (Ed.),
Causes and consequences of global environmental change,
Vol. 3, pp. 660–666, Chichester: John Wiley & Sons, Ltd. Weimin, W., Kai, L., Rong, T., Shudong, W. (2019), Remote
sensing image-based analysis of the urban heat island effect in Shenzhen, China, Physics and Chemistry of the
Earth, Vol.110, pp.168-175.
Weng, Q. (1999), A remote sensing-GIS evaluation of urban expansion and its impact on surface temperature in the Zhujiang Delta, China, International Journal of Remote
Sensing, Vol. 22, No. 10, pp. 1999-2014.
Weng, Q., Lu, D., &Schubring, J. (2004), Estimation of land surface temperature-vegetation abundance relationship for urban heat island studies, Remote Sensing of Environment, Vol. 89, No. 4, pp. 467-483.
Xiao, J., Shen, Y., Ge, J., Tateishi, R., Tang, C., Liang, Y., Huang, Z. (2006), Evaluating urban expansion and land use change in Shijiazhuang, China, by using GIS and remote sensing, Landscape and Urban Planning, Vol. 75, No. 1–2, pp. 69-80.
Xu, H. (2006), Modification of normalised difference water index (NDWI) to enhance open water features in remotely sensed imagery, International Journal of Remote Sensing, Vol. 27, No. 14, pp. 3025–3033.
Yuan, F., Bauer, M.E. (2007), Comparison of impervious surface area and normalized difference vegetation index as indicators of surface urban heat island effects in Landsat imagery. Remote Sens. Environ., Vol. 106, pp. 375–386. Zhang, Z., Li, N., Wang, X., Liu, F., Yang, L. (2016), A
Comparative Study of Urban Expansion in Beijing, Tianjin and Tangshan from the 1970s to 2013, Remote Sensing, Vol. 8, No. 6, pp. 1-22.