Korean J Intern Med 2018;33:763-773 https://doi.org/10.3904/kjim.2016.097
INTRODUCTION
Vanherweghem et al. [1] were the first authors to ob-serve, in an epidemiological study in Belgium, that Chinese herb nephropathy (CHN) can be induced by aristolochic acid (AA), one of the major constituents of Aristolochia fangchi [1-4]. The material analyzed in the Belgian cases was a mixture of aristolochic acid I (AA-I)
and aristolochic acid II (AA-II) [3,5,6]. Thereafter, many investigators in other studies were able to induce CHN in a variety of experimental animals using an AA mix-ture [6]. Debelle et al. [6,7] succeeded in inducing CHN in salt-depleted Wistar rats, and demonstrated that the AA mixture was the causative substance. Therefore, the designation of CHN was changed to the current term of aristolochic acid nephropathy (AAN). Sato et al.[8]
1Department of Internal Medicine,
Hanyang University Guri Hospital, Guri; 2Department of Anatomy,
College of Medicine, The Catholic University of Korea, Seoul;
3Department of Pathology, Konyang
University Hospital, Daejeon, Korea
Received : March 10, 2016 Revised : July 22, 2016 Accepted : August 9, 2016 Correspondence to Sang-Woong Han, M.D.
Department of Internal Medi-cine, Hanyang University Guri Hospital, 153 Gyeongchun-ro, Guri 11923, Korea
Tel: +82-31-560-2231 Fax: +82-31-566-0801
E-mail: [email protected]
Background/Aims: This study was designed to investigate the roles of aristolo-chic acid I (AA-I) and hypokalemia in acute aristoloaristolo-chic acid nephropathy (AAN). Methods: After an adaptation period (1 week), a total of 40 C57BL/6 mice (male, 8 weeks old) were divided into four groups: I (control group), II (low potassium [K] diet), III (normal K diet with administration of AA-I [10 mg/kg weight]), and IV (low K diet with AA-I). After collecting 24 hours of urine at 2 weeks, the mice were sac-rificed, and their blood and kidneys were obtained to perform immunochemical staining and/or Western blot analysis.
Results: Proteinuria, glycosuria, and increased fractional excretion of sodium and K were prominent in groups III and IV (p < 0.05). Diffuse swelling and poor staining of collecting duct epithelial cells were evident in the medullas of group II. Typical lesions of toxic acute tubular injury were prominent in the cortices of groups III and IV. Α-Smooth muscle actin (α-SMA) was higher in the cortices of the mice in groups III and IV versus group II (p < 0.05), and higher in the me-dullas of group IV than groups I and III (p < 0.05). E-cadherin was higher in the cortices of groups III and IV compared to group I (p < 0.05). The F4/80 value was higher in the cortices and medullas of groups II, III, and IV compared to group I (p < 0.05), particularly in the case of group II.
Conclusions: AA-I can induce acquired Fanconi syndrome in the acute stage of AAN. Macrophages appear to play a key role in the pathogenesis of AAN and hy-pokalemic nephropathy. It remains uncertain whether hypokalemia plays any role in AAN and hypokalemia.
Keywords: Aristolochic acid I; Balkan nephropathy; Hypokalemia; Macrophages
Effects of aristolochic acid I and/or hypokalemia
on tubular damage in C57BL/6 rat with
aristolo-chic acid nephropathy
demonstrated that AA-I was more toxic than AA-II and Xue et al. [9]established an animal experimental model of acute AAN through an intra-abdominal injection of AA-I in C57BL/6 rats.
In most of the European CHN cases, rapidly progres-sive interstitial nephritis progressed to end-stage renal failure requiring renal replacement therapy [1,6,10,11]. In Asian countries, however, most cases were accompanied by subacute interstitial nephritis and acquired Fanconi syndrome (aFS) without progressing to ERSD. These cases were managed by correcting the electrolyte imbal-ance and through conservative treatments [12-15]. The hypokalemia observed in aFS may cause renal injury be-cause previous animal experiments have demonstrated the presence of hypokalemic nephropathy (HKN) with tubulointerstitial nephritis in renal medullas [16-19]. Its pathophysiology remains uncertain [20].
Given the aforementioned background information, we aimed to induce aFS in an animal model of acute AAN with pure AA-I, rather than an AA mixture. In ad-dition, this study also aimed to investigate the role of hypokalemia in acute AAN, as well as to identify the pathogenesis of AAN.
METHODS
Animal protocols
The current animal experiment was approved by the Institutional Review Board of College of Medicine, The Catholic University of Korea. The experimental rats consisted of 40 male C67BL/6 mice 8 weeks in age (Ori-ent Bio, Seongnam, Korea), weighing approximately 20 g (Table 1). They were bred in an animal laboratory at the Catholic University at 24°C with 12-hour increments of alternating light and dark under controlled humidity.
The experimental animals were housed 5 to a cage and fed a normal potassium (K) diet (1% K) and primary dis-tilled water for a week. They were then divided into the following four groups.
(1) Group I (n = 10), served as the control group, given a normal K diet.
(2) Group II (n = 10) given a low K diet (0.01% K, Re-search Diet, New Brunswick, NJ, USA) to induce hypokalemia.
(3) Group III (n = 10) fed a normal K diet following
a single intra-abdominal administration of AA-I at 10 mg/kg (Sigma Chemical Co., St. Louis, MO, USA).
(4) Group IV (n = 10) fed a low K diet with the same AA-I administration as group III.
The AA-I (50 mg, AA-I > 95%, Sigma Chemical Co.) that was used in the current study was dissolved in 50 mL of warm saline and then diluted to 1 mg/mL. At the begin-ning of the experiment, 10 mg/kg of AA-I was prepared and intra-abdominally administered in 0.2 mL saline as a single dose. To induce hypokalemia, the rats were giv-en a low K diet and primary distilled water.
The body weights of the rats were measured at 2 weeks (Table 1). Five rats in each group were then anesthetized with 16.5% urethane (10 mL/kg) and their abdominal aortae were punctured with a heparin-filled syringe. Blood samples were collected and the rats were sacri-ficed. The renal tissue was perfused, fixed, and extracte d through the heart. Two days prior to this procedure, the five remaining rats in each group were placed in a metabolic cage. After a 1-day accommodation period, the remaining rats in each group were subjected to a 24-hour urine collection protocol.
Blood and urine tests
To measure the serum concentrations of sodium (Na), K, blood urea nitrogen (BUN), creatinine, and total carbon dioxide (TCO2), we collected approximately 0.2 to 0.3 mL of whole blood through the abdominal vena cava from each rat. Subsequently, using an i-STAT EC8+06F04-01 cartridge (Abbott Laboratories, Princeton, NJ, USA), the
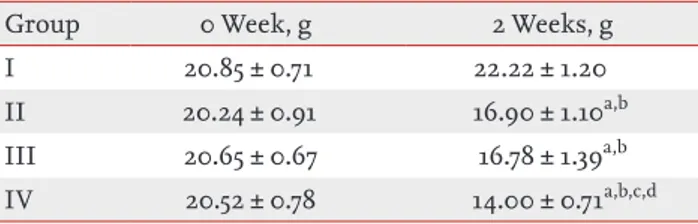
Table 1. Body weight changes in each group
Group 0 Week, g 2 Weeks, g
I 20.85 ± 0.71 22.22 ± 1.20
II 20.24 ± 0.91 16.90 ± 1.10a,b
III 20.65 ± 0.67 16.78 ± 1.39a,b
IV 20.52 ± 0.78 14.00 ± 0.71a,b,c,d
Values are presented as mean ± SD. Group I (control group), II (low potassium [K] diet), III (normal K diet with adminis-tration of aristolochic acid I [AA-I]), and IV (low K diet with administration of AA-I).
aI vs. II, III, and IV (p < 0.001). b0 week vs. 2 weeks (p < 0.05). cII vs. IV (p < 0.05).
blood samples were placed in an i-STAT analyzer (Ab-bottLaboratories) and analyzed.
Immediately after collecting urine samples, the vol-ume and pH were measured. To measure the urine con-centrations of Na, K, blood glucose, protein, and creat-inine, we collected urine samples over the course of 24 hours and froze them at –20°C. Urine Na and K were quantified using ion selective electrodes (Bayer, Pitts-burgh, PA, USA). Creatinine was quantified with a Cre-atinine Reagent kit (Bayer) based on the Jaffe reaction. In addition, glucose was quantified with an ADVIA 1650 (Bayer, Tokyo, Japan) using a Glucose Hexokinase kit. Histopathological examination
After the mice were anesthetized with 16.5% urethane (10 mL/kg body weight) for immunohistochemistry, the whole blood was washed with 0.01 M phosphate-buff-ered saline (PBS, pH7.4) through cardiac puncture. Per-fusion and fixation were performed with 2% parafor-maldehyde-lysine-periodate for 10 minutes, and then the kidneys were promptly collected. The kidneys were sectioned at a thickness of 2 mm that included the renal papilla and fixed in the same fixative mentioned above at 4ºC for 6 to 12 hours. After dehydration, the tissue sam-ples were embedded with polyester wax (Polyscience, Warrington, PA, USA). The 4 μm section slides were prepared and covered with gelatin in order to perform immunohistochemistry analysis. For the histopatholog-ic examinations, we performed hematoxylin and eosin (H&E) staining, periodic acid-Schiff (PAS) staining, and Masson’s trichrome (Trichrome) staining.
Renal histopathology
In each group, all of the samples of kidney tissue that were stained with H&E, PAS, and Trichrome were ana-lyzed with a light microscope (Olympus BX51, Olympus, Tokyo, Japan) at a magnification of ×200. Based on a modified scoring system [21], the results were scored as follows:
(1) Tubular necrosis: 0, normal; 1, a single necrotized tubule; 2, multiple necrotized tubules; 3, a cluster of tubular necrosis.
(2) Tubular atrophy: 0, normal; 1, a single necrotized tubule; 2, atrophy of multiple tubules; 3, a cluster of tubular necrosis.
(3) Lymphocyte infiltration: 0, none; 1, diffuse; 2, a
cluster of lymphocyte infiltration; 3, overall infil-tration of lymphocytes.
(4) Interstitial fibrosis: 0, none; 1, mild fibrosis; 2, moderate fibrosis; 3, severe fibrosis.
(5) Tubular enlargement: 0, none; 1, mild ment; 2, moderate enlargement; 3, severe enlarge-ment.
(6) Amount of cast within the tubule: 0, none; 1, mild; 2, moderate; 3, severe.
Immunohistochemistry
For immunohistochemistry and Western blot analysis, β-actin (Sigma Inc.), α-smooth muscle actin (α-SMA, Sigma Inc.), E-cadherin (BD Transduction Lab., San Di-ego, CA, USA), and F4/80 (Serotec Inc., Raleigh, NC, USA) were used.
The wax of the 4 μm sectioned tissues was removed through alcohol and xylene, and the sections were then immersed in 0.4% methanolic H2O2 for 30 minutes, fol-lowed by 0.05% Triton X for 15 minutes. After incubation in 2% donkey serum (Jackson ImmunoResearch Labo-ratories, West Grove, PA, USA) for 1 hour, these sections were immersed in primary antibodies, α-SMA 1:1,000, E-cadherin 1:200, and F4/80 1:50 overnight at 4ºC.
The following day, the sections were washed with 0.01 M PBS and then immersed in donkey-anti-rat or don-key-anti-mouse (Jackson ImmunoResearch Laborato-ries) secondary antibodies diluted to 1:200 and incubat-ed for 2 hours at room temperature. Immunoreactivity was detected by incubation in Tris buffer (pH 7.6) con-taining 0.05% 3,3′-diaminobenzidine-4HCl and 0.005% H2O2. These sections were then counterstained with Meyer’s hematoxylin and mounted with Canada balsam for examination.
Computer-assisted microscopy evaluation of F4/80 After F4/80 immunohistochemistry, the slides were di-vided into renal cortex and medulla groups. At a magni-fication of ×400, 5 to 10 regions were randomly selected for photography and images were analyzed with Im-age-Pro Analyzer 6.3 version 6.3.0.512 for Windows XP/ Vista (Media Cybernetics Inc., Rockville, MD, USA). Western blot analysis
For the quantitative analysis of proteins, we performed Western blot analysis. The experimental animals were
anesthetized with 16.5% urethane (10 mL/kg) and then perfused with 0.01 M PBS through the heart. After the blood was rinsed, the kidneys in each of the animals were extracted, divided into the cortex and medulla, mixed with 80ºC hot lysis buffer (1% sodium dodecyl sulfate, 1 mM Na3VO4, 10 mM Tris, pH 7.5), and homog-enized. After centrifugation, protein was extracted and quantified using the bicinchoninic acid assay (Pierce, Thermo Scientific, Waltham, MA, USA). Following elec-trophoresis, the proteins were transferred to a nitrocel-lulose membrane and incubated for 1-hour with phos-phate buffered saline Tween (PSBT; PBS containing 0.1% Tween 20) containing 5% skim milk. The mem-branes were then stained with primary antibodies (β-ac-tin 1:300,000, E-cadherin 1:1,000, and α-SMA 1:5,000). The following day, the membranes were rinsed with PBST and donkey-anti-rat or donkey-anti-mouse (Jack-son ImmunoResearch Laboratories) secondary antibod-ies were applied at a 1:2,000 dilution and incubated at room temperature for 2 hours. Color was developed by enhanced chemiluminescence and exposure to light on X-ray film. Following this step, the bands were analyzed with Multi Gauge (Fujifilm Corp., Tokyo, Japan).
Statistical analysis
All data are expressed as mean ± SD. The control and ex-perimental values were compared with the Mann-Whit-ney U test and Kruskal-Wallis test. We also analyzed parametric variables using independent sample t tests and one-way analysis of variance. Statistical analysis was performed with SPSS version 17.0 (SPSS Inc., Chicago, IL, USA). A p < 0.05 was considered statistically signifi-cant.
RESULTS
Body weight changes
The body weights of groups II, III, and IV decreased af-ter 2 weeks (p < 0.05), particularly in group IV (Table 1). Both the 24-hour urine output and pH level significant-ly increased in group II (p < 0.05) compared to group I (Table 2). Urine output was calculated per 100 g of body weight to allow for an objective comparison of urine volumes between the groups because of the significant differences in body weight at 2 weeks.
Blood and urine tests
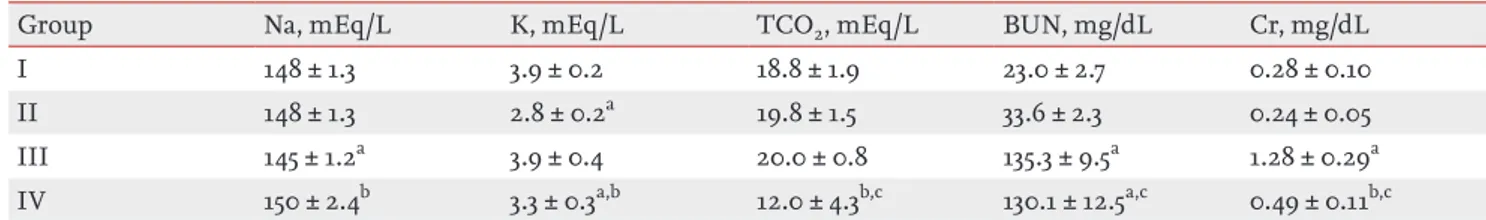
In terms of serum biochemistry (Table 3), serum K lev-els were lower in groups II (2.8 ± 0.2 mEq/L) and IV (3.3 ± 0.3 mEq/L) compared to group I (p < 0.05). The total TCO2 was lowest in group IV (12.0 ± 4.3, p < 0.05). BUN was significantly elevated in groups III (135.3 ± 9.5 mg/dL) and IV (130.1 ± 12.5 mg/dL), as were the serum creatinine
Table 2. Urine pH and volume in each group
Group Urine pH Urine volume, mL/100 g Wt
I 6.29 ± 0.26. 3.33 ± 0.37
II 8.06 ± 1.31a 7.04 ± 4.00a
III 7.47 ± 2.01 6.26 ± 2.78
IV 8.60 ± 1.61 7.21 ± 3.50
Values are presented as mean ± SD. Group I (control group), II (low potassium [K] diet), III (normal K diet with adminis-tration of aristolochic acid I [AA-I]), and IV (low K diet with administration of AA-I).
Wt, weight. aI vs. II (p < 0.05).
Table 3. Blood biochemical data in each group at 2 weeks
Group Na, mEq/L K, mEq/L TCO2, mEq/L BUN, mg/dL Cr, mg/dL
I 148 ± 1.3 3.9 ± 0.2 18.8 ± 1.9 23.0 ± 2.7 0.28 ± 0.10
II 148 ± 1.3 2.8 ± 0.2a 19.8 ± 1.5 33.6 ± 2.3 0.24 ± 0.05
III 145 ± 1.2a 3.9 ± 0.4 20.0 ± 0.8 135.3 ± 9.5a 1.28 ± 0.29a
IV 150 ± 2.4b 3.3 ± 0.3a,b 12.0 ± 4.3b,c 130.1 ± 12.5a,c 0.49 ± 0.11b,c
Values are presented as mean ± SD. Group I (control group), II (low K diet), III (normal K diet with administration of aristo-lochic acid I [AA-I]), and IV (low K diet with administration of AA-I).
Na, sodium; K, potassium; TCO2, total carbon dioxide; BUN, blood urea nitrogen; Cr, creatinine. aI vs. II, III, and IV (p < 0.001).
bIII vs. IV (p < 0.05). cII vs. IV (p < 0.05).
levels (1.28 ± 0.29 and 0.49 ± 0.11 mg/dL, respectively). The level of urine protein adjusted by urine creatinine was higher in group IV (26.3 ± 16.1 mg/g) than in group I (16.4 ± 8.8 mg/g), but was lower in group III (10.5 ± 1.4
mg/g) (Table 4). Glucose levels adjusted by urine creati-nine were significantly higher in groups III (52.6 ± 15.6 mg/g) and IV (56.3 ± 32.3 mg/g) than in group I (2.2 ± 0.8 mg/g) (p < 0.001), as were the fractional excretions of Na (FeNa) and K (FeK) (p < 0.001) (Table 4).
Renal histopathology
Upon histopathological examination (Fig. 1), the renal tubular cells were larger and had lower staining inten-sity in group II compared to group I. Although mild glomerular changes were present in groups III and IV, severe tubular necrosis was evident, mainly in the prox-imal renal tubules. In addition, necrotic epithelial cells and PAS-positive substances filled the lumens, which widened in the lower part of the distal renal tubules. In the mild cases, the renal tubular lumens were widened slightly, the tubular cells were flattened, and the brush border of the proximal tubular cells were flattened or lost. There was no sign of tubular atrophy, interstitial edema, or interstitial fibrosis accompanying the infil-tration of a small number of inflammatory cells. There were no significant differences in the light microscopy findings between groups III and IV.
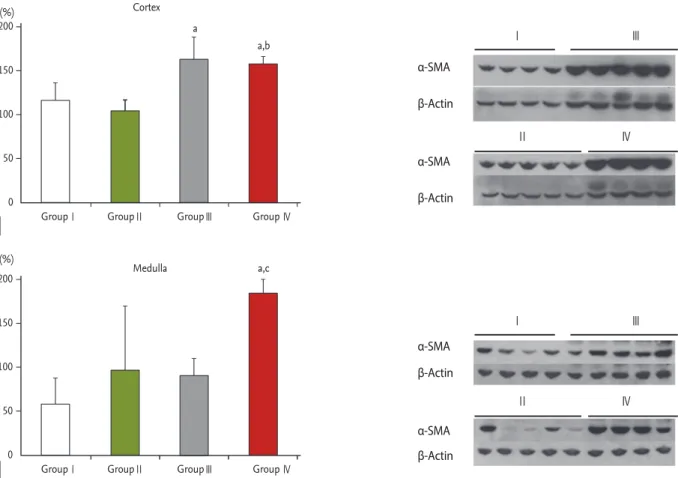
Immunohistochemistry and Western blot analysis Immunohistochemical staining for α-SMA was positive in the areas adjacent to the renal arteriole in the renal cortices of groups I and II. The staining was strong in the areas adjacent to the damaged renal tubules in both the renal cortices and medullas of groups III and IV (data not shown). At the same time, Western blot anal-ysis for α-SMA exhibited increased expression in the renal cortices of groups III and IV (p < 0.05) (Fig. 2). In
Table 4. Urine biochemical data in each group
Group Prot/Cr, mg/g Glc/Cr, mg/g FeNa, % FeK, % Cr, mg/dL
I 16.4 ± 8.8 2.2 ± 0.8 0.4 ± 0.1 39.6 ± 7.6 55.6 ± 9.7
II 5.5 ± 1.43 1.4 ± 1.0 0.4 ± 0.7 11.8 ± 5.0a 28.7 ± 12.7a
III 10.5 ± 1.4 52.6 ± 15.6a 3.0 ± 1.1a 182.0 ± 54.7a 21.9 ± 7.6a
IV 26.3 ± 16.1 56.3 ± 32.3a 1.6 ± 0.2a,b 53.5 ± 37.2b,c 14.4 ± 4.8a,b,c
Values are presented as mean ± SD. Group I (control group), II (low potassium [K] diet), III (normal K diet with administration of aristolochic acid I [AA-I]), and IV (low K diet with administration of AA-I).
Prot, protein; Cr, creatinine; Glc, glucose; FeNa, fractional excretion of sodium; FeK, fractional excretion of potassium. aI vs. II, III, and IV (p < 0.001).
bII vs. IV (p < 0.05). cIII vs. IV (p < 0.05).
Ⅲ Ⅳ
Trichrome PAS Trichrome PAS
Ⅰ Ⅱ
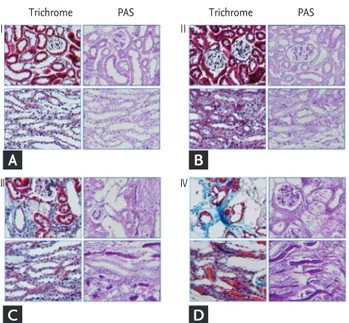
Figure 1. Masson’s trichrome (Trichrome) and periodic
ac-id-schiff (PAS) staining of the cortex and medulla in each group (×200). (A) Group I (control group), (B) group II (low potassium [K] diet), diffuse swelling and scant staining of collecting duct epithelial cells are prominent in the medul-la, (C) groups III (normal K diet with administration of aris-tolochic acid I [AA-I]), and (D) IV (low K diet with adminis-tration of AA-I), typical lesions of toxic acute tubular injury are evident in the cortex with minor glomerular changes. Severe tubular necrosis is observed in the proximal tubules, necrotic epithelial cells fill the lumen, and the distal tubules are dilated and filled with PAS-positive material. However, interstitial fibrosis is only observed around the vessels, and the tubules are infiltrated by a few inflammatory cells with-out tubular atrophy and interstitial edema.
A
C
B
the renal medulla, however, there was more α-SMA in group IV than in groups I and III (p < 0.05).
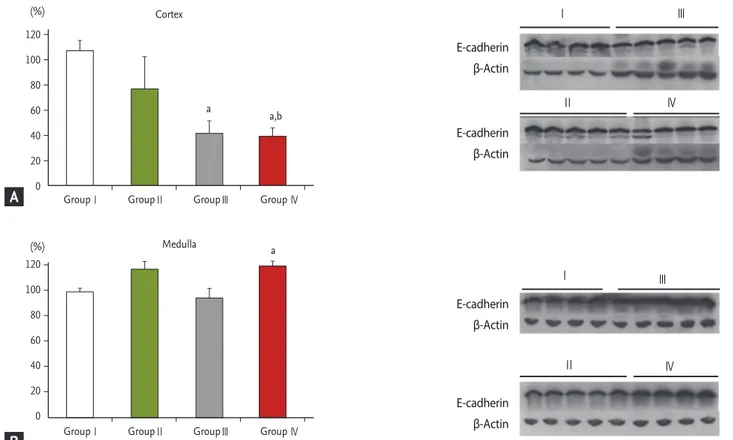
In immunohistochemistry for E-cadherin, the expres-sion was positive in the areas adjacent to the basement membrane of the renal tubules in the cortices of groups I and II. However, in groups III and IV, E-cadherin had disappeared in the areas adjacent to the basement mem-brane (data not shown). In a Western blot analysis for E-cadherin, its expression was significantly decreased in the renal cortices of groups III and IV, as also observed in immunohistochemical staining (p < 0.05) (Fig. 3). In the renal medulla, however, only group IV showed a sig-nificant increase in E-cadherin expression (p < 0.05).
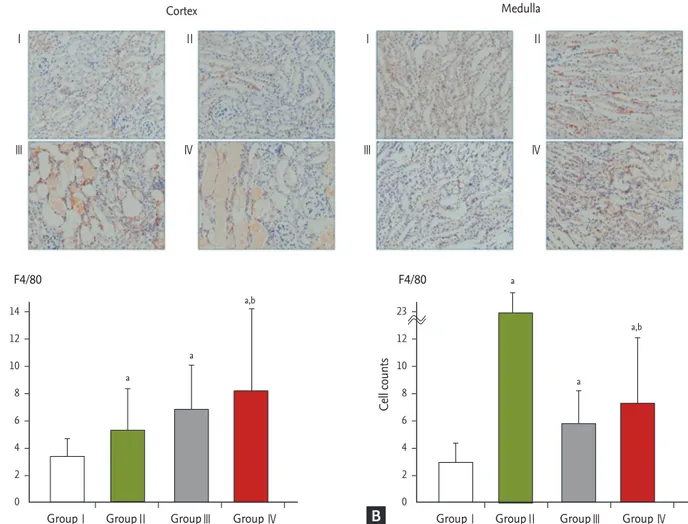
Immunochemical staining combined with comput-er-assisted microscopic evaluation for F4/80 (antibody to macrophages) showed that the level of expression per unit area in both the renal cortex and medulla was sig-nificantly higher in groups II, III, and IV than in group
I. In the renal medulla, however, the level of expression per unit area was significantly higher only in group II. Groups III and IV did not differ significantly (Fig. 4).
DISCUSSION
The acute AAN mouse model in this study was induced by intra-abdominal injection of a single 10 mg/kg dose of AA-I based on previous animal studies which suggest-ed that nephrotoxicity not only occurrsuggest-ed following the administration of AA-I at a dose of 10 to 20 mg/kg in C57BL/6 rats, but also that the LD50 level of AA-I was 37 mg/kg [8,9]. A comparison between the experimental groups and the control group in this study suggests that this dose was appropriate. In addition, the HKN mouse model was correctly induced in group II because (1) se-rum potassium concentrations (K+) were 2.8 ± 0.2 and
200 150 100 50 0 GroupⅠ a a,b (%) Cortex α-SMA Ⅰ Ⅲ Ⅱ Ⅳ β-Actin α-SMA β-Actin α-SMA β-Actin α-SMA β-Actin Medulla
GroupⅡ GroupⅢ Group Ⅳ
200 150 100 50 0 GroupⅠ a,c (%)
GroupⅡ GroupⅢ Group Ⅳ
Ⅰ Ⅲ
Ⅱ Ⅳ
Figure 2. Western blot analysis of α-smooth muscle actin (α-SMA) in the (A) cortex and (B) medulla of each group: group I (control
group), II (low potassium [K] diet), III (normal K diet with administration of aristolochic acid I [AA-I]), and IV (low K diet with administration of AA-I). aI vs. II, III, and IV (p < 0.05), bII vs. IV (p < 0.05), cIII vs. IV (p < 0.05).
A
3.3 ± 0.3 mEq/L even in group IV with the AA-I injection together with hypokalemia and (2) urine pH was higher and urine output was larger in group II than in the con-trol group. Previous animal studies for inducing HKN have shown that serum K+ was 3.3 ± 0.21 mEq/L [22] with elevated urine pH and urine output levels [17]. Our re-sults are consistent with the true HKN animal model (Table 2).
Serum and 24-hour urine biochemistry at 2 weeks showed that there was no significant difference in BUN between groups III and IV, but serum creatinine levels were lower in group IV. This may suggest that nephro-toxicity was lower in group IV than group III. However, since body weight declined more in group IV, nephro-toxicity was actually higher in that group, where AAN and HKN were both induced. This indicates that a small amount of muscle may be included in the decreased body weight.
FeNa and FeK levels increased in the 24-hour urine output time period. Glycosuria and proteinuria were
more pronounced in groups III and IV than the other groups (p < 0.05) (Table 4), as were polyuria and urinary alkalization (Table 2). These results are similar to previ-ous animal studies of aFS [23,24]. Therefore, aFS appears to have been induced by the administration of AA-I (10 mg/kg) in groups III and IV despite the fact that K+ was 3.9 ± 0.4 mEq/L in group III. Since these findings are not consistent with previous reports that hypokalemia accompanies aFS in humans, AA-I may not induce aFS. According to Sato et al. [8] and Pozdzik et al. [21], AA-I has the greatest toxicity among the AA variants, and severe histopathologic damage developed rapidly in the proximal renal tubule of the cortex after 5 days of administration of an AA mixture (AA-I 40% and AA-II 60%) at a dose of 10 mg/kg in Wistar rats. In light of these studies, we may have failed to detect the change in serum K+ associated with aFS because either the toxicity of AA-I exceeded our estimates for severe renal failure due to hyperkalemia, or we collected our samples too late. The histopathologic findings showed that acute
120 100 80 60 40 20 0 120 100 80 60 40 20 0 GroupⅠ a a,b (%) (%) Cortex E-cadherin β-Actin E-cadherin β-Actin E-cadherin β-Actin E-cadherin β-Actin Ⅰ Ⅲ Ⅱ Ⅳ Medulla
GroupⅡ GroupⅢ Group Ⅳ
GroupⅠ GroupⅡ GroupⅢ Group Ⅳ
Ⅰ Ⅲ
Ⅱ Ⅳ
a
Figure 3. Western blot analysis of E-cadherin in the (A) cortex and (B) medulla of each group: group I (control group), II (low
potassium [K] diet), III (normal K diet with administration of aristolochic acid I [AA-I]), and IV (low K diet with administration of AA-I). aI vs. II, III, and IV (p < 0.05), bII vs. IV (p < 0.05).
A
proximal tubular injury was localized to the renal cortex in groups III and IV. Therefore, AA-I may play a key role in the pathogenesis of aFS associated with AAN.
Our finding that proximal tubular injury was localized to the renal cortex was similar to that of previous ani-mal studies of AAN using AA mixtures. Unfortunately, we failed to observe inflammatory cell infiltration, re-nal tubular atrophy, and interstitial fibrosis reported in those same previous studies [5-9,21].This might suggest that the severe toxic effect of AA-I (10 mg/kg) may in-duce apoptosis of the epithelial cells lining the proximal renal tubule without inflammation when it reaches the glomerular filtration stage. Some in vitro studies support this hypothesis. Hsin et al. [25] studied LLC-PK1 cells (the stalk of the porcine proximal renal tubular epithe-lial cells) exposed to AA. As there was an abrupt increase
in the concentration calcium ions which causes stress to the endoplasmic reticulum and mitochondria and acti-vates the caspase pathway, this eventually led to apopto-sis. Balachandran et al. [26] also found that AA-I induced the activation of caspase 3/7 which leads to apoptosis in renal tubular cells. Moreover in an experiment with LLC-PK1 cells exposed to AA-I, Li et al. [27] found that DNA damage and cell division impairment occurred prior to renal tubular necrosis or apoptosis. Therefore, we assume that AA-I may not damage the epithelial cells lining the proximal renal tubule through the infiltration of inflammatory cells or immune reactions, but rather by a direct toxic effect that induces apoptosis.
In addition, Western blot analysis of the renal cortex revealed an increase in the expression of α-SMA and F4/80 in groups III and IV and a significant decrease in
14 12 10 8 6 4 2 0 Cortex F4/80 F4/80 Ⅰ Ⅲ Ⅱ Ⅰ Ⅱ Ⅳ Ⅲ Ⅳ Medulla 23 12 10 8 6 4 2 0 GroupⅠ GroupⅡ
Cell counts Cell counts
GroupⅢ Group Ⅳ GroupⅠ GroupⅡ GroupⅢ Group Ⅳ
a a a a a,b a,b
Figure 4. Immunochemical staining (×200) for F4/80 and the results of computer-assisted microscopic evaluation of F4/80 in
the (A) cortex and (B) medulla of each group: group I (control group), II (low potassium [K] diet), III (normal K diet with admin-istration of aristolochic acid I [AA-I]), and IV (low K diet with adminadmin-istration of AA-I). aI vs. II, III, and IV (p < 0.05), bII vs. IV (p < 0.05).
E-cadherin (Figs. 2-4). There was no evidence of infiltra-tion of inflammatory cells or renal fibrosis suggestive of the epithelial to mesenchymal transition (EMT) of the epithelial cells lining the proximal renal tubule. Pozdzik et al. [21] reported that AA damaged the renal tubules by activating antioxidative enzymes and causing mito-chondrial damage, and that the progressive renal tubu-lar atrophy was associated with a lack of regeneration of the epithelial cells lining the proximal renal tubule with secondary apoptosis being due to the activation of caspase-3. Vimentin and α-SMA positive cells increased in the interstitial areas where transforming growth factor β was expressed, suggesting that the fibroblasts between the renal tubules had proliferated and myofi-broblasts had been activated, as opposed to the presence of EMT of the epithelial cells lining the proximal renal tubule as a result of the developing collagen deposits and interstitial fibrosis [21,28,29]. Therefore, because of the histopathologic findings and Western blot data, we assume that pure AA-I, as opposed to the AA mixture, is directly toxic or induces apoptosis in proximal tubu-lar cells without interstitial fibrosis. However, we failed to detect the effects of hypokalemia in the AAN animal model since there were no significant differences in the immunohistochemical and Western blot results in the renal cortex between groups III and IV.
Interestingly, the expression of F4/80, detected us-ing an F4/80 antibody for macrophages, increased in the renal cortices of groups III and IV. Wilson et al. [30] showed that macrophages could trigger inflammatory responses and apoptosis in the interstitial areas of the renal tubule, and therefore may be associated with re-nal injury and regeneration.Moreover, in an animal ex-perimental model of cyclosporine-induced renal injury, macrophages induced immunological or non-immu-nological damage leading to apoptosis, as reported by Ghee et al. [31]. From this finding, it could be inferred that macrophages may also play a role in the connection with apoptosis or cell regeneration in this study em-ploying pure AA-I.
Our analysis of changes in the renal medulla showed that the expression of F4/80 increased more in group II than in the other groups (p < 0.001). While it has been postulated that hypokalemia in HKN induces the con-traction of renal arterioles as a result of ischemia arising from decreased perfusion in the renal medulla [32-34],
an animal study of the remnant kidney by Kang et al. [35] noted that macrophages infiltrated the renal cortex and medulla. This resulted in the disappearance of capillary vessels and the release of cytokines from macrophages that suppressed the expression of vascular endothelial growth factor (VEGF) in the epithelial cells lining the renal tubules [35]. In addition, another study of an HKN model by Reungjui et al. [22] documented that the ex-pression of macrophage monocyte chemoattractant protein-1 and tumor necrosis factor α increased in the renal medulla while the production of endothelial nitric oxide and VEGF decreased. We therefore speculate that macrophages play a key role in the pathophysiology of HKN, as shown in the case of AAN.
However, this current study has limitations. The first is that we failed to induce interstitial nephritis through the administration of AA-I. In addition, there were al-most no findings suggestive of renal tubular atrophy, interstitial fibrosis, or infiltration of inflammatory cells, all of which have been described in previous animal studies of AAN. Instead, very severe acute renal tubular necrosis was confined to the renal cortex. These acute changes may have made it difficult to observe the effects of hypokalemia and to generate true aFS in this AAN animal model using AA-I, rather than an AA mixture. In addition, because all the results were obtained after 2 weeks, our study may have failed to detect an effect of AA-I during the first days of exposure or in the acute stage. For these reasons, to establish when AA-I induces apoptosis of proximal renal tubule cells or has a specific toxic effect on them will require further studies using a lower dose of AA-I, an examination of earlier chang-es, and a measurement of capase-3 and cytochrome c. The second limitation was that a Western blot analysis of F4/80 was not performed to obtain objective results. Therefore, our suggestion about the role of macro-phages is only minimally supported by our findings. A third limitation is that we may have failed to investigate significant differences in the renal cortex and medulla between groups III and IV, because group IV was simul-taneously induced by both hypokalemia and pure AA-I. Further investigation is needed on AA-I induction of AAN in an established HKN animal model.
We conclude that AA-I, one of the AA variants, plays a key role in the pathogenesis of aFS in the early stages of AAN, and has a powerful toxic effect on the epithelial
cells lining the proximal renal tubule by non-immuno-logical mechanisms. We also suggest that macrophages play a key role in the pathogenesis of both AAN and HKN. However, due to the limitations of the present study, we did not detect an effect of hypokalemia.
Conflict of interest
No potential conflict of interest relevant to this article was reported.
Acknowledgments
This study was supported by a grant from Korean Soci-ety of Nephrology (GAMBRO 2006).
REFERENCES
1. Vanherweghem JL, Depierreux M, Tielemans C, et al. Rapidly progressive interstitial renal fibrosis in young women: association with slimming regimen including Chinese herbs. Lancet 1993;341:387-391.
2. Depierreux M, Van Damme B, Vanden Houte K, Vanher-weghem JL. Pathologic aspects of a newly described ne-phropathy related to the prolonged use of Chinese herbs. Am J Kidney Dis 1994;24:172-180.
3. Vanhaelen M, Vanhaelen-Fastre R, But P, Vanherweghem JL. Identification of aristolochic acid in Chinese herbs. Lancet 1994;343:174.
4. Cosyns JP, Jadoul M, Squifflet JP, Van Cangh PJ, van Yper-sele de Strihou C. Urothelial malignancy in nephropathy due to Chinese herbs. Lancet 1994;344:188.
5. Lebeau C, Debelle FD, Arlt VM, et al. Early proximal tu-bule injury in experimental aristolochic acid nephrop-athy: functional and histological studies. Nephrol Dial Transplant 2005;20:2321-2332.
6. Debelle FD, Vanherweghem JL, Nortier JL. Aristoloch-ic acid nephropathy: a worldwide problem. Kidney Int 2008;74:158-169.
7. Debelle FD, Nortier JL, De Prez EG, et al. Aristolochic ac-ids induce chronic renal failure with interstitial fibrosis in salt-depleted rats. J Am Soc Nephrol 2002;13:431-436. 8. Sato N, Takahashi D, Chen SM, et al. Acute
nephrotox-icity of aristolochic acids in mice. J Pharm Pharmacol 2004;56:221-229.
9. Xue X, Xiao Y, Zhu H, et al. Induction of P450 1A by 3-methylcholanthrene protects mice from aristolochic ac-id-I-induced acute renal injury. Nephrol Dial Transplant 2008;23:3074-3081.
10. Cosyns JP. Aristolochic acid and ‘Chinese herbs nephrop-athy’: a review of the evidence to date. Drug Saf 2003;26:33-48.
11. Reginster F, Jadoul M, van Ypersele de Strihou C. Chinese herbs nephropathy presentation, natural history and fate after transplantation. Nephrol Dial Transplant 1997;12:81-86.
12. Izumotani T, Ishimura E, Tsumura K, Goto K, Nishizawa Y, Morii H. An adult case of Fanconi syndrome due to a mixture of Chinese crude drugs. Nephron 1993;65:137-140. 13. Tsai CS, Chen YC, Chen HH, Cheng CJ, Lin SH. An un-usual cause of hypokalemic paralysis: aristolochic acid nephropathy with Fanconi syndrome. Am J Med Sci 2005;330:153-155.
14. Yang SS, Chu P, Lin YF, Chen A, Lin SH. Aristolochic acid-induced Fanconi’s syndrome and nephropathy presenting as hypokalemic paralysis. Am J Kidney Dis 2002;39:E14.
15. Izzedine H, Launay-Vacher V, Isnard-Bagnis C, Deray G. Drug-induced Fanconi’s syndrome. Am J Kidney Dis 2003;41:292-309.
16. Linas SL, Dickmann D. Mechanism of the decreased re-nal blood flow in the potassium-depleted conscious rat. Kidney Int 1982;21:757-764.
17. Whinnery MA, Kunau RT Jr. Effect of potassium defi-ciency on papillary plasma flow in the rat. Am J Physiol 1979;237:F226-F231.
18. Tolins JP, Hostetter MK, Hostetter TH. Hypokalemic ne-phropathy in the rat: role of ammonia in chronic tubular injury. J Clin Invest 1987;79:1447-1458.
19. Amlal H, Krane CM, Chen Q, Soleimani M. Early polyuria and urinary concentrating defect in potassium depriva-tion. Am J Physiol Renal Physiol 2000;279:F655-F663.
KEY MESSAGE
1. Aristolochic acid I (AA-I), one of the AA variants, plays a key role in the pathogenesis of acquired Fanconi syndrome in the early stages of aristo-lochic acid nephropathy (AAN).
2. Macrophages could play a key role in the patho-genesis of both AAN and hypokalemic nephrop-athy.
20. Suga SI, Phillips MI, Ray PE, et al. Hypokalemia induc-es renal injury and alterations in vasoactive mediators that favor salt sensitivity. Am J Physiol Renal Physiol 2001;281:F620-F629.
21. Pozdzik AA, Salmon IJ, Debelle FD, et al. Aristolochic acid induces proximal tubule apoptosis and epithelial to mes-enchymal transformation. Kidney Int 2008;73:595-607. 22. Reungjui S, Roncal CA, Sato W, et al. Hypokalemic
ne-phropathy is associated with impaired angiogenesis. J Am Soc Nephrol 2008;19:125-134.
23. Gainza FJ, Minguela JI, Lampreabe I. Aminoglycoside-as-sociated Fanconi’s syndrome: an underrecognized entity. Nephron 1997;77:205-211.
24. Appenroth D, Werner T, Lupp A, Patzer L, Misselwitz J, Fleck C. Efforts to establish an animal model of Fanconi syndrome after ifosfamide administration to rats. J Appl Toxicol 2007;27:327-336.
25. Hsin YH, Cheng CH, Tzen JT, Wu MJ, Shu KH, Chen HC. Effect of aristolochic acid on intracellular calcium con-centration and its links with apoptosis in renal tubular cells. Apoptosis 2006;11:2167-2177.
26. Balachandran P, Wei F, Lin RC, Khan IA, Pasco DS. Struc-ture activity relationships of aristolochic acid analogues: toxicity in cultured renal epithelial cells. Kidney Int 2005;67:1797-1805.
27. Li Y, Liu Z, Guo X, Shu J, Chen Z, Li L. Aristolochic acid I-induced DNA damage and cell cycle arrest in renal
tu-bular epithelial cells in vitro. Arch Toxicol 2006;80:524-532.
28. Liu Y. Renal fibrosis: new insights into the pathogenesis and therapeutics. Kidney Int 2006;69:213-217.
29. Forino M, Torregrossa R, Ceol M, et al. TGFbeta1 induces epithelial-mesenchymal transition, but not myofibroblast transdifferentiation of human kidney tubular epithelial cells in primary culture. Int J Exp Pathol 2006;87:197-208. 30. Wilson HM, Walbaum D, Rees AJ. Macrophages and the
kidney. Curr Opin Nephrol Hypertens 2004;13:285-290. 31. Ghee JY, Han DH, Song HK, et al. The role of macrophage
in the pathogenesis of chronic cyclosporiinduced ne-phropathy. Nephrol Dial Transplant 2008;23:4061-4069. 32. Kang DH, Kanellis J, Hugo C, et al. Role of the
microvas-cular endothelium in progressive renal disease. J Am Soc Nephrol 2002;13:806-816.
33. Nangaku M. Chronic hypoxia and tubulointerstitial inju-ry: a final common pathway to end-stage renal failure. J Am Soc Nephrol 2006;17:17-25.
34. Nakagawa T, Kang DH, Ohashi R, et al. Tubulointerstitial disease: role of ischemia and microvascular disease. Curr Opin Nephrol Hypertens 2003;12:233-241.
35. Kang DH, Joly AH, Oh SW, et al. Impaired angiogenesis in the remnant kidney model. I. Potential role of vascular endothelial growth factor and thrombospondin-1. J Am Soc Nephrol 2001;12:1434-1447.