Analysis of Dissociation Pathway of HET-s Prion
Using Steered Pulling Simulation
Minwoo Kim†, Tony Cho‡, and Seokmin Shin*‡
†Department of Chemistry, Sejong University, Seoul 05006, Republic of Korea ‡Department of Chemistry, Seoul National University, Seoul 08826, Republic of Korea
E-mail: [email protected], [email protected], [email protected] Abstract: Prion is a group of the proteins known for its infection mechanisms of Creutzfeldt-Jakob disease (CJD) and other diseases. Solved structures and proven biological roles of fungal prions add tremendous potential to conducting computational simulations. Our research focuses on the binding dynamics of HET-s(218-289), one of the heterokaryon fungal prion originated from Podospora
anserina, by calculating the binding free energy using umbrella sampling at 300
K. The binding free energy calculated was -54.5 kcal mol-1, relatively similar to the binding energy of other amyloid fibrils. The simulation result suggests the thermodynamic properties of β-solenoid of HET-s prion and its similarity in dissociation pathways compared to amyloids.
Introduction
HET-s(218-289), the prion-forming domain of HET-s from the fungus Podospora anserina, is thought to promote the cell-death-like reaction, called heterokaryon incompatibility. Its atomic-resolution structure consists of a triangular hydrophobic core and a β-solenoid fibril arrangement.[1] The atomic-resolution structure of HET-s(218-289), one of the most precisely defined amyloid fibrils, has attracted wide interests from prion researchers.[2]
Calculating free energies by non-Boltzmann sampling methods is known to circumvent heavy computational cost. Two fundamental enhanced sampling techniques employed in
this experiment included the stratification and the importance sampling methods, routinely combined with histogram re-weighting and Weighted Histogram Analysis Method (WHAM). The umbrella sampling method is an enhanced sampling method that implements both stratification and the importance sampling. The importance sampling simulation adopts the following equation for the calculation of the binding free energy:
𝛥𝛥𝛥𝛥𝛥𝛥𝛥𝛥(𝜉𝜉𝜉𝜉) = 𝛥𝛥𝛥𝛥𝛥𝛥𝛥𝛥′(𝜉𝜉𝜉𝜉) + [𝑉𝑉𝑉𝑉(𝜉𝜉𝜉𝜉) − 𝑉𝑉𝑉𝑉(𝜉𝜉𝜉𝜉0)]
𝛥𝛥𝛥𝛥𝛥𝛥𝛥𝛥(𝜉𝜉𝜉𝜉) represents the free energy difference to be obtained. 𝛥𝛥𝛥𝛥𝛥𝛥𝛥𝛥′(𝜉𝜉𝜉𝜉) represents the free energy difference of the system from sampling the system with the non-Boltzmann probability
density at the reaction coordinate 𝜉𝜉𝜉𝜉. 𝑉𝑉𝑉𝑉(𝜉𝜉𝜉𝜉) is the biasing potential which modifies the original potential energy function.[3]
Limited research to the best of our knowledge has been conducted to address the question of the binding energy of the prion domain of HET-s in the dynamics of disaggregation. The binding energy calculation of ligands is often investigated using the umbrella sampling method and WHAM.[3a]
The main focus of this work is to calculate binding energy ΔGbind by Potential of Mean Force (PMF) using WHAM to broaden the understanding of the formation of a highly ordered triangular core with three cross-β sheets in the HET-s prion domain,[4] and to find how bondages contribute in the aggregation of amyloid fibrils.
Theory and Computational Method
Fungal Prion HET-s(218-289) Model (PDB code 2KJ3), which was obtained by H. Van Melckebeke et al., using solid-state NMR, was selected for this simulation.[5] It consists of three β-solenoid chains of the prion part accumulated each other. Each chain contains double-patterned β-sheet by same directions connected between first end and second β-starting point.20 frames of a NMR ensemble in the PDB file were narrowed to the first frame as shown in Figure 1. Visual Molecular Dynamics (VMD) version 1.9.3, a molecular visualization program, was used.
Figure 1. Frame Selection Process. The original HET-s(218-289) ensembles are shown on the left, and the first frame, in order to clarify which frame will be used in GROMACS, separated by VMD is shown on the right side.
Due to the identical amino acid sequence numbers in each of the chains of 2KJ3 PDB model, all of the sequence numbers in three chains (A, B, C) were modified as such, Chain A 217 to Chain A 1, … , Chain C 295 to Chain C 237, to process the pulling of only a chain from the dimeric HET-s. MD simulations were performed on GROMACS version 5.1.4 (used version 5.1 when Umbrella Sampling) with its own libraries and packages. OPLS-AA/L all-atom force field was used for this simulation.
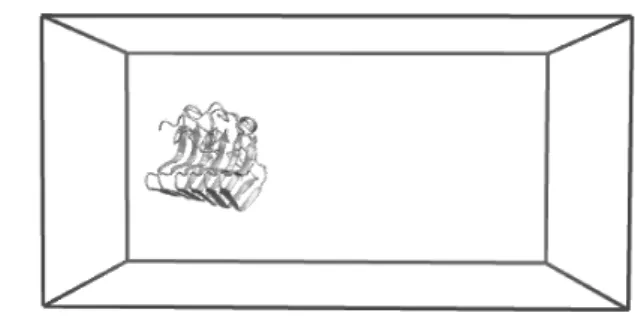
All Termini of the initial chains were designated as NH3+ and COO-. The box was created under periodic boundary condition, whose height(x), depth(y), and width(z) were 8, 8, 16 nanometers, and PDB structure was positioned at the box coordinates (4,4,4) for Z-axis pulling. It was confirmed using Tk Console in VMD and is shown in Figure 2.
The box was filled with Extended Simple Point Charge (SPC/E) water model. SPC/E model takes density and diffusion parameters into account more accurately than the SPC
neutral charge and concentration 0.25 mol L-1. Energy minimization was conducted by the following condition: steepest descent minimization method, 750 kJ mol-1 nm-2 of force constraints, and 80 000 performed steps. NPT equilibration was carried out for 100 ps at 300 K, an approximate temperature known for the optimal growth of Podospora anserina.
Chain C (Met 159 to His 237) was selected for separating from Chain B (Met 80 to His 158) by ‘make_ndx’ package. The pulling and stratification simulation were carried out to obtain a DSSP graph and to generate configurations for Umbrella Sampling. The harmonic biasing force of 1 000 kJ mol-1 nm-2 was applied to increase the distance between the COMs of chains. This pulling simulation was performed for 723 ps because COM of the remaining chain went out of the boundary condition after that time. Nose-Hoover thermostat and Parrinello-Rahman isotropically-coupled barostat were each maintained at 300 K and 1.0 bar, respectively.
As the simulation proceeded, the distance increased non-linearly due to the implementation of the harmonic force. Information of distance changes were derived using ‘trjconv’ package. This steered pulling simulation made a result for distance in Figure 3.
Figure 2. Protein in a box. Right side of the chains (Chain C) was pulled by constant force.
Figure 3. Distance between COM’s between two parts. The chain was pulled by a constant force. 34 configurations were generated by an increment of 0.2 nm.
The importance sampling was achieved by our MD simulations on each of 34 windows based on the selected configurations generated from the stratification simulation. The initial configuration chosen had a distance of 1.0 nm between COMs of the two adjacent chains, and the consecutive configurations were selected such that the distance between the COMs of adjacent configurations were increased by an increment of 0.2 nm, which resulted in 7.8 nm separation between the COMs of the two chains in the last configuration.
Analysis of the changes in the secondary structure of HET-s during simulation provides information on how much nine different secondary structures contribute to the binding energy. Interchain interactions between them are the main driving force of the formation of cross-β structure of the HET-s fibril.
Result and Discussion
The calculated binding energy (ΔGbind) was -54.5 kcal mol-1 from maximum potential and minimum potential difference according to the umbrella potential graph represented as Figure 4. This graph shows that the potential energy increased as the reaction coordinate (ζ) approaches higher value.
According to the result of DSSP analysis shown in Figure 5A, the separation of β-sheets between Chain C (amino acid sequence 160-170) and Chain B (120-130) was observed at 400 ps. In contrast, β-sheet bondage between Chain A and B showed minimal changes. The absence of β-sheet region of Chain C occurred at 420 to 570 ps was observed. The DSSP analysis of the three-fold model of Aβ40 pulling simulation shown in Figure 5B, conducted by Tony Cho et al. showed that β-sheet disaggregation was observed near the residue numbers 140, 155, 170 and 185 at about 180 ps.[6]
Figure 4. Umbrella potential graph visualized by xmgrace. The potential increases sharply at 1 to 4 nm, and then stabilized. At 6 nm, it suddenly dropped and recovered by 7 nm.
Figure 5. (A) DSSP analysis from HET-s; (B) three-fold model of Aβ40 pulling simulation by Tony Cho et al. X and Y axis indicate time (ps) and the residue number, respectively.
In Figure 4, the major binding energy drop was observed at 6 nm, and the energy was recovered by 7 nm. This reduction in the free energy was an unexpected behavior. This suggests that β-sheet re-binding occurred during the simulation. From DSSP graph in Figure 5A, the reappearance of the β-sheet band at 570 ps supports this phenomenon. The intrachain bondages of Chain C was broken and recovered because the pulling force of this simulation was so high. The reformation of these bondages were thought as the main cause of the ‘dropping energy’ situation.
Figure 6A shows the first disaggregation moment of the chain. Some of the bondages such as ARVQLGNVVT and SRVLIGNEYG in β-sheet seemed to cause repulsions. In these segments, five hydrophobic residues and five hydrophilic ones repel each other. In addition, the positive electrostatic repulsions between Arg 180 and Arg 137 weakened bondage. On the other hand, in Figure 6B, KDIRTEER and ETVVGKGE in Figure 6B induce favorable electrostatic attraction and hydrogen bonding.
Figure 6A. Snapshot of HET-s(218-289) at 327 ps. HET-s(218-289) was about to separate by weakening bond of β-sheets captured by the screen of VMD. The bonds consist of ARVQLGNVVT and SRVLIGNEYG.
Figure 6B. Snapshot of HET-s(218-289) at 453 ps. Partial β-sheet separation of HET-s(218-289) captured by the screen of VMD. The strongest bond of β-sheets consist of KDIRTEER and ETVVGKGE. Current Study J.A. Lemkul (2009) Source protein (pdb code) HET-s (2KJ3) Aβ42 (2BEG) Accumulations pulled 2 of 6 1 of 5 Chains pulled 1 of 3 1 of 5 Number of contact residues 22 26 Binding energy (kcal mol-1) -54.5 -50.5 Temperature (K) 300 310 Number of stratifications 34 31 Table 1. Comparison between the simulation results. Aβ pulling simulation was conducted by J. A. Lemkul et al (2009).
Table 1 compares and validates the result from this simulation with the previous study, conducted by Lemkul et al. (2009). One of the biggest differences between two studies is the source protein. This table demonstrates that the binding energies of β-solenoid prions and Aβ did not differ significantly.[7]
Conclusion
In this simulation of HET-s(217-289) using the non-Boltzmann sampling methods, the binding free energy of HET-s showed relative similarity to that of Aβ, suggesting resembling dissociation pathways of β-solenoid and Aβ protofibril. However, the association free energy of HET-s pentamer model found by Yamazaki et al. was -34 kcal mol-1.[8] This notable difference may suggest that HET-s monomers prefers trimer over pentamer, possibly due to the entropic increase of proteins upon the accumulation of monomers, leading to the free energy loss. The change in binding free energy of HET-s depending on the number of monomers bound requires further research on the binding energy of multiple oligomer models using Tq-REM or q-REM.
The reconstruction of β-sheet near the end of the simulation possibly suggested that the denatured monomer has a capability to form fibril without the presence of neighbor β-sheet. While the simulation error lies on a periodic box passing, the binding free energy calculated from other groups validate a promising result from this simulation.
The constant temperature of 300 K for the
used for this work. To obtain more numerical details of binding energy of this prion, Replica-Exchange Molecular Dynamics (REMD) could be one of the better choice for this simulation. In addition, mutational analysis of HET-s should be performed to reveal further details on the hydrophobic and electrostatic interactions key to the formation of cross-β amyloid fibrils and β-solenoid.
Acknowledgments
This research was supported by the EDISON Program through the National Research Foundation of Korea (NRF) funded by the Ministry of Science, ICT & Future Planning (NRF-2011-0020576)
References
[1] S. J. Saupe and A. Daskalov, PLOS Pathogens
2012, 8, e1002687.
[2] A. K. Schütz, A. Soragni, S. Hornemann, A. Aguzzi, M. Ernst, A. Böckmann and B. H. Meier,
Angewandte Chemie International Edition 2011,
50, 5956-5960.
[3] a) C. Chipot, Free Energy Calculations Theory
and Applications in Chemistry and Biology,
Springer, 2007, p; b) J. Kästner, Wiley Interdisciplinary Reviews: Computational Molecular Science 2011, 1, 932-942.
[4] C. Wasmer, A. Schütz, A. Loquet, C. Buhtz, J. Greenwald, R. Riek, A. Böckmann and B. H. Meier, Journal of Molecular Biology 2009, 394, 119-127.
[5] H. Van Melckebeke, C. Wasmer, A. Lange, E. Ab, A. Loquet, A. Böckmann and B. H. Meier,
[6] Y. Y. T. Cho, S. Shin, Disaggregation Simulation Analysis on Distinct Aβ40 Fibril Models, 2016, p.
[7] D. R. B. J. A. Lemkul in Thermodynamics of Amyloid Fibril Dissociation: Identifying Targets for Therapeutic Intervention in Alzheimer's
disease, Vol. Edward Via College of
Osteopathic Medicine 6th Anuual Research Day 2009.
[8] T. Yamazaki, N. Blinov, D. Wishart and A. Kovalenko, Biophysical Journal 2008, 95, 4540-4548.