Performance Analysis of Westinghouse 3-Loop Plants with CENTS Code
In-Ho Song, Suk-Whun Sohn, Jae-Young Huh, Gyu-Cheon Lee, Jong-Joo Sohn, Eun-Kee Kim
Korea Power Engineering Company, Inc. 150 Duckjin-Dong, Yusong-Ku, Daejeon, KOREA [email protected]
1. Introduction
Up to now in Korea, plant simulation for the Westinghouse type plants has mainly focused on safety analysis. Needs of performance analysis for the plants are increasing for better plant operation. Among the candidate code for performance analysis, CENTS code was selected for its capability and flexibility.
CENTS code was developed by CE and used for simulation of CE-type plants. However, it was applied to the safety analysis for Westinghouse-type 3-loop plant and NRC approved it [1]. To be used in performance analysis, accurate feedwater system model, realistic control system model, and best estimated inputs were prepared based on the Kori 3& 4 and YGN 1&2 design.
2. Model Description 2.1 RCS and Steam Generator Model
After CENTS code was verified and validated for Westinghouse 3-loop plant, the code was updated with new features. However, previous modeling is still effective and main system modeling can be used for the performance analysis. Figure 1 is the RCS modeling for the Westinghouse 3-loop plant. Two phase fluid is introduced in nodes and mass, energy, and momentum equations are solved to get the pressures, temperatures, and flowrates. Interfaces with RCS system such as charging and letdown, pressurizer safety and relief valves, safety injection, etc. are also modeled.
Figure 1. CENTS RCS nodalization
Steam generator is modeled in three regions capable of representing re-circulation flow. Constant steam generator volume constraint with mass and energy conservation equation in the regions is used to get the steam generator pressure.
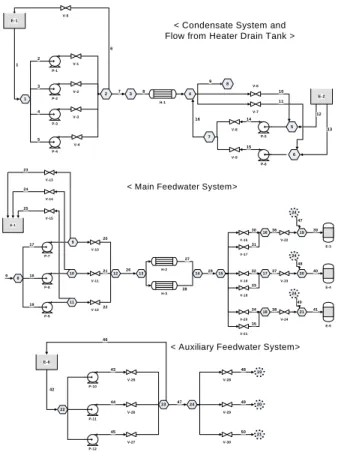
2.2 Feedwater System Model
Detailed feedwater system model for the Kori 3&4 and YGN 1&2 is developed for the purpose of performance analysis. Feedwater systems from condensate to SG nozzle and auxiliary feedwater system are modeled as shown in Figure 2. E-1 1 3 2 4 P-1 5 P-2 P-3 P-4 V-1 V-2 2 E-2 V-3 V-4 4 7 5 6 H-1 V-8 P-5 V-9 P-6 14 15 10 9 16 7 6 V-6 11 V-7 12 13 1 3 8 V-5 8
< Condensate System and Flow from Heater Drain Tank >
8 18 17 19 P-7 P-8 P-9 V-10 V-11 V-12 9 12 13 H-2 14 15 16 20 E-4 V-23 V-18 10 11 V-13 V-14 V-15 20 21 22 26 H-3 27 28 29 17 18 V-19 V-16 V-17 V-20 V-21 V-22 V-24 19 21 E-3 E-5 30 31 32 33 34 35 36 39 37 40 38 41 24 24 24 47 48 49 23 24 25 E-1 9
< Main Feedwater System>
22 P-10 P-11 P-12 V-25 V-26 V-27 23 43 44 45 E-6 42 24 47 V-28 V-29 V-30 19 48 20 49 21 50 46
< Auxiliary Feedwater System>
Figure 2. CENTS feedwater system nodalization
Steady state mass and momentum equations for the nodes and flowpath are solved to obtain pressures and flowrates. A secondary heat balance is introduced to determine the feedwater enthalpy. Heat addition by heaters is a function of turbine power.
Transactions of the Korean Nuclear Society Autumn Meeting Busan, Korea, October 27-28, 2005
2.3 Control System Model
CENTS has generic modules for control system modeling. System based model is prepared as input database. The control system and the protection system including permissive signal are modeled. The control systems modeled are Rod Control System, Pressurizer Level and Pressure Control System, Steam Dump Control System, SG Level Control System, and Feedwater Pump Speed Control Systems. Sensor response times are modeled and valve response times are also modeled if needed.
3. Simulation of Performance Related Events
Steady state and several typical performance related events are simulated with CENTS code. Table 1 shows the comparison of the major steady state parameters at full power between results from CENTS code and plant operating conditions of Westinghouse 3-loop plants. The performance related events simulated include load changes, loss of feedwater pump(s), and turbine trip. Figure 3 shows the steam generator level and steam dump flow transients predicted for loss of two main feedwater pumps event.
Table 1. Comparison of parameters at full power condition Parameters CENTS
code
Plant condition
T-avg (deg F) 588.0 588.5
Pressurizer pressure (psia) 2250 2250 Pressurizer level (%) 57.7 58.0
SG pressure (psia) 966.7 964.0
SG level (%) 50.0 50.0
Feedwater temperature (deg F) 441.0 440.0 Feedwater pump discharge
pressure (psia)
1205 1190 Heater drain flow fraction (%) 35.7 34.0
SG Level and Steam Dump Flow
0 10 20 30 40 50 60 70 80 90 100 0 100 200 300 400 500 Time (sec) SG L e ve l (% ) 0 10 20 30 40 50 60 70 80 90 100 S te a m Du mp F lo w (% ) SG Level Steam Dump Flow
Figure 3. CENTS simulation result for loss of 2 MFWPs
A transient event, occurred in YGN 2 on Sep. 2, 2001, is simulated for code verification. The event was caused by failure of the check valve in the downstream of the main feedwater pump. The power level was about 79% and main feedwater pump “C” was in trip process. The feedwater valves were fully opened because of the low pump head due to much leak flow through the failed check valve. When the operator closed the isolation valve in the downstream of the main feedwater pump “C” to prevent the leak flow, feedwater flow into steam generators was sharply increased and plant tripped due to high SG level. Figure 4 shows the SG “C” level transients from plant data and the simulation with CENTS code. The simulation results are reasonably acceptable considering some operators’ actions difficult to be simulated. SG "C" Level (NR) 0 10 20 30 40 50 60 70 80 90 100 0 60 120 180 240 300 360 420 480 Time (sec) Pe rc e n t Plant Simulation
MFWP isolation valve closed
Figure 4. Comparison of plant behavior and simulation result 4. Conclusion
CENTS code is introduced for performance analysis for Westinghouse 3-loop plant. Feedwater system and control system are modeled in detail for the purpose. Several performance related events as well as one plant malfunction are simulated. The results of those simulations are reasonably acceptable. With more code verification effort, CENTS code will be used for performance analysis such as control system setpoints evaluation to improve plant operation.
REFERENCES
[1] NRC Letter, Robert C. Jones (NRC) to S.A. Toelle (ABB CE), Febrary 24, 1995, TAC M85911