저작자표시-비영리 2.0 대한민국 이용자는 아래의 조건을 따르는 경우에 한하여 자유롭게 l 이 저작물을 복제, 배포, 전송, 전시, 공연 및 방송할 수 있습니다. l 이차적 저작물을 작성할 수 있습니다. 다음과 같은 조건을 따라야 합니다: l 귀하는, 이 저작물의 재이용이나 배포의 경우, 이 저작물에 적용된 이용허락조건 을 명확하게 나타내어야 합니다. l 저작권자로부터 별도의 허가를 받으면 이러한 조건들은 적용되지 않습니다. 저작권법에 따른 이용자의 권리는 위의 내용에 의하여 영향을 받지 않습니다. 이것은 이용허락규약(Legal Code)을 이해하기 쉽게 요약한 것입니다. Disclaimer 저작자표시. 귀하는 원저작자를 표시하여야 합니다. 비영리. 귀하는 이 저작물을 영리 목적으로 이용할 수 없습니다.
Ajou University Graduate School
Medical Science of Heathy Aging Major
Saekyun Jang
Doctoral Thesis in Healthy Aging
Association between relative handgrip
strength and cardiovascular disease
among Korean adults aged 45 years
Ajou University Graduate School
Medical Science of Healthy Aging Major
Saekyun Jang
Association between relative handgrip
strength and cardiovascular disease
among Korean adults aged 45 years
and older
Yunhwan Lee, Advisor
I submit this thesis as the Doctoral thesis in Healthy Aging
i
Abstract
Background: Aging causes both structural and functional changes in the skeletal muscle, and is associated with changes in body composition form, which results in an increased incidence of cardiovascular death. Sarcopenia is the age-related decline in skeletal muscle mass, which is accompanied by decreased muscle strength and function. Handgrip strength (HGS) is a simple, fast, reliable, and cost-effective tool for measuring muscle strength. However, previous studies have shown inconsistent results when they have used other criteria to identify muscle weakness, or they have used various indicators to determine handgrip strength.
Objective: We aimed to investigate which index was most suitable for predicting cardiovascular disease (CVD), and suggested the optimal cut-off points based on the handgrip strength index. In addition, we aimed to identify the effects of weak HGS, as determined by applying the optimal cut point on the development of CVD.
Method: A total of 8,494 older men and women aged over 45 years from the Korean Longitudinal Study of Aging (KLoSA) were included in this study at baseline. We performed a generalized estimating equation (GEE) regression model in order to explore whether the probability of CVD has changed over time, and compared the best fit among three different HGS indices using the Quasi-Akaike Information Criterion (QIC).
ii
Results: The relative HGS was strongly associated with CVD in both sexes, and the best fit model was in that in comparison to dominant HGS and absolute HGS (men: OR [odds ratio] per 1 SD increase in relative HGS = 0.839; 95% CI, 0.783–0.898; p < 0.0001; and women: OR per 1 SD increase in relative HGS = 0.795; 95% CI, 0.726–0.870; p < 0.0001). In addition, we calculated the optimal cut point for CVD based on the relative HGS in this study (men: < 2.52 and women: < 1.55, respectively), and demonstrated that low HGS, as determined by applying relative HGS cut points, was associated with a higher OR for CVD compared to normal HGS; the associations observed were consistent between the sexes (men: OR = 1.202; 95% CI, 1.112–1.300; p < 0.0001; and women: OR = 1.211; 95% CI, 1.124– 1.305; p < 0.0001).
Conclusions: Our findings suggest that HGS has the potential to be a valuable screening tool for cardiovascular risk in clinical settings; this is advantageous in situations where blood sampling is not possible since HGS is easily measured and highly reproducible. It is necessary to pay attention to weak grip strength against body size in the elderly population.
iii
Tables of contents
Abstract... i
I.
Introduction ... 1
II.
Theoretical Considerations ... 6
A.
Sarcopenia ...6
B.
Sarcopenia cut-off points for muscle weakness ...9
1. The FNIH Sarcopenia Project (2014) ...9
2.
The consensus report of the Asian Working Group for
Sarcopenia (2014) ...9
3.
The cut-off value for sarcopenia in Korean adults using
KNHANES VI (2017) ... 10
4.
....European Working Group on Sarcopenia in Older People
(2018) ... 11
iv
D.
Frailty ... 14
E.
Association between handgrip strength and cardiovascular
disease ... 15
III.
Method ... 23
A.
Study Population ... 23
B.
Dependent variable ... 25
C.
Measurement of handgrip strength ... 26
D.
Covariates ... 27
E.
Statistical analysis ... 29
IV.
Results ... 31
A.
Characteristics of Participants... 31
B.
Relative handgrip strength was a better predictor for
cardiovascular disease than dominant and absolute handgrip strength
34
v
C.
Prevalence of cardiovascular diseases according to quartiles of
relative handgrip strength and correlation with age ... 43
D.
Cut-off points for cardiovascular disease based on the relative
handgrip strength ... 45
E.
Association between low handgrip strength and cardiovascular
diseases ... 47
V.
Discussion ... 63
VI.
Conclusion ... 73
vi
List of Figures
Figure 1 Algorithm for Find-Assess-Confirm-Severity ... 7
Figure 2 Flow diagram of the study population at baseline ... 25
Figure 3 Framework of research ... 29
Figure 4 Prevalence of cardiovascular diseases according to quartiles of
relative handgrip strength ... 43
Figure 5 Correlation of relative handgrip strength with age versus
dominant HGS in men and women ... 44
Figure 6 ROC curve analyses of relative and dominant handgrip strength
for the detection of cardiovascular diseases ... 46
vii
List of Tables
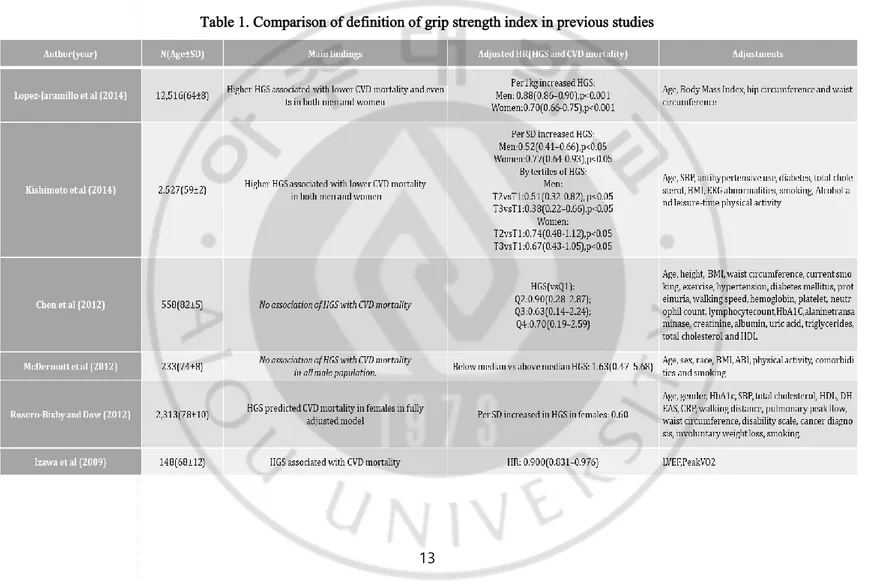
Table 1. Comparison of definition of grip strength index in previous studies13
Table 2 Relationship between grip strength and cardiovascular death in previous
studies ... 21
Table 3 General characteristics of participants for analysis according to low handgrip
strength by sex at baseline (2006) ... 33
Table 4 Adjusted ORs and 95% CIs for Cardiovascular diseases and QIC according
to HGS indices in men ... 36
Table 5 Adjusted ORs and 95% CIs for Cardiovascular diseases and QIC according
to HGS indices in women ... 36
Table 6 Adjusted ORs and 95% CIs for CVDs according to HGS quartiles by age in
men and women ... 40
Table 7 Adjusted ORs and 95% CIs for heart diseases according to HGS quartiles by
age in men and women ... 41
Table 8 Adjusted ORs and 95% CIs for stroke according to HGS quartiles by age in
men and women ... 42
Table 9 Association between low handgrip strength (HGS) and cardiovascular
disease (CVD) ... 49
Table 10 Association between low handgrip strength (HGS) and heart disease by sex
... 51
Table 11 Association between low handgrip strength (HGS) and stroke by sex
viii
... 53
Table 12 Association between low handgrip strength (HGS) and cardiovascular
disease (CVD) by age in men ... 56
Table 13 Association between low handgrip strength (HGS) and heart disease by age
in men ... 57
Table 14 Association between low handgrip strength (HGS) and stroke by age in
men ... 58
Table 15 Association between low handgrip strength (HGS) and cardiovascular
disease (CVD) by age in women ... 60
Table 16 Association between low handgrip strength (HGS) and heart disease by age
in women ... 61
Table 17 Association between low handgrip strength (HGS) and stroke by age in
1
I. Introduction
Cardiovascular disease (CVD) was the primary cause of death in 2012, and accounts for approximately 17.5 million deaths worldwide each year. The risk factors of CVD include behavioral risk factors such as smoking, poor diet, alcohol abuse, and lack of physical activity, and health conditions such as high blood pressure, obesity, high blood sugar levels and hyperglycemia (WHO, 2016). The leading causes of death in Korea from single organ disease are cerebrovascular and CVDs. Although the overall CVD mortality rate has decreased significantly in recent years, death from ischemic heart disease has steadily increased over the past 30 years (Lee et al., 2016a). Furthermore, the cumulative incidence
of CVD has increased steadily with age in both men and women (Leening et al., 2014).
Aging causes both structural and functional changes in skeletal muscle, and in humans, these changes cause frailty and disabilities and are associated with changes in body composition form . These changes affect the basis of many metabolic disorders, such as insulin resistance, type 2 diabetes, hypertension, and hyperlipidemia, which are also known to lead to an increased incidence of cardiovascular death (Nair, 2005). It is known that muscle mass and muscle strength begin to decrease with age after approximately 30 years(Rosenberg, 1997,
2011)South Korea is known to be one of the fastest aging countries, and Asia is the fastest
aging region in the world (United Nations, 2015). Older adults often face changes in body composition, which can lead to a shift toward decreased muscle mass and increased fat mass; this is true even in healthy individuals with a relatively stable weight (Newman et al., 2006)
2
Sarcopenia is the age-related decline in skeletal muscle mass accompanied by decreased muscle strength and function (Rosenberg, 2011) Sarcopenia has been encountered with increasing frequency in clinical research and practice, not only in geriatric medicine, but also across other medical fields (Cruz-Jentoft et al., 2010b) A great number of epidemiological studies support the relationship between muscle fitness and functional decline, frailty, diabetes mellitus, metabolic syndrome (MetS), mobility, and all-cause mortality(Sayer et al., 2007; Ling et al., 2010; Chen et al., 2012; Leong et al., 2015; Minneci et al., 2015; Dong et al., 2016; Lawman et al., 2016; Nofuji et al., 2016).
A reduction in muscle strength, which is one of the indicators used to determine sarcopenia, can be diagnosed by a combination of clinical measurements such as dual energy X-ray absorptiometry, walking speed, and handgrip strength (HGS) (Chen et al., 2014; Batsis et al., 2015). In the measurement of muscle strength, HGS is a simple, quick, reliable, and inexpensive tool that strongly correlates with leg strength (Cruz-Jentoft et al., 2010a; Chen et al., 2014). Furthermore, HGS serves as a proxy measure for both muscle function and physical health. Studies have shown that low HGS is associated with common age-related disorders including frailty and sarcopenia (Ong et al., 2017) In addition, it has been demonstrated that HGS can explicate the forearm and upper limb muscle strength when measured in a sitting position, and this included the lower limb and core muscle strength when tested in standing position(Chen et al., 2016). Recent consensus reports on the definition, diagnosis, and management of sarcopenia by some working groups, including the Asian Working Group for Sarcopenia (AWGS), the European Working Group on Sarcopenia in Older People (EWGSOP), and the Foundation for the National Institutes of Health
3
Sarcopenia Project (FNIH), have recommended HGS as one of the tools to be used in diagnostic algorithms for sarcopenia(Studenski et al., 2014)
There is some evidence that HGS is associated with chronic disease. The prevalence of chronic diseases has increased along with longevity, and is expected to rise further due to an aging population (Knottnerus et al., 1992). Chronic conditions, such as coronary heart disease, stroke, chronic obstructive pulmonary conditions, arthritis, and diabetes mellitus have been shown to be associated with decreased muscle strength (Rantanen et al., 1998) Moreover, a meta-analysis of prospective cohort studies showed that the hazard ratios of the lowest versus highest category of HGS was 1.63 for CVDs (Wu et al., 2017) Likewise, in the Prospective Urban-Rural Epidemiology (PURE) study, a large longitudinal population study, during a median follow-up period of 4 years, and among 142,861 participants, HGS was a stronger predictor of all-cause and cardiac mortality than systolic blood pressure. This study also showed that the risk of a heart attack increases by 7% and the risk of stroke increases by 9% for every 5 kg reduction in HGS(Leong et al., 2015). Furthermore, a recent study reported that HGS is strongly and inversely related to all-cause mortality and the incidence of CVD, respiratory disease, chronic obstructive pulmonary disease, and all cancers and subtypes of cancer, including colorectal, lung, and breast cancer; these associations were shown to be modestly stronger in the younger age groups (Celis-Morales et al., 2018).
However, in the Swiss CoLaus study, it was reported that there was no association between HGS and CVD amongst the 2,707 participants (50–75 years)(Gubelmann et al., 2017b).
4
While several studies have indicated that HGS is associated with prediabetes in normal-weight Americans, South Asians, and elderly Chinese individuals (Zhang et al., 2014; Mainous et al., 2016; Ntuk et al., 2017) other studies have shown contradictory results (Fowles et al., 2014; Liu et al., 2014). For instance, the study(Yang et al., 2012) showed that there was only a relationship between cardiometabolic risk and HGS among Korean men, not women (Yang et al., 2012), whereas another study by showed an association for Japanese women only, not for men(Aoyama et al., 2011). Recent Mendelian randomization studies have also demonstrated conflicting results regarding the association between handgrip strength and CVD. Xu and Hao (Xu and Hao, 2017) reported an inverse causal relationship between HGS and the risk of coronary artery disease or myocardial infarction (MI). However, other Mendelian randomization analyses found no evidence for causality in the association between handgrip and cardiovascular events (Willems et al., 2017) A study (Kim et al., 2016) using data from the Korea National Health and Nutrition Examination Survey (2008–2010) reported the differences in skeletal muscle mass indices derived from each model for
evaluating sarcopenia. Several operational methods, including ASM/ht2, ASM/wt, and
ASM/BMI, are used to define low lean mass. They compared these three operational definitions and found that the prevalence of sarcopenia and its association with clinical outcomes varied widely depending on the method used to define low lean mass. Previous studies have reported several reasons for this discrepancy. For example, Dodds et al.(Dodds et al., 2016) reported that weak HGS is a key component of sarcopenia and is associated with subsequent disability and mortality; however, it is unclear whether the cut points for weak grip strength are suitable for use in other settings. In their study, they demonstrated differences in HGS by world region, and reported that the HGS normative data between the
5
British and developed regions, such as United States, were more similar, while they found lower normative data in developing regions, such as China and Taiwan. Moreover, Kim et al. (Kim et al., 2018) reported that it is necessary to determine standardized weak HGS reference values, since there are variations in HGS depending on race, sex, and age. On the other hand, Lee et al. (Lee et al., 2016b) reported that the inconsistency between several studies analyzing the relationship between grip strength and MetS risk factors, reflected the discrepancy between whether or not weight was adjusted in the analysis. The HGS is closely related to body mass, and using HGS without a correction for body mass can contribute to the above contradictory results (Fowles et al., 2014; Keevil and Khaw, 2014). More recent studies have used the relative HGS, which is calculated as the HGS divided by the body mass index (BMI). The relative grip strength is comparable to laboratory based approaches and may increase the translational value of grip strength as a prognostic tool (Lawman et al., 2016). Using this newer standardized measurement, several studies have determined that the relative HGS was negatively associated with (MetS)(Lee et al., 2016b; Li et al., 2018; Yi et al., 2018).
However, few studies have attempted to explain the effects of grip strength on the possibility of future CVD in Korean middle-aged adults. Furthermore, no study has compared the cut-offs that have been reported to identify muscle weakness and the defined HGS indicators as a variable.
Therefore, the main purpose of this study was to examine whether weak grip strength is a risk factor for the development of CVD in Korean elderly adults. To this end, we investigated which index is most suitable for predicting CVD, using QIC values and ROC curve, and
6
suggest the optimal cut points based on the HGS index. We also identified the effects of weak HGS, as determined by applying optimal cut point, on the development of CVD and how these associations vary with age in this study population.
II. Theoretical Considerations
A. Sarcopenia
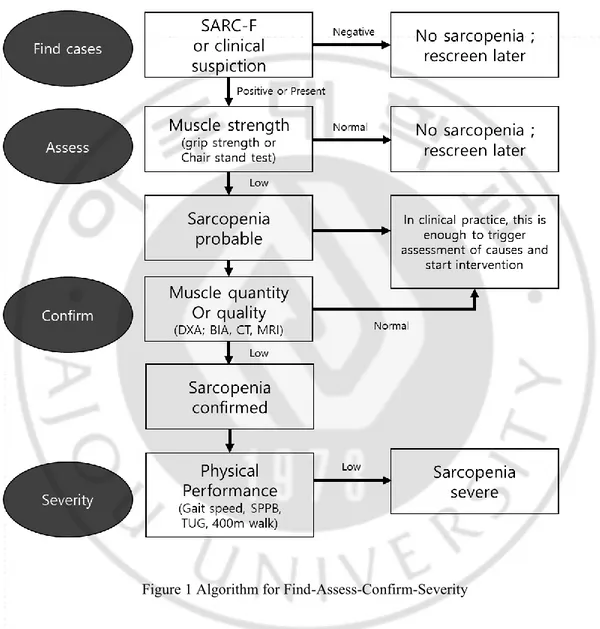
Sarcopenia is the decline of the skeletal muscle mass associated with age and/or function. The word sarcopenia comes for flesh, penia, for loss from the Greek roots sarx, and was first used in 1988 at a meeting held in Albuquerque, USA, to discuss health and nutrition assessments in older populations, to refer to the age-related decline in muscle mass and function, affecting ambulation, mobility, nutrient intake, status, and operational independence (Rosenberg, 1997). The term has also been used to indicate the co-occurrence of the losses of skeletal muscle mass and strength in advanced age(Cruz-Jentoft and Landi, 2014). In early 2018, EWGSOP2 (European Working Group for Sarcopenia Older People) updated the original definition of sarcopenia in order to reflect the scientific and clinical evidence that has been established in the last decade. They reported that the main parameter of sarcopenia was low muscle strength, which currently represents the most reliable measure for muscle function. Sarcopenia is likely if low muscle strength is detected, and a diagnosis is made from low muscle mass or quality. In cases of low muscle strength, low muscle
7
quality, and low physical performance, sarcopenia is considered to be serious (Figure 1)(Cruz-Jentoft et al., 2019).
Figure 1 Algorithm for Find-Assess-Confirm-Severity
From a pathophysiological point of view, sarcopenia may be regarded as a chronic or acute muscle insufficiency(Cruz-Jentoft and Landi, 2014). After 40 years of age, healthy adults lose about 8% of their muscle mass every 10 years. Therefore, by 40–70 years of age, the
8
average muscle loss of healthy adults is 24%, of which 15% is in the 10 years after 70 (Grimby and Saltin, 1983). In a recent systematic review, according to the European Working Group on Sarcopenia in Older People (EWGSOP) criteria (Cruz-Jentoft et al., 2010a), the prevalence of sarcopenia was 1%–29% in the community, 14%–33% in a long-term care setting, and 10% in acute hospital care, and there are significant differences by age and region (Cruz-Jentoft et al., 2014).
EWGSOP2 has recently updated its sarcopenia case discovery, diagnosis, and severity determination algorithm. The reasoning behind this update is both logical and practical: First, the algorithm must be compatible with the EWSOP2 definition of sarcopenia, and second, it must be easy to use in clinical environments. They recommend a Find-Assess-Confirm-Severity (F-A-C-S) pathway for use across clinical and study practices. In clinical practice, EWGSOP2 recommends that people with suspected sarcopenia should answer the SARC-F questionnaire. They also recommend using grip strength and a chair stand to determine low muscle strength. In order to generate evidence that confirms a low muscle quality, EWGSOP2 recommends an evaluation of muscles by DXA and BIA methods in regular clinical care, and by DXA, MRI, or CT in research or specialty care for persons at high risk of adverse outcomes. They advise physical performance measures (SPPB, TUG, and 400 m walking tests) to evaluate sarcopenia severity. Sarcopenia is now officially recognized as a muscle disease with an ICD 10-MC diagnostic code that can be used to charge for treatments in some countries(Vellas et al., 2018).
9
B. Sarcopenia cut-off points for muscle weakness
1.
The FNIH Sarcopenia Project (2014)The FNIH (Foundation for the National Institutes of Health Sarcopenia Project) used nine data sources involving community-dwelling elderly individuals: Age, Gene/Environment Susceptibility-Reykjavik Study; a series of six clinical trials, Framingham Heart Study; Boston Puerto Rican Health Study; Health, Aging, and Body Composition; Invecchiare in Chianti; Osteoporotic Fractures of Men Study; Rancho Bernardo Study; and Study of Osteoporotic Fractures. Conference participants provided feedback through surveys and breakout groups. The pooled sample consisted of 26,625 people (men: 75.2 ± 6.1 and women: 78.6 ± 5.9). Conference attendees highlighted the importance of evaluating the influence of body mass on cut-off points. The final recommendation of cut points for muscle weakness
using grip strength were < 26 kg for men and < 16 kg for women,
ba
sed on the analysespresented in this series. (Studenski et al., 2014)
2. The consensus report of the Asian Working Group for Sarcopenia (2014)
Asian Working Group for Sarcopenia (AWGS)(Chen et al., 2014) had the aim of promoting sarcopenia research in Asia; they collected the best available evidence of sarcopenia research from Asian countries in order to effectively establish the consensus for
10
sarcopenia should be described as low muscle mass plus low muscle strength and/or low physical performance, and they also recommended outcome indicators for further research, as well as the conditions under which sarcopenia should be assessed. In addition to sarcopenia screening for community-dwelling older people, the AWGS recommends sarcopenia assessment in certain clinical conditions and healthcare settings in order to facilitate the implementation of sarcopenia diagnosis in clinical practice. They also recommended that cut-off values for muscle strength should be determined by using a HGS
< 26 kg for men and < 18 kg for women. However, they also indicated that a number of
challenges remained given that Asia is made up of a great number of ethnicities.
3. The cut-off value for sarcopenia in Korean adults using KNHANES VI (2017)
Yoo et al(Yoo et al., 2017) conducted a study that aimed to report the age- and gender-specific distribution of the HGS using data from the Korea National Health and Nutrition Examination Survey (KNHANES) VI-3 (2015) survey, and determine cut-off values for low muscle strength of HGS of Koreans. Of a total of 7,380 participants, 4,553 were subjected to HGS measurements; these included 1,997 men and 2,556 women with a mean age of 49.3 years (range, 19–80 years; mean men, 49.0 years; mean women, 49.5 years). Handgrip strength was measured using a digital hand dynamometer, and was defined as the maximal measured grip strength of the dominant hand. The cut-off value for low muscle strength was
defined as the lower 20th percentile of HGS of the study population. They reported that the
11
values of HGS in the elderly were determined to be 28.6 kg for men and 16.4 kg for women.
4. European consensus on definition and diagnosis (2018)
In 2010, the European Working Group on Sarcopenia in Older People (EWGSOP) (Cruz-Jentoft et al., 2019) published a sarcopenia definition that was used worldwide; this definition fostered advances in identifying and caring for people at risk of, or with, sarcopenia (Cruz-Jentoft et al., 2010a) In early 2018, the Working Group met again (EWGSOP2) to determine whether an update to the definition of sarcopenia was justified. This meeting took place 10 years after the gathering of the original EWGSOP, and an update was deemed necessary in order to reflect the scientific evidence that had since accumulated(Cruz-Jentoft et al., 2019). In the decade since EWGSOP’s initial work, researchers and clinicians have explored many aspects of sarcopenia. Moreover, expert groups worldwide have published complementary definitions of sarcopenia (Morley et al., 2011; Chen et al., 2014) and researchers have made remarkable strides in understanding muscle and its roles in health and in disease (Frontera and Ochala, 2015; Argiles et al., 2016) EWGSOP2 focused on low muscle strength as a key characteristic of sarcopenia, the use of low muscle quantity and quality to confirm the diagnosis of sarcopenia, and the identification of poor physical performance to be indicative of severe sarcopenia. Furthermore, they also reported clear cut-off points for the measurements of variables that identify and characterize sarcopenia. In terms of the HGS cut-off for weakness of muscle strength, they recommended ≤ 27 kg for men and ≤ 16 kg for women based on T-score of ≤ -2.5.
12
C. Indices of determined Hand Grip Strength (HGS)
A wide variety of tests and tools are now available for the characterization of sarcopenia, both in practice and in research (Reginster et al., 2016). Tool selection may depend upon the patient (disability, mobility), access to technical resources in the healthcare test setting (community, clinic, hospital, or research center), or the purpose of testing (progression monitoring or monitoring rehabilitation and recovery). Choosing tools for sarcopenia case finding and for the measurement of muscle strength, muscle mass and physical performance in clinical practice(Cruz-Jentoft et al., 2019) The best validated techniques to measure muscle strength are HGS and knee flexion/extension testing. Grip strength is a good, simple, and inexpensive measure of muscle strength. A well-studied model using a handheld dynamometer with reference populations can be a reliable surrogate of more sophisticated measures of muscle strength of either upper or lower extremities. Indeed, HGS is strongly related to lower extremity muscle power and knee extension torque, as well as to calf cross-sectional muscle area(Lauretani et al., 2003). The technique has received validation in older populations, and is related to relevant outcomes, such as incident disability in the activities of daily living (ADL)(Cruz-Jentoft et al., 2010a) . However, different HGS indicators, such as dominant HGS and absolute HGS with or without adjustment with weight (HGS/Wt) or height (HGS/Ht), have been used in each study. Furthermore, more recent studies have used the relative HGS, which is calculated as HGS divided by the BMI; as yet, there is no standard HGS index (Yi et al., 2018).
13
14
D. Frailty
Frailty is a commonly used term which denotes a clinical entity in older persons(Fried et al., 2001). It is an important geriatric syndrome, with a global prevalence of 4.9%–27.3% (Choi et al., 2015) and is defined as an age-related decrease in the physiological reserve required to maintain biological homeostasis and increased vulnerability to stressors. Recognition of physical frailty is important for clinicians because it poses a greater risk of adverse health outcomes including falls, increased morbidity, physical dependence, hospitalization, and death (Fried et al., 2001). Thus, frailty has become one of the most significant clinical entities to afflict the elderly population. The most widely used diagnostic criteria are those initially proposed by Fried et al. and the Cardiovascular Health Study Research Group (Fried et al., 2001). These criteria include three or more of the following five: 1) Weight loss (10 lb in the past year), 2) self-reported exhaustion, 3) weakness (decreased HGS), 4) slow walking speed (> 6 to 7 s for 15 ft), or 5) decreased physical activity (males < 383 kcal, females < 270 kcal)(Fried et al., 2001). However, a number of other definitions of frailty exist, and no consensus, literature based definition has yet been reached. The presence of frailty has been associated with increased all-cause mortality(Cooper et al., 2010; Masel et al., 2010) and increased incident CVD (Newman et al., 2006), as well as poor survival after cardiac and surgical procedures (Chainani et al., 2016). The objective components of frailty syndrome (HGS and gait speed) have also been linked with an increased risk of all cause-mortality and adverse
15
health outcomes.
In elderly patients diagnosed with diabetes, frailty can be more common than in peers without diabetes (Group, 2003). Many studies report that frail individuals with diabetes have a higher mortality than non-frail individuals with diabetes. In addition, elderly patients with diabetes may have an increased risk for functional dependency and frailty (Araki and Ito, 2009). The frailty prevalence of 32% to 48% in persons > 65 years with diabetes is much higher than the 5% to 10% seen in the general population of the same age (Wang et al., 2014), thus, elderly patients with diabetes require screening for frailty(Won and Kim, 2016). In general, the association between higher serum cholesterol levels and increased CVD risk is attenuated in old age and may be reversed(Schatz et al., 2001; Sanford and Morley, 2014). An apparent increase in mortality associated with low cholesterol level in older people can be related to malnutrition, frailty, and chronic diseases, which simultaneously decreases the cholesterol level and increases the mortality risk(Kronmal et al., 1993; Corti et al., 1997).
E. Association between handgrip strength (HGS) and
cardiovascular disease (CVD)
16
Prospective Urban-Rural Epidemiology (PURE) study, a large, longitudinal population study, during a median follow-up period of 4 years, and among 142,861 participants, after adjustment, the association between grip strength and each outcome, with the exceptions of cancer and hospital admission due to respiratory illness, was similar across country-income strata. Grip strength was inversely associated with all-cause mortality (hazard ratio per 5 kg reduction in grip strength, 1.16; 95% CI, 1.13– 1.20; p < 0.0001), cardiovascular mortality (1.17; 1.11–1.24; p < 0.0001), non-cardiovascular mortality (1.17; 1.12–1.21; p < 0.0001), myocardial infarction (1.07; 1.02–1.11; p = 0.002), and stroke (1.09; 1.05–1.15; p < 0.0001). In addition, HGS was a stronger predictor of all-cause and cardiovascular mortality than systolic blood pressure (Leong et al., 2015)
Meta-analysis of a prospective cohort (Wu et al., 2017), using data obtained from 42 studies, including 3,002,203 participants, for the lowest versus highest category of grip strength, the HRs (95% CIs) were 1.41 (1.30–1.52) for all-cause mortality, 1.63 (1.36–1.96) for CVDs, and 0.89 (0.66–1.20) for cancer. The HRs (95% CIs) with a per-5 kg decrease in grip strength were 1.16 (1.12–1.20) for all-cause mortality, 1.21 (1.14–1.29) for CVDs, 1.09 (1.05–1.14) for stroke, 1.07 (1.03–1.11) for coronary heart disease, and 1.01 (0.98–1.05) for cancer. The observed associations did not differ by sex, and remained after excluding participants with either CVDs or cancer at baseline
17
A recent study reported that HGS is strongly and inversely related to all-cause mortality and the incidence of CVD, respiratory disease, chronic obstructive pulmonary disease, all cancer and subtypes of cancer, including colorectal, lung, and breast cancer, and with the associations being modestly stronger in the younger age groups. In women and men, hazard ratios per 5-kg lower grip strength were higher (all at p < 0.05) for all-cause mortality (1.20, 95% confidence interval, 1.17–1.23, and 1.16, 1.15–1.17, respectively) and cause specific mortality from CVD (1.19, 1.13– 1.25, and 1.22, 1.18–1.26, respectively), all respiratory disease (1.31, 1.22–1.40, and 1.24, 1.20–1.28, respectively), chronic obstructive pulmonary disease (1.24, 1.05– 1.47, and 1.19, 1.09–1.30, respectively), all cancer (1.17, 1.13–1.21, and 1.10, 1.07– 1.13, respectively), colorectal cancer (1.17, 1.04–1.32, and 1.18, 1.09–1.27, respectively), lung cancer (1.17, 1.07–1.27, and 1.08, 1.03–1.13, respectively), and breast cancer (1.24, 1.10–1.39, women only) (Celis-Morales et al., 2018).
In a cross sectional study (Lee et al., 2018) using the Korea National Health and Nutrition Examination Survey (2014–2016), that included 8,576 participants aged 40 to 79 years (men: 3807 and women: 4769), the individual CVD risk was evaluated by calculating the atherosclerotic cardiovascular disease (ASCVD) risk score and the Framingham risk score (FRS) in subjects aged 40 to 79 years without prior CVD. Multivariate linear regression analysis revealed a significant inverse association (in both men and women) between relative HGS and cardiovascular risk factors, including blood pressure, levels of fasting glucose and triglycerides, waist
18
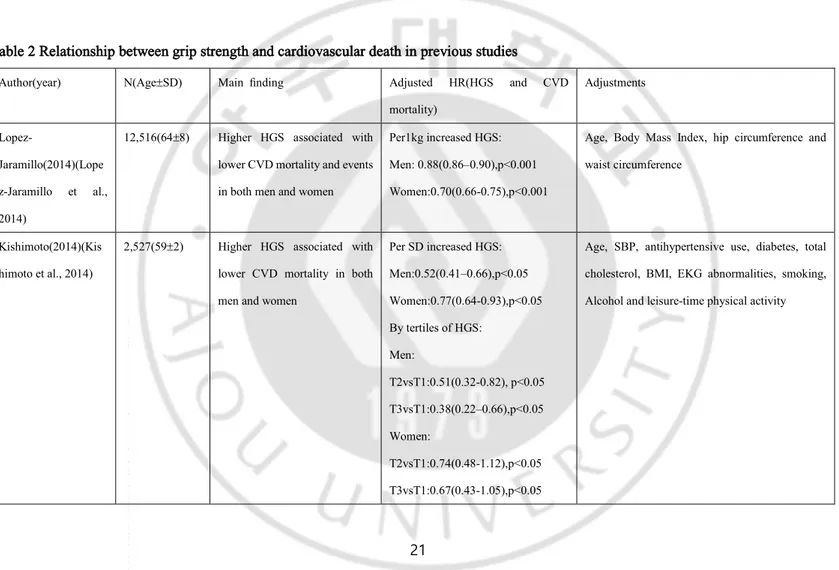
circumstance, FRS, high sensitivity C-reactive protein levels, and ASCVD risk. A significant positive association between relative handgrip and a low level of high density cholesterol levels in both men and women was identified. In both men and women, subjects in the lowest quartile of HGS had an increased risk of CVD compared to those in the highest quartile (OR range, 2.05–3.03). Furthermore, a systematic review assessing the relationship of grip strength and cardiovascular mortality reported that decreased HGS was associated with increased mortality in the majority of studies (8/12) (Table 2)(Chainani et al., 2016)
A study that reported the relationship between HGS and CV events, and all-cause mortality based on an analysis of the Outcomes Reduction with an Initial Glargine Intervention (ORIGIN) clinical trial, including 12,516 individuals (35% women) of mean (SD) age 63.6 (7.8) years, had a baseline HGS and were followed for a median of 6.2 years. This study showed that higher HGS is significantly associated with a lower incidence of death from cardiovascular events such as myocardial infarction, stroke or CV death myocardial infarction, stroke and CV death (CV death, per 1 kg increased HGS: men, 0.88 (0.86–0.90), p < 0.001; women, 0.70 (0.66–0.75), p < 0.001; stroke, per 1 kg increased HGS: men, 0.90 (0.87–0.93), p < 0.001; women, 0.84 (0.77–0.90), p < 0.001; MI, per 1 kg increased HGS: men, 0.97 (0.94–1.00), p = 0.04; women, 0.79 (0.72–0.86), p < 0.001; heart failure, per 1 kg increased HGS: men, 0.89 (0.86–0.91), p < 0.001; women, 0.70 (0.64–0.76), p < 0.001)(Lopez-Jaramillo et al., 2014)
19
The Hisayama study, which investigated the association between HGS and risk of cause-specific death in the middle-aged and older Japanese population, followed a total of 2,527 community-dwelling Japanese (1,064 men and 1,463 women) aged ≥ 40 years for a period of 19 years. During the follow-up period, 783 participants died, of whom 235 died of CVD, 249 of cancer, 154 of respiratory disease, and 145 of other causes. They demonstrated that higher levels of HGS were significantly associated with a decreased risk of cardiovascular death, respiratory death, and death from other causes in the middle-aged and elderly (CV death, men, HR = 0.52; 95% CI, 0.41– 0.66; p < 0.05, and women, HR = 0.77; 95% CI, 0.64–0.93; p < 0.05)(Kishimoto et al., 2014).
Several studies have reported no association between HGS and cardiovascular death. A prospective cohort study in Taiwan (Chen et al., 2012), that aimed to determine the prognostic value of HGS and walking speed in predicting the cause-specific mortality for older men, recruited all subjects 75 years and older in northern
Taipei in March of 2008 and followed to December of 2010.During the study period,
99 participants died and the baseline HGS and walking speed were significantly lower than those of the survivors (p both < 0.001). Cox survival analysis showed that the lowest quartile of HGS did not significantly predict cardiovascular death when they fully adjusted for covariates (vs Q1, Q2: HR = 0.90; 95% CI, 0.28–2.87; Q3: HR = 0.63; 95% CI, 0.14–2.24; Q4: HR = 0.70; 95% CI, 0.19–2.59). Another longitudinal
20
study (McDermott et al., 2012), which analyzed whether lower calf muscle density and poorer upper and lower extremity strength were associated with higher mortality rates in men and women with peripheral arterial disease, included 238 participants with peripheral arterial disease attending their fourth annual follow-up visit in the original Walking and Leg Circulation Study (WALCS), and 240 peripheral arterial disease participants newly identified for WALCS II. At baseline, participants underwent measurement of calf muscle density with computed tomography, in addition to knee extension power, isometric knee extension, plantar flexion, and HGS measures. They reported that lower calf muscle density was associated with higher all-cause and CVD mortality among participants with PAD, but that there was no
significant association of HGS with CVD mortality in men (below median vs above
21
Table 2 Relationship between grip strength and cardiovascular death in previous studies
Author(year) N(Age±SD) Main finding Adjusted HR(HGS and CVD mortality) Adjustments Lopez-Jaramillo(2014)(Lope z-Jaramillo et al., 2014)
12,516(64±8) Higher HGS associated with lower CVD mortality and events in both men and women
Per1kg increased HGS: Men: 0.88(0.86–0.90),p<0.001 Women:0.70(0.66-0.75),p<0.001
Age, Body Mass Index, hip circumference and waist circumference
Kishimoto(2014)(Kis himoto et al., 2014)
2,527(59±2) Higher HGS associated with lower CVD mortality in both men and women
Per SD increased HGS: Men:0.52(0.41–0.66),p<0.05 Women:0.77(0.64-0.93),p<0.05 By tertiles of HGS: Men: T2vsT1:0.51(0.32-0.82), p<0.05 T3vsT1:0.38(0.22–0.66),p<0.05 Women: T2vsT1:0.74(0.48-1.12),p<0.05 T3vsT1:0.67(0.43-1.05),p<0.05
Age, SBP, antihypertensive use, diabetes, total cholesterol, BMI, EKG abnormalities, smoking, Alcohol and leisure-time physical activity
22 Chen(2012)(Chen et al., 2012) 558(82±5) No association of HGS with CVD mortality HGS(vsQ1): Q2:0.90(0.28–2.87); Q3:0.63(0.14–2.24); Q4:0.70(0.19–2.59)
Age, height, BMI, waist circumference, current smoking, exercise, hypertension, diabetes mellitus, proteinuria, walking speed, hemoglobin, platelet,
neutrophil count,
lymphocytecount,HbA1C,alaninetransaminase, creatinine, albumin, uric acid, triglycerides, total cholesterol and HDL
McDermott2012(McD ermott et al., 2012)
233(74±8) No association of HGS with CVD mortality in all male population.
Below median vs above median HGS: 1.63(0.47–5.68)
Age, sex, race, BMI, ABI, physical activity, comorbidities and smoking
Rosero- Bixby2012(Rosero-Bixby and Dow, 2012)
2,313(78±10) HGS predicted CVD mortality in females in fully adjusted model
Per SD increased in HGS in females: 0.60(inferred from text)
Age, gender, HbA1c, SBP, total cholesterol, HDL, DHEAS, CRP, walking distance, pulmonary peak flow, waist circumference, disability scale, cancer diagnosis, involuntary weight loss, smoking. Izawa2009(Izawa et
al., 2009)
148(68±12) HGS associated with CVD mortality
23
III. Method
A. Study Population
The study population was derived from a nationwide panel survey, the Korean Longitudinal Study of Aging (KLoSA), on individuals over the age of 45 years. The KLoSA data was gathered for the purpose of preparing for the aged society in terms of system reform and policy decision. The data was composed of seven categories including population, family, health, employment, income, wealth, subjective expectation, and life expectation. The KLoSA is a biennial survey of nationally-representative Koreans aged 45 years or older, excluding institutionalized people and residents of Che-Ju Island, used to build-up the basic data needed to devise effective social and economic policies in order to address the trends in the population ageing process. Participants were selected randomly using a multistage, stratified probability sampling design to create a nationally representative sample. Sampling was conducted by sorting the population surveyed in a given area and 15 residential types according to the order of the administrative codes, and then extracting the assigned number by applying a systematic extraction method (the multistage and stratified sampling method). In the first baseline survey in 2006, 10,254 individuals in 6,171 households (1.7 per household) were interviewed, and results demonstrated that there were 292 individuals with cancer. The second survey, in 2008, followed up with
24
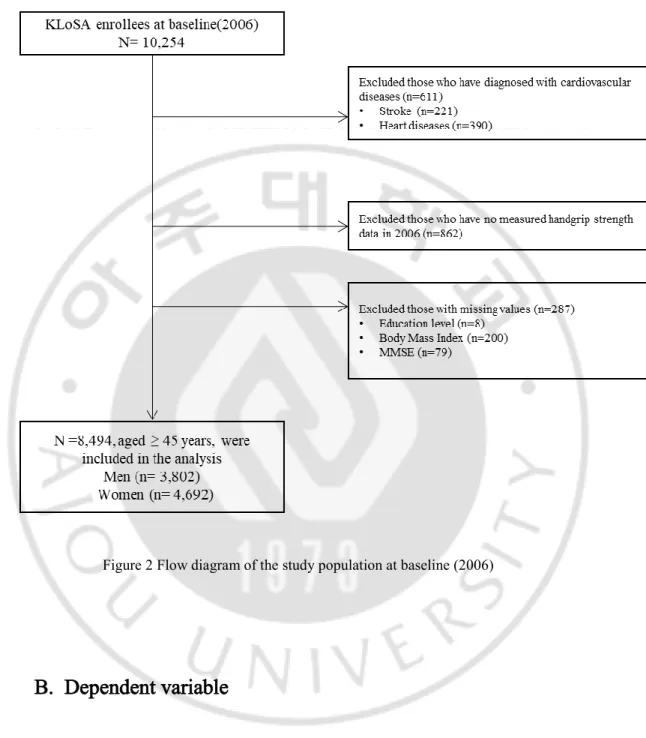
8,675 subjects, who represented 86.6% of the original panel. The third survey, in 2010, followed up with 8,229 subjects, who represented 81.7% of the original panel, the fourth survey, in 2012, followed up with 7,813 subjects, who represented 80.1% of the original panel, and the fifth survey, in 2014, followed up with 8,387 subjects (including 920 who newly participated in the sample), who represented 80.4% of the original panel. The sixth survey, in 2016, followed up with 9,913 subjects (including 878 who newly participated in the sample), who represented 79.6% of the original panel. Out of all the public data available in Korea, the KLoSA was considered to be the most suitable data for the analysis involved in the current study. In this study, 8,424 participants were included in the analysis at baseline, excluding those diagnosed with heart diseases and stroke, and those with missing values for the variables of interest (Figure 2). The design and protocol of this study were approved by the Institutional Review Board (IRB) of Ajou University Hospital (IRB No. AJIRB-SBR-EXP-18-474).
25
Figure 2 Flow diagram of the study population at baseline (2006)
B. Dependent variable
Cardiovascular disease, which was a dependent variable in this study, was defined as the prevalence of CVD in patients with heart disease (angina, myocardial infarction,
26
congestive heart failure), and stroke, which could be extracted from the KLoSA data by referring to previous studies(Leong et al., 2015; Byung-Taek Oh, 2017). The KLoSA data has a structure whereby it is possible to skip the questionnaire in the next wave if the previous wave has confirmed chronic diseases. Therefore, it is unlikely that a disease was recorded incorrectly (Institute, 2007). The presence of CVD, such as heart diseases and stroke, is assessed in response to the questionnaire, and the answer depends on whether the subjects are diagnosed by a doctor, not by the individual’s own judgment.
C. Measurement of handgrip strength (HGS)
Handgrip strength was measured by a handgrip dynamometer (Model number: NO6103, Manufacturer: TANITA, Japan). The test was performed in a sitting position with the elbow flexed at 90˚ on both the right and the left sides. The grip strength measurement was performed in order to determine whether or not a respondent was in a state in which the measurement could be made, and was not performed when the user refused, if one of the hands was injured, or if the user was ill. In this study, we defined dominant HGS as the maximal HGS of the dominant hand, whereas absolute HGS was calculated as the summation of the maximal reading from each hand using measured HGS values, and was expressed in kilograms. The relative HGS was defined as the absolute HGS divided by the BMI(Lawman et al., 2016; Yi et al., 2018). We applied various cut-off points proposed by the sarcopenia
27
guidelines (Chen et al., 2014; Studenski et al., 2014; Yoo et al., 2017; Cruz-Jentoft et al., 2019) as a criterion of weak muscle strength, using HGS to compare to the optimal cut-off value of this study.
D. Covariates
We selected the covariates of this study by referring to previous studies (Byung-Taek Oh, 2017; Kim et al., 2019) that reported the factors related to decreased HGS in a Korean elderly population. Age, sex, marital status, education level, residential region, and economic activity were considered as sociodemographic variables. The levels of education were categorized as ‘less than elementary school’, ‘middle school graduate’, ‘high school graduate’, or ‘college graduate or beyond’. Two age group
categories were used as follows: < 64 and ≥ 65 years.Marital status was classified
as married or unmarried (including divorce and separation). The residential regions were categorized into metropolitan (Seoul), urban (administrative divisions of a city: Daejeon, Daegu, Busan, Incheon, Kwangju, or Ulsan), or rural (not classified as administrative divisions of a city). Current economic activity was categorized as either ‘yes’ or ‘no’. In terms of health behaviors, we selected smoking, alcohol consumption, and regular exercise; smoking was classified into ‘non-smokers’, who never smoked, ‘former smoker’, and ‘smoker’. Alcohol consumption was divided into two groups according to the current drinking status, and regular exercise was divided into two groups based on more than one exercise per week.
28
The BMI, ADL, and Mini-Mental State Examination (MMSE) were included in the health-related variables. Body mass index was calculated from self-reported data on weight and height during the first wave; the study population was divides into three
groups as follows: Underweight (BMI of less than 18.5 kg/m2) , normal (BMI of 18.5–
24.9 kg/m2), and overweight (BMI of 25 kg/m2 or over). Activities of daily living is
a measure of basic daily living skills, including changing clothes, watering/brushing/hair-drying, bathing/showering, eating, going out of the room, using the toilet, and is measured according to whether the individual requires help to perform the activities. If they need some help in their everyday life, or if they need help altogether, they are set to '1'. If they do not need any help, they are set to
'0'(Institute, 2007).TheADL index is classified as normal at 0 point, and it is accepted
that more than 1 point represents an individual who is limited in daily life practice. Cognitive impairment was determined by the K-MMSE score on the first wave. The K-MMSE score is used to determine cognitive function from questions designed to assess various categories of cognitive function, such as time and place, orientation, registration, attention and calculation, memory recall, language, and visual construction. The MMSE score is calculated based on the summation of the score of each category. A score of 17 or less indicates a ‘suspicion of dementia’, a value of 18 or more and 23 or less indicates ‘cognitive decline’, and 24 or more is classified as
‘normal’. In addition, we included diabetes and hypertension as a health condition
29
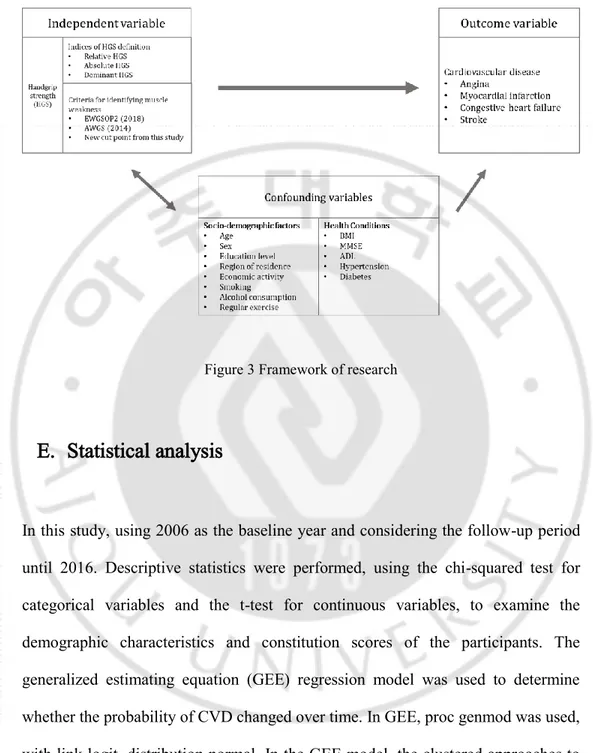
Figure 3 Framework of research
E. Statistical analysis
In this study, using 2006 as the baseline year and considering the follow-up period until 2016. Descriptive statistics were performed, using the chi-squared test for categorical variables and the t-test for continuous variables, to examine the demographic characteristics and constitution scores of the participants. The generalized estimating equation (GEE) regression model was used to determine whether the probability of CVD changed over time. In GEE, proc genmod was used, with link logit, distribution normal. In the GEE model, the clustered approaches to analysis, controls for the characteristics of individuals that change over time, such as
30
confounding variables. The clustering can be expressed in terms of the correlation among the measurements in units within the same cluster. The Quasi-Akaike Information Criterion (QIC) was calculated in order to compare the best fit among the three HGS indices. Pearson’s correlation coefficients were calculated to relate each HGS index versus age at follow-up, and ROC curves were used to HGS indices in sensitivity and specificity to predict CVD. All analyses were performed using SAS software, version 9.4 (SAS Institute, Cary, NC, USA), and statistical significance was considered at the level of p < 0.05.
31
IV. Results
A. Characteristics of Participants
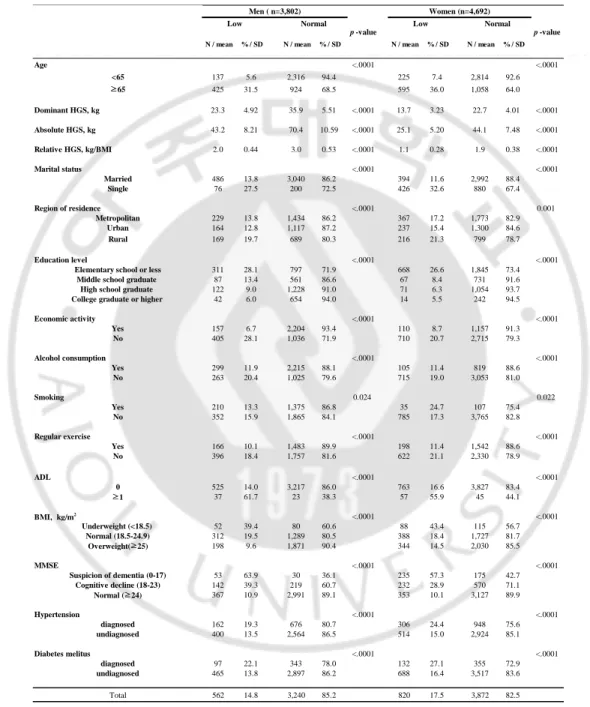
The general characteristics of the participants according to the muscle weakness (lowest 20%) at baseline are shown in Table 3. Among a total of 8,494 subjects, 3,802 (44.8%) were men, and 4,692 (55.2%) were women. The average age of participants was 60.7 ± 10.6 years (range, 45–98 years; men, 60.6 ± 10.3 years; women, 60.7 ± 10.9 years). Among the total subjects, 1,382 (16.3%) had weak HGS, 562 (14.8%) men and 820 (17.5%) women. In both men and women, the proportion of low muscle strength in those 65 years and over was significantly higher than those under 65 years of age (men, 31.5% vs 5.6%; p < 0.0001; and women: 36.4% vs 7.4%; p < 0.0001). In both men and women, The means of the dominant HGS, absolute HGS, and relative HGS with normal muscle strength were significantly higher than those of the low muscle strength group (men: DHGS 35.9 ± 5.5 kg vs 23.3 ± 5.0 kg, p < 0.0001; AHGS 70.4 ± 10.6 kg vs 43.2 ± 8.21 kg, p < 0.0001; RHGS 3.0 ± 0.5 vs 2.0 ± 0.4, p = 0.001; women: DHGS 22.7 ± 4.0 kg vs 13.7 ± 3.2 kg, p < 0.0001; AHGS 44.1 ± 7.5 kg vs 25.1 ± 5.2 kg, p < 0.0001; RHGS 1.9 ± 0.4 vs 1.1 ± 0.3, p < 0.001, respectively). In terms of chronic diseases that affect CVD, the distribution of low HGS with hypertension and diabetes was significantly higher in men than in the undiagnosed
32
0.0001), and the trend was similar in women (hypertension: 24.4% vs 15.0%, p<
0.0001; diabetes: 27.1% vs 16.4, p< 0.0001). In addition, there was a significance
difference in marital status, education level, area of residence, economic activity, regular exercise, smoking status, alcohol consumption, the ADL score, and the MMSE score among the weak and normal in both sexes (all p values < 0.05).
33
Table 3 General characteristics of participants for analysis according to low handgrip strength by sex at baseline (2006)
N / mean % / SD N / mean % / SD N / mean % / SD N / mean % / SD
Age <.0001 <.0001 <65 137 5.6 2,316 94.4 225 7.4 2,814 92.6 ≥65 425 31.5 924 68.5 595 36.0 1,058 64.0 Dominant HGS, kg 23.3 4.92 35.9 5.51 <.0001 13.7 3.23 22.7 4.01 <.0001 Absolute HGS, kg 43.2 8.21 70.4 10.59 <.0001 25.1 5.20 44.1 7.48 <.0001 Relative HGS, kg/BMI 2.0 0.44 3.0 0.53 <.0001 1.1 0.28 1.9 0.38 <.0001 Marital status <.0001 <.0001 Married 486 13.8 3,040 86.2 394 11.6 2,992 88.4 Single 76 27.5 200 72.5 426 32.6 880 67.4 Region of residence <.0001 0.001 Metropolitan 229 13.8 1,434 86.2 367 17.2 1,773 82.9 Urban 164 12.8 1,117 87.2 237 15.4 1,300 84.6 Rural 169 19.7 689 80.3 216 21.3 799 78.7 Education level <.0001 <.0001
Elementary school or less 311 28.1 797 71.9 668 26.6 1,845 73.4
Middle school graduate 87 13.4 561 86.6 67 8.4 731 91.6
High school graduate 122 9.0 1,228 91.0 71 6.3 1,054 93.7
College graduate or higher 42 6.0 654 94.0 14 5.5 242 94.5
Economic activity <.0001 <.0001 Yes 157 6.7 2,204 93.4 110 8.7 1,157 91.3 No 405 28.1 1,036 71.9 710 20.7 2,715 79.3 Alcohol consumption <.0001 <.0001 Yes 299 11.9 2,215 88.1 105 11.4 819 88.6 No 263 20.4 1,025 79.6 715 19.0 3,053 81.0 Smoking 0.024 0.022 Yes 210 13.3 1,375 86.8 35 24.7 107 75.4 No 352 15.9 1,865 84.1 785 17.3 3,765 82.8 Regular exercise <.0001 <.0001 Yes 166 10.1 1,483 89.9 198 11.4 1,542 88.6 No 396 18.4 1,757 81.6 622 21.1 2,330 78.9 ADL <.0001 <.0001 0 525 14.0 3,217 86.0 763 16.6 3,827 83.4 ≥1 37 61.7 23 38.3 57 55.9 45 44.1 BMI, kg/m2 <.0001 <.0001 Underweight (<18.5) 52 39.4 80 60.6 88 43.4 115 56.7 Normal (18.5-24.9) 312 19.5 1,289 80.5 388 18.4 1,727 81.7 Overweight(≥25) 198 9.6 1,871 90.4 344 14.5 2,030 85.5 MMSE <.0001 <.0001 Suspicion of dementia (0-17) 53 63.9 30 36.1 235 57.3 175 42.7 Cognitive decline (18-23) 142 39.3 219 60.7 232 28.9 570 71.1 Normal (≥24) 367 10.9 2,991 89.1 353 10.1 3,127 89.9 Hypertension <.0001 <.0001 diagnosed 162 19.3 676 80.7 306 24.4 948 75.6 undiagnosed 400 13.5 2,564 86.5 514 15.0 2,924 85.1 Diabetes melitus <.0001 <.0001 diagnosed 97 22.1 343 78.0 132 27.1 355 72.9 undiagnosed 465 13.8 2,897 86.2 688 16.4 3,517 83.6 Total 562 14.8 3,240 85.2 820 17.5 3,872 82.5
Numeric parameters are expressed as mean and standard deviation in parentheses Categorical parameters are expressed as counts and percentages in parentheses
Cut-off value for low handgrip strength was defined as the lowest 20% of HGS of the study population. ( <26.1 kg for men and <16.0 kg for women, respectively). Acronyms: BMI, body mass index; MMSE, Mini-mental state examination; SD, standard deviation; ADL activities of daily living
p -value
Women (n=4,692) Men ( n=3,802)
Low Normal Low Normal
34
B. Relative handgrip strength (HGS) was a better predictor for
cardiovascular disease (CVD) than dominant or absolute
handgrip strength
Table 4 shows the ORs and 95% CIs for CVD and the best fit model using the Quasi-Akaike Information Criterion (QIC) among the three HGS indices in men. After adjustment for age, education level, marital status, region, economic activity, alcohol consumption, smoking, exercise, ADL, MMSE, hypertension, and diabetes, the relative HGS was inversely associated with CVDs (CVDs: OR per 1 SD increase in relative HGS = 0.839; 95% CI, 0.783–0.898; p < 0.0001; heart diseases: OR per 1 SD increase in relative HGS = 0.904; 95% CI, 0.835–0.979; p = 0.013; stroke: OR per 1 SD increase in relative HGS = 0.797; 95% CI, 0.716–0.887; p < 0.0001). The dominant and absolute HGS were further adjusted for BMI and used to analyze the relationship with CVDs. The dominant and absolute HGS were also inversely associated with CVDs in men (dominant HGS: OR = 0.984; 95% CI, 0.978–0.990; p < 0.0001; absolute HGS: OR = 0.991; 95% CI, 0.988–0.994; p < 0.0001).
The QIC values, which are indicators of best fit, were almost the same for the three indicators, but the relative HGSs were the best among them in both men and women (CVDs: relative HGS = 9,120, dominant HGS = 9,131, absolute HGS = 9,121; heart diseases: relative HGS = 7,018, dominant HGS = 7,021, absolute HGS = 7,020; stroke:
35
relative HGS = 4,819, dominant HGS = 4,834, absolute HGS = 4,826).
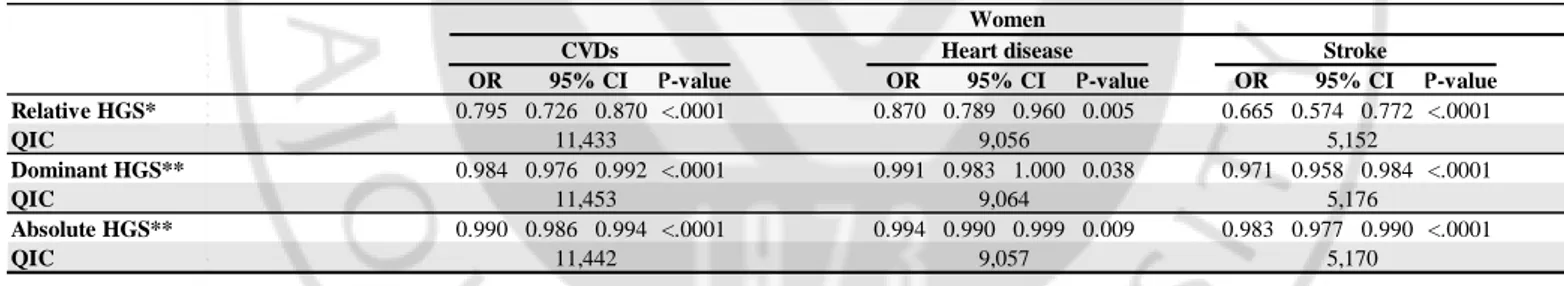
Table 5 shows the ORs and 95% CIs for CVDs and the best fit model fit using the QIC among the three different HGS indices in women. Similar to men, the relative HGS was also inversely associated with CVDs, controlling age, education, marital status, region, economic activities, alcohol, smoking, exercise, ADL, MMSE, hypertension, and diabetes (CVDs: OR per 1 SD increase in relative HGS = 0.795; 95% CI, 0.726–0.870; p < 0.0001; heart diseases: OR per 1 SD increase in relative HGS = 0.870; 95% CI, 0.789–0.960; p = 0.005; stroke: OR per 1 SD increase in relative HGS = 0.665; 95% CI, 0.574–0.772; p < 0.0001). In terms of the dominant and absolute HGS, there were also inversely associated with CVDs in women (dominant HGS: OR = 0.984; 95% CI, 0.976–0.992; p < 0.0001; absolute HGS: OR = 0.990; 95% CI, 0.986–0.999; p < 0.0001).
The QIC values for the three HGS indices were also nearly identical, but the relative HGS was the highest for women like men (CVDs: relative HGS = 11,433, dominant HGS = 11,453, absolute HGS = 11,442; heart diseases: relative HGS = 9,056, dominant HGS = 9,064, absolute HGS =9,057; stroke: relative HGS = 5,152, dominant HGS = 5,176, absolute HGS = 5,170).
36
Table 4 Adjusted ORs and 95% CIs for Cardiovascular diseases and QIC according to HGS indices in men
Table 5 Adjusted ORs and 95% CIs for Cardiovascular diseases and QIC according to HGS indices in women
OR P-value OR P-value OR P-value
Relative HGS* 0.839 0.783 0.898 <.0001 0.904 0.835 0.979 0.013 0.797 0.716 0.887 <.0001 QIC Dominant HGS** 0.984 0.978 0.990 <.0001 0.990 0.984 0.997 0.007 0.980 0.972 0.989 <.0001 QIC Absolute HGS** 0.991 0.988 0.994 <.0001 0.995 0.991 0.998 0.004 0.988 0.983 0.992 <.0001 QIC
* adjusted for age, education level, marital status, region, economic activity, alcohol consumption, smoking, exercise, ADL, MMSE, hypertension and diabetes ** adjusted for age, education level, marital status, region, economic activity, alcohol consumption, smoking, exercise, BMI, ADL, MMSE, hypertension and diabetes Acronyms: Odds Ratio ; CI, confidence interval ; HGS, Handgrip Strength ; QIC, Quasi-Akaike Information Criterion
Heart disease 95% CI 7,018 9,120 Men Stroke 95% CI 4,819 4,834 4,826 9,121 9,131 95% CI 7,021 7,020 CVDs
OR P-value OR P-value OR P-value
Relative HGS* 0.795 0.726 0.870 <.0001 0.870 0.789 0.960 0.005 0.665 0.574 0.772 <.0001 QIC Dominant HGS** 0.984 0.976 0.992 <.0001 0.991 0.983 1.000 0.038 0.971 0.958 0.984 <.0001 QIC Absolute HGS** 0.990 0.986 0.994 <.0001 0.994 0.990 0.999 0.009 0.983 0.977 0.990 <.0001 QIC
* adjusted for age, education level, marital status, region, economic activity, alcohol consumption, smoking, exercise, ADL, MMSE, hypertension and diabetes ** adjusted for age, education level, marital status, region, economic activity, alcohol consumption, smoking, exercise, BMI, ADL, MMSE, hypertension and diabetes Acronyms: Odds Ratio ; CI, confidence interval ; HGS, Handgrip Strength ; QIC, Quasi-Akaike Information Criterion
Women
11,433 9,056 5,152
CVDs Heart disease Stroke
95% CI 95% CI 95% CI
5,176
11,442 9,057 5,170
37
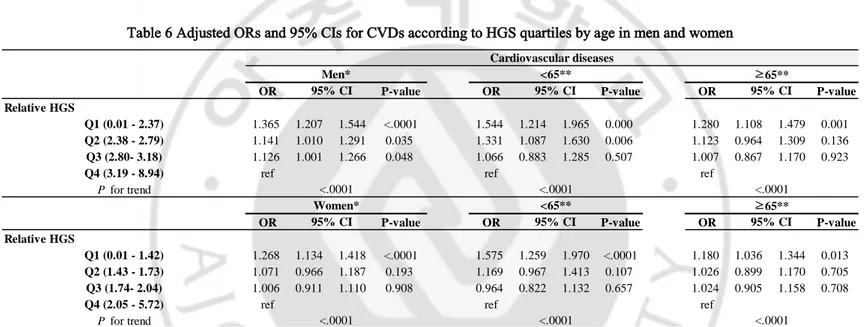
Table 6 shows the association between relative HGS and CVD by age in men and women according to quartiles. In men, the lowest quartiles (Q1) of relative HGS ranged from 0.01 to 2.37 kg/BMI, the second quartiles (Q2) of relative HGS ranged from 2.38 to 2.79 kg/BMI, the third quartiles (Q3) of relative HGS ranged from 2.80 to 3.18 kg/BMI, and the highest quartiles (Q4) of relative HGS ranged from 3.19 to 8.94 kg/BMI. In women, the lowest quartiles (Q1) of relative HGS ranged from 0.01 to 1.42 kg/BMI, the second quartiles (Q2) of relative HGS ranged from 1.43 to 1.73 kg/BMI, the third quartiles (Q3) of relative HGS ranged from 1.74 to 2.04 kg/BMI, and the highest quartiles (Q4) of relative HGS ranged from 2.05 to 5.72 kg/BMI.
Among men, the adjusted ORs for CVDs of Q1, Q2, and Q3 were significantly higher than Q4 (highest) (Q1= OR 1.365; 95% CI, 1.207–1.544; p < 0.0001; Q2: OR = 1.141; 95% CI, 1.010–1.291; p < 0.035; Q3: OR = 1.126; 95% CI, 1.001–1.266; p < 0.048). As a result of subgroup analysis, based on 65 years of age, the adjusted ORs for the CVDs of Q1 were significantly higher than Q4 (highest) after adjustment for year, education level, marital status, region, economic activity, alcohol consumption, smoking, exercise, ADL, MMSE, hypertension, and diabetes in both age groups. The effect was modestly stronger in the younger age group (45–64 years old) (45–65 years; Q1 vs Q4: 1.544 (1.214–1.965); p < 0.001; 65 years and older; Q1 vs Q4: 1.280 (1.108–1.479); p < 0.001).
38
compared to Q4 (highest); however, these were only statistically significant at Q1 (Q1 = OR, 1.268; 95% CI, 1.134–1.418; p < 0.0001; Q2: OR = 1.071; 95% CI, 0.966– 1.187; p = 0.193; Q3: OR = 1.006; 95% CI, 0.911–1.110; p = 0.908). In women, in the age-specific subgroup analysis, the trend of ORs for CVDs was higher, as the relative HGS was weaker than Q4; however, only Q1 was statistically significant in both age groups. The effect was also modestly stronger in the younger age group (45– 64 years), similar to men (45–65 years; Q1 vs Q4: 1.575 (1.259–1.970); p < 0.001; 65 years and older; Q1 vs Q4: 1.180 (1.036–1.344); p = 0.013).
Table 7 shows the association between the relative HGS and heart diseases by age in men and women according to quartiles. Among men, the ORs for heart diseases tended to significantly increase as the relative HGS became weaker than Q4; this was true with the exception of Q3 vs Q4 (Q1 = OR 1.263; 95% CI; 1.091–1.462; p = 0.002; Q2: OR = 1.209; 95% CI, 1.046–1.396; p = 0.010; Q3: OR = 1.115; 95% CI, 0.975– 1.275; p = 0.113). The age-specific subgroup results were statistically significant only in the younger age group (45–64 years), unlike CVDs (45–65 years; Q1 vs Q4: 1.436 (1.058–1.948); p = 0.020; 65 years and older; Q1 vs Q4: 1.161 (0.987–1.366); p = 0.072). Among women, the adjusted ORs of Q1 were significantly higher than Q4 alone, and the age-specific subgroup results were statistically significant only in the younger age group similar to that of men (overall; Q1 vs Q4: 1.170 (1.031–1.328); p = 0.015; 45–65 years; Q1 vs Q4: 1.437 (1.113–1.854); p = 0.005; 65 years and older; Q1 vs Q4: 1.139 (0.978–1.326); p = 0.095).
39
Table 8 indicates the association between relative HGS and stroke by age in men and women according to quartiles. The adjusted ORs for stroke tended to increase from Q3 to Q1 as compared to Q4 (highest); however, in both men and women, they were only statistically significant in Q1 (men: Q1 = OR 1.406; 95% CI, 1.152–1.714; p = 0.001; Q2: OR = 1.111; 95% CI, 0.917–1.348; p = 0.283; Q3: OR = 1.035; 95% CI 0.852–1.258; p = 0.726; women: OR 1.428; 95% CI, 1.194–1.706; p < 0.0001; Q2: OR = 1.139; 95% CI, 0.958–1.354; p = 0.139; Q3: OR = 1.006; 95% CI, 0.861–1.174; p = 0.945). In both age groups, among both sexes, the adjusted OR of Q1 for stroke was significantly higher than Q4 (highest) after adjustment for year, education level, marital status, region, economic activity, alcohol consumption, smoking, exercise, ADL, MMSE, hypertension, and diabetes, and the effect was stronger in the younger age group (45–64 years) (men: 45–65 years; Q1 vs Q4: 1.600 (1.109–2.309); p = 0.012; 65 years and older; Q1 vs Q4: 1.375 (1.103–1.714); p = 0.005; women: 45–65 years; Q1 vs Q4: 1.806 (1.234–2.642); p = 0.002; 65 years and older; Q1 vs Q4: 1.277 (1.003–1.501); p = 0.047).
40
Table 6 Adjusted ORs and 95% CIs for CVDs according to HGS quartiles by age in men and women
OR P-value OR P-value OR P-value
Relative HGS
Q1 (0.01 - 2.37) 1.365 1.207 1.544 <.0001 1.544 1.214 1.965 0.000 1.280 1.108 1.479 0.001
Q2 (2.38 - 2.79) 1.141 1.010 1.291 0.035 1.331 1.087 1.630 0.006 1.123 0.964 1.309 0.136
Q3 (2.80- 3.18) 1.126 1.001 1.266 0.048 1.066 0.883 1.285 0.507 1.007 0.867 1.170 0.923
Q4 (3.19 - 8.94) ref ref ref
P for trend
OR P-value OR P-value OR P-value
Relative HGS
Q1 (0.01 - 1.42) 1.268 1.134 1.418 <.0001 1.575 1.259 1.970 <.0001 1.180 1.036 1.344 0.013
Q2 (1.43 - 1.73) 1.071 0.966 1.187 0.193 1.169 0.967 1.413 0.107 1.026 0.899 1.170 0.705
Q3 (1.74- 2.04) 1.006 0.911 1.110 0.908 0.964 0.822 1.132 0.657 1.024 0.905 1.158 0.708
Q4 (2.05 - 5.72) ref ref ref
P for trend
* Adjusted for age, education level, marital status, region, economic activity, alcohol consumption, smoking, exercise, ADL, MMSE, hypertension and diabetes ** Adjusted for education level, marital status, region, economic activity, alcohol consumption, smoking, exercise, ADL, MMSE, hypertension and diabetes
<.0001 <.0001 <.0001 <.0001 <.0001 <.0001 Women* <65** ≥65** 95% CI 95% CI 95% CI Cardiovascular diseases 95% CI 95% CI 95% CI Men* <65** ≥65**
41
Table 7 Adjusted ORs and 95% CIs for heart diseases according to HGS quartiles by age in men and women
OR P-value OR P-value OR P-value
Relative HGS
Q1 (0.01 - 2.37) 1.263 1.091 1.462 0.002 1.436 1.058 1.948 0.020 1.161 0.987 1.366 0.072
Q2 (2.38 - 2.79) 1.209 1.046 1.396 0.010 1.403 1.112 1.771 0.004 1.070 0.910 1.259 0.412
Q3 (2.80- 3.18) 1.115 0.975 1.275 0.113 1.141 0.914 1.424 0.244 1.035 0.874 1.226 0.691
Q4 (3.19 - 8.94) ref ref ref
P for trend
OR P-value OR P-value OR P-value
Relative HGS
Q1 (0.01 - 1.42) 1.170 1.031 1.328 0.015 1.437 1.113 1.854 0.005 1.139 0.978 1.326 0.095
Q2 (1.43 - 1.73) 1.027 0.914 1.156 0.651 1.004 0.803 1.256 0.969 1.043 0.902 1.206 0.567
Q3 (1.74- 2.04) 0.993 0.885 1.114 0.904 0.911 0.743 1.118 0.373 1.038 0.893 1.206 0.630
Q4 (2.05 - 5.72) ref ref ref
P for trend
* Adjusted for age, education level, marital status, region, economic activity, alcohol consumption, smoking, exercise, ADL, MMSE, hypertension and diabetes ** Adjusted for education level, marital status, region, economic activity, alcohol consumption, smoking, exercise, ADL, MMSE, hypertension and diabetes
<.0001 0.0004 0.0011 <.0001 0.003 0.043 Women* <65** ≥65** 95% CI 95% CI 95% CI 95% CI Heart diseases Men* <65** ≥65** 95% CI 95% CI
42
Table 8 Adjusted ORs and 95% CIs for stroke according to HGS quartiles by age in men and women
OR P-value OR P-value OR P-value
Relative HGS
Q1 (0.01 - 2.37) 1.406 1.152 1.714 0.001 1.600 1.109 2.309 0.012 1.375 1.103 1.714 0.005
Q2 (2.38 - 2.79) 1.111 0.917 1.348 0.283 1.197 0.843 1.699 0.314 1.162 0.919 1.469 0.210
Q3 (2.80- 3.18) 1.035 0.852 1.258 0.726 0.899 0.641 1.259 0.534 0.977 0.785 1.216 0.835
Q4 (3.19 - 8.94) ref ref ref
P for trend
OR P-value OR P-value OR P-value
Relative HGS
Q1 (0.01 - 1.42) 1.428 1.194 1.706 <.0001 1.806 1.234 2.642 0.002 1.227 1.003 1.501 0.047
Q2 (1.43 - 1.73) 1.139 0.958 1.354 0.139 1.499 1.095 2.051 0.012 0.954 0.786 1.159 0.638
Q3 (1.74- 2.04) 1.006 0.861 1.174 0.945 1.101 0.867 1.399 0.430 0.930 0.748 1.156 0.512
Q4 (2.05 - 5.72) ref ref ref
P for trend
* Adjusted for age, education level, marital status, region, economic activity, alcohol consumption, smoking, exercise, ADL, MMSE, hypertension and diabetes ** Adjusted for education level, marital status, region, economic activity, alcohol consumption, smoking, exercise, ADL, MMSE, hypertension and diabetes
<.0001 <.0001 <.0001 <.0001 0.0005 0.0003 Stroke Women* <65** ≥65** 95% CI 95% CI 95% CI Men* <65** ≥65** 95% CI 95% CI 95% CI
43
C. Prevalence of cardiovascular diseases (CVDs) according to
quartiles of relative handgrip strength (HGS) and
correlation with age
The prevalence of CVDs (defined as heart diseases and stroke) significantly decreased across increasing quartiles of relative HGS in men and women (men: Q1, 34.9%; Q2, 26.9%; Q3, 22.2%; and Q4, 16.0%; p < 0.0001; women: Q1, 36.3%; Q2, 28.1%; Q3, 20.6%; and Q4, 15.0%; p < 0.001) (Figure 4).
Figure 4 Prevalence of cardiovascular diseases according to quartiles of relative handgrip strength