Appraising the role of previously reported risk
factors in epithelial ovarian cancer risk: A
Mendelian randomization analysis
James Yarmolinsky1,2, Caroline L. Relton1,2,3☯, Artitaya LophatananonID4, Kenneth MuirID4, Usha MenonID5, Aleksandra Gentry-Maharaj5, Axel WaltherID6,Jie Zheng1,2, Peter Fasching7, Wei ZhengID8, Woo Yin Ling9, Sue K. ParkID10,11,12, Byoung-Gie Kim13, Ji-Yeob Choi10,11,12, Boyoung ParkID14, George Davey SmithID1,2,3, Richard M. MartinID1,2,3☯, Sarah J. Lewis1,2☯*
1 MRC Integrative Epidemiology Unit, University of Bristol, Bristol, United Kingdom, 2 Population Health Sciences, Bristol Medical School, University of Bristol, Bristol, United Kingdom, 3 National Institute for Health Research Bristol Biomedical Research Centre, University of Bristol and University Hospitals Bristol NHS Foundation Trust, Bristol, United Kingdom, 4 Division of Population Health, Health Services Research and Primary Care, School of Health Sciences, Faculty of Biology, Medicine and Health, University of Manchester, Manchester, United Kingdom, 5 MRC Clinical Trials Unit, Institute for Clinical Trials and Methodology, University College London, London, United Kingdom, 6 Bristol Cancer Institute, University Hospitals Bristol NHS Foundation Trust, Bristol, United Kingdom, 7 Department of Gynecology and Obstetrics, University Hospital Erlangen, Comprehensive Cancer Center Erlangen–EMN, Friedrich-Alexander University Erlangen– Nuremberg, Erlangen, Germany, 8 Division of Epidemiology, Vanderbilt University Medical Center,
Vanderbilt University, Nashville, Tennessee, United States of America, 9 Faculty of Medicine, University of Malaya, Kuala Lumpur, Malaysia, 10 Department of Preventive Medicine, Seoul National University College of Medicine, Seoul, South Korea, 11 Cancer Research Institute, Seoul National University, Seoul, South Korea, 12 Department of Biomedical Science, Seoul National University Graduate School, Seoul, South Korea, 13 Department of Obstetrics and Gynecology, Samsung Medical Center, Sungkyunkwan University School of Medicine, Seoul, South Korea, 14 Department of Medicine, College of Medicine, Hanyang University, Seoul, South Korea
☯These authors contributed equally to this work.
Abstract
Background
Various risk factors have been associated with epithelial ovarian cancer risk in observational epidemiological studies. However, the causal nature of the risk factors reported, and thus their suitability as effective intervention targets, is unclear given the susceptibility of conven-tional observaconven-tional designs to residual confounding and reverse causation. Mendelian randomization (MR) uses genetic variants as proxies for risk factors to strengthen causal inference in observational studies. We used MR to evaluate the association of 12 previously reported risk factors (reproductive, anthropometric, clinical, lifestyle, and molecular factors) with risk of invasive epithelial ovarian cancer, invasive epithelial ovarian cancer histotypes, and low malignant potential tumours.
Methods and findings
Genetic instruments to proxy 12 risk factors were constructed by identifying single nucleo-tide polymorphisms (SNPs) that were robustly (P<5×10⁻⁸) and independently associated a1111111111 a1111111111 a1111111111 a1111111111 a1111111111 OPEN ACCESS
Citation: Yarmolinsky J, Relton CL, Lophatananon
A, Muir K, Menon U, Gentry-Maharaj A, et al. (2019) Appraising the role of previously reported risk factors in epithelial ovarian cancer risk: A Mendelian randomization analysis. PLoS Med 16 (8): e1002893.https://doi.org/10.1371/journal. pmed.1002893
Academic Editor: Cosetta Minelli, Imperial College
London, UNITED KINGDOM
Received: November 27, 2018 Accepted: July 15, 2019 Published: August 7, 2019
Copyright:© 2019 Yarmolinsky et al. This is an open access article distributed under the terms of theCreative Commons Attribution License, which permits unrestricted use, distribution, and reproduction in any medium, provided the original author and source are credited.
Data Availability Statement: All relevant data are
within theS1_Datafile.
Funding: This work was supported by a Cancer
Research UK programme grant (C18281/A19169) to CLR, SJL, and RMM, including a Cancer Research UK Research PhD studentship (C18281/ A20988) to JY (https://www.cancerresearchuk.org/ ). RMM is also supported by the National Institute for Health Research (NIHR) Bristol Biomedical Research Centre (http://www.uhbristol.nhs.uk/
with each respective risk factor in previously reported genome-wide association studies. These risk factors included genetic liability to 3 factors (endometriosis, polycystic ovary syn-drome, type 2 diabetes) scaled to reflect a 50% higher odds liability to disease. We obtained summary statistics for the association of these SNPs with risk of overall and histotype-spe-cific invasive epithelial ovarian cancer (22,406 cases; 40,941 controls) and low malignant potential tumours (3,103 cases; 40,941 controls) from the Ovarian Cancer Association Con-sortium (OCAC). The OCAC dataset comprises 63 genotyping project/case–control sets with participants of European ancestry recruited from 14 countries (US, Australia, Belarus, Germany, Belgium, Denmark, Finland, Norway, Canada, Poland, UK, Spain, Netherlands, and Sweden). SNPs were combined into multi-allelic inverse-variance-weighted fixed or random effects models to generate effect estimates and 95% confidence intervals (CIs). Three complementary sensitivity analyses were performed to examine violations of MR assumptions: MR–Egger regression and weighted median and mode estimators. A Bonfer-roni-corrected P value threshold was used to establish strong evidence (P<0.0042) and suggestive evidence (0.0042<P<0.05) for associations. In MR analyses, there was strong or suggestive evidence that 2 of the 12 risk factors were associated with invasive epithelial ovarian cancer and 8 of the 12 were associated with 1 or more invasive epithelial ovarian cancer histotypes. There was strong evidence that genetic liability to endometriosis was associated with an increased risk of invasive epithelial ovarian cancer (odds ratio [OR] per 50% higher odds liability: 1.10, 95% CI 1.06–1.15; P = 6.94×10⁻⁷) and suggestive evidence that lifetime smoking exposure was associated with an increased risk of invasive epithelial ovarian cancer (OR per unit increase in smoking score: 1.36, 95% CI 1.04–1.78; P = 0.02). In analyses examining histotypes and low malignant potential tumours, the strongest associ-ations found were between height and clear cell carcinoma (OR per SD increase: 1.36, 95% CI 1.15–1.61; P = 0.0003); age at natural menopause and endometrioid carcinoma (OR per year later onset: 1.09, 95% CI 1.02–1.16; P = 0.007); and genetic liability to polycystic ovary syndrome and endometrioid carcinoma (OR per 50% higher odds liability: 0.89, 95% CI 0.82–0.96; P = 0.002). There was little evidence for an association of genetic liability to type 2 diabetes, parity, or circulating levels of 25-hydroxyvitamin D and sex hormone binding globulin with ovarian cancer or its subtypes. The primary limitations of this analysis include the modest statistical power for analyses of risk factors in relation to some less common ovarian cancer histotypes (low grade serous, mucinous, and clear cell carcinomas), the inability to directly examine the association of some ovarian cancer risk factors that did not have robust genetic variants available to serve as proxies (e.g., oral contraceptive use, hor-mone replacement therapy), and the assumption of linear relationships between risk factors and ovarian cancer risk.
Conclusions
Our comprehensive examination of possible aetiological drivers of ovarian carcinogenesis using germline genetic variants to proxy risk factors supports a role for few of these factors in invasive epithelial ovarian cancer overall and suggests distinct aetiologies across histo-types. The identification of novel risk factors remains an important priority for the prevention of epithelial ovarian cancer.
research-innovation/our-research/nihrbristolbrc/). JY, CLR, JZ, GDS, RMM, and SJL are members of the MRC IEU which is supported by the Medical Research Council and the University of Bristol (MC_UU_12013/1-9) (https://mrc.ukri.org/,http:// www.bristol.ac.uk/). UM is supported by the NIHR University College London Hospitals (UCLH) Biomedical Research Centre (http://www. uclhospitals.brc.nihr.ac.uk/content/biomedical-research-centre). WZ is supported by an NIH grant (UM1CA182910) (https://www.nih.gov/). The funders of this study played no role in the design, data collection and analysis, decision to publish, or preparation of this manuscript.
Competing interests: I have read the journal’s
policy and the authors of this manuscript have the following competing interests: WZ and GDS are on the Editorial Board of PLOS Medicine.
Abbreviations: BMI, body mass index; CRP,
C-reactive protein; GWAS, genome-wide association study; HGSC, high grade serous carcinoma; IVW, inverse-variance-weighted; MR, Mendelian randomization; OCAC, Ovarian Cancer Association Consortium; OR, odds ratio; PCOS, polycystic ovary syndrome; WCRF/AICR, World Cancer Research Fund/American Institute for Cancer Research.
Author summary
Why was this study done?
• Numerous reproductive, lifestyle, and molecular factors have been linked to risk of epi-thelial ovarian cancer in observational epidemiological studies. It is unclear whether these associations represent causal relationships or merely reflect residual confounding, reverse causation, or other forms of bias inherent to conventional epidemiological designs. • Mendelian randomization (MR) uses germline genetic variants as proxies for risk
fac-tors to generate more reliable evidence of the causal effect of risk facfac-tors on disease-related outcomes.
What did the researchers do and find?
• We employed MR analysis to systematically evaluate the association of 12 previously reported risk factors with risk of invasive epithelial ovarian cancer, invasive epithelial ovarian cancer histotypes, and low malignant potential tumours in up to 25,509 cases and 40,941 controls in the Ovarian Cancer Association Consortium.
• In MR analysis, only 2 of 12 previously reported risk factors (genetic liability to endome-triosis and lifetime smoking exposure) were associated with invasive epithelial ovarian cancer risk.
• When analyses were stratified on invasive epithelial ovarian cancer histotypes and low malignant potential tumours, 8 risk factors were associated with 1 or more epithelial ovarian cancer subtypes. The strongest associations identified were positive associations of height with clear cell carcinoma and age at natural menopause with endometrioid carcinoma and an inverse association of genetic liability to polycystic ovary syndrome with endometrioid carcinoma.
What do these findings mean?
• Beyond implicating genetic liability to endometriosis and lifetime smoking exposure in invasive epithelial ovarian cancer risk, these analyses found little evidence to support roles for several previously reported risk factors for this malignancy in disease aetiology. • Our findings support distinct risk profiles across invasive epithelial ovarian cancer
his-totypes, which could have important implications for studies of disease prognosis, but which complicate the design of effective prevention strategies targeting ovarian cancer as a whole.
Introduction
Ovarian cancer is the second most common gynaecological cancer in the US and Western Europe and accounts for more deaths than all other gynaecological cancers combined [1,2]. The prognosis for ovarian cancer is generally poor because women typically present with advanced disease due to the non-specific nature of symptoms and because of the lack of
established screening tests [3–5]. Given the limited success of secondary prevention strategies and the sporadic nature of 90% of cases, primary prevention of ovarian cancer may serve as an important vehicle for disease control [6]. However, few risk factors have consistently been linked to epithelial ovarian cancer, which accounts for 85%–90% of ovarian cancers, in obser-vational epidemiological studies, and most previous studies have failed to stratify analyses across clinically distinct histotypes [7–10]. Stratification is necessary because of the previously reported heterogeneity in risk factor–histotype associations in epidemiological analyses [8–
10]. Further, the causal nature of the risk factors reported, and thus their suitability as effective intervention targets, is unclear given the susceptibility of conventional observational designs to residual confounding and reverse causation.
Mendelian randomization (MR) is an analytical approach that uses germline genetic vari-ants as instruments (“proxies”) for risk factors, to examine the causal effects of these factors on disease outcomes in observational settings [11,12]. Since germline genetic variants are ran-domly assorted at meiosis, MR analyses should be less prone to confounding by lifestyle and environmental factors than conventional observational studies. Further, since germline genetic variants are fixed at conception and cannot be influenced by subsequent disease processes, MR analyses are not subject to reverse causation bias. An additional advantage of MR is that it can be implemented using summary genetic association data from 2 independent samples repre-senting (1) the genetic variant–risk factor associations and (2) the genetic variant–outcome associations (known as the 2-sample MR approach). This approach provides an efficient and statistically robust method of appraising causal relationships between risk factors and disease outcomes. To date, MR analyses of ovarian cancer have reported a positive association of body mass index (BMI) with non–high grade serous carcinoma (HGSC) but a null association with HGSC [13], a positive association of height with ovarian cancer [14], and an inverse associa-tion of 25-hydroxyvitamin D with ovarian cancer, including HGSC [15]. However, these anal-yses were limited by modest sample sizes (10,065–16,395 cases), restricting power for subtype-stratified analysis.
Given the unclear causal relevance of previously reported observational associations of risk factors in the aetiology of epithelial ovarian cancer, and limited exploration of their causality in MR analyses to date, a 2-sample MR analysis was performed to evaluate the association of 12 previously reported factors with risk of invasive epithelial ovarian cancer, invasive epithelial ovarian cancer histotypes, and low malignant potential tumours.
Methods
Ovarian cancer population
Summary genetic association data were obtained on 25,509 women with epithelial ovarian cancer and 40,941 controls of European descent. These women had been genotyped using the Illumina Custom Infinium array (OncoArray) as part of the Ovarian Cancer Association Con-sortium (OCAC) genome-wide association study (GWAS) [16,17]. This dataset comprises 63 genotyping project/case–control sets representing participants of European ancestry recruited from 14 countries (US, Australia, Belarus, Germany, Belgium, Denmark, Finland, Norway, Canada, Poland, UK, Spain, Netherlands, and Sweden), with some studies contributing sam-ples to more than 1 genotyping project and some case–control sets representing a combination of multiple individual studies. Genotype data were obtained either by direct genotyping using an Illumina Custom Infinium array (OncoArray) consisting of approximately 530,000 SNPs or by imputation with reference to the 1000 Genomes Project Phase 3 dataset [18]. The data included 22,406 invasive epithelial ovarian cancer cases (40,941 controls) involving the following invasive epithelial ovarian cancer histotypes: HGSC (n = 13,037), low grade serous
carcinoma (n = 1,012), mucinous carcinoma (n = 1,417), endometrioid carcinoma (n = 2,810),
and clear cell carcinoma (n = 1,366). Invasive histotypes classified as “other” by OCAC
(n = 2,764 cases) were included in analyses of overall invasive epithelial ovarian cancer but
were not assessed separately. Analyses were also performed for low malignant potential tumours (n = 3,103), which included 1,954 serous and 1,149 mucinous tumours. Ethical
approval from relevant research ethics committees was obtained for all studies in OCAC, and written, informed consent was obtained from all participants in these studies. Further details about the OCAC study and OncoArray analyses are available inS1 Text.
Identification of previously reported risk factors and instrument selection
Previously reported risk factors for epithelial ovarian cancer were identified from a literature review, using PubMed and Web of Science, of narrative and systematic review articles summa-rising findings from observational epidemiological studies [19–24] and through consultation with the Cancer Research UK website (https://www.cancerresearchuk.org/about-cancer/ ovarian-cancer/risks-causes) and the World Cancer Research Fund/American Institute for Cancer Research (WCRF/AICR)Ovarian Cancer 2014 Report [25]. Genetic instruments were then identified for these risk factors by consulting the preprint server bioRxiv (http://www. biorxiv.org/) and 2 catalogues of summary GWAS data: the NHGRI-EBI (National Human Genome Research Institute–European Bioinformatics Institute) GWAS catalogue and MR-Base [26,27]. The complete PubMed and Web of Science search strategies and instrument selection criteria are presented inS1andS2Texts, respectively.
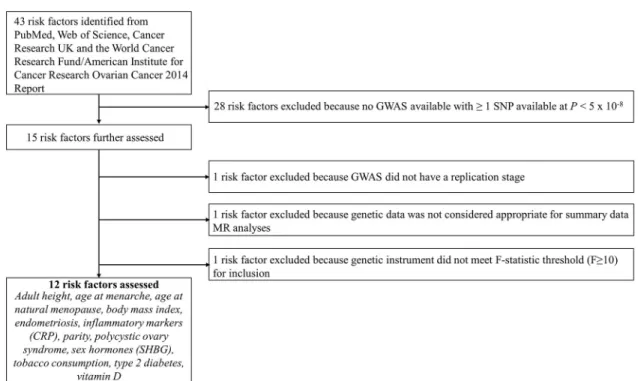
In total, 12 risk factors with a suitable genetic instrument were included in the analysis: 3 reproductive factors (age at menarche, age at natural menopause, and parity) [28–31], 2 anthropometric traits (BMI and height) [32,33], 3 clinical factors (genetic liabilities to type 2 diabetes, endometriosis, and polycystic ovary syndrome [PCOS]) [34–36], 1 lifestyle factor (lifetime smoking exposure) [37,38], and 3 molecular risk factors (circulating 25-hydroxyvita-min D, C-reactive protein [CRP], and sex hormone binding globulin) [39,40]. Lifetime smok-ing exposure is a composite score that captures smoksmok-ing duration, heaviness, and cessation among both smokers and non-smokers. A step-by-step overview of risk factor inclusion along with a flow chart of these processes and a list of all risk factors ascertained for inclusion are presented inFig 1andS1 Text.
Statistical analyses
The use of genetic instruments for exposures in an MR framework allows for unbiased causal effects of risk factors on disease outcomes to be estimated if the following assumptions are met: (1) the genetic instrument (typically, 1 or more independent SNPs) is robustly associated with the risk factor of interest; (2) the instrument is not associated with any confounding fac-tor(s) of the association between the risk factor and outcome; and (3) there is no pathway through which the instrument influences the outcome except through the risk factor (“exclu-sion restriction criterion”).
After obtaining effect estimates from relevant GWASs, SNPs were pruned for linkage dis-equilibrium atR2< 0.001 at a clumping distance of 10,000 kilobases from the lead SNP at P < 5 × 10⁻⁸with reference to the 1000 Genomes Project (http://www.internationalgenome. org/). SNP–risk factor association estimates were derived from either sex-combined or female-specific analyses as presented inTable 1, and methodological considerations for when instruments were derived from sex-combined versus female-specific analyses are pre-sented inS2 Text.
Estimates of the proportion of variance in each risk factor explained by the genetic instru-ments (R2) and the strength of the association between the genetic instruments and risk factors (F-statistics) were generated using methods previously described [41]. F-statistics can be used to examine whether results are likely to be influenced by weak instrument bias, i.e., reduced statistical power to reject the null hypothesis when an instrument explains a limited proportion of the variance in a risk factor. We excluded risk factors with anF-statistic of <10 in order to
minimise weak instrument bias.
For risk factors with 2 or 3 SNPs as instruments, inverse-variance-weighted (IVW) fixed effects models were used to generate effect estimates, and for risk factors with greater than 3 SNPs, IVW multiplicative random effects models (allowing overdispersion in the model) were used [42]. The combination of multiple SNPs into a multi-allelic instrument increases the proportion of variance in a risk factor explained by the instrument. Effect estimates from these models represent a weighted average of individual Wald ratios across SNPs using IVW meta-analysis. Effect estimates for associations of genetic liability to binary clinical factors (endometriosis, PCOS, type 2 diabetes) with ovarian cancer outcomes represent the effect of a 50% higher odds liability to these clinical factors (i.e., equivalent to the effect of a 1.5-fold increase in the odds liability to disease). These estimates were obtained by scaling the natural log odds ratio (OR) of ovarian cancer outcome per natural log OR of clinical factor by a fac-tor of 1.5. As these analyses were not performed in clinical samples (i.e., were not restricted to individuals diagnosed with the disease states examined), the estimates represent subdiag-nostic traits or pathophysiological pathways leading to susceptibility to disease, rather than the disease itself. To account for multiple testing across analyses, a Bonferroni correction was used to establishP value thresholds for strong evidence (P < 0.0042) (false positive
rate = 0.05/12 risk factors) and suggestive evidence (0.0042 <P < 0.05) for reported
associations.
Fig 1. Flowchart for risk factor inclusion. CRP, C-reactive protein; GWAS, genome-wide association study; MR, Mendelian
randomization; SHBG, sex hormone binding globulin; SNP, single nucleotide polymorphism. https://doi.org/10.1371/journal.pmed.1002893.g001
When using genetic instruments, there is potential for horizontal pleiotropy—when a genetic variant has an effect on 2 or more traits through independent biological pathways, a violation of the third instrumental variable assumption. This was examined by performing 3 complementary sensitivity analyses, each of which makes different assumptions about the underlying nature of horizontal pleiotropy: MR–Egger regression (intercept and slope terms) [43] and weighted median estimation [44], both of which were employed when there were, at minimum, 3 SNPs in an instrument, and weighted mode estimation [45], which was employed when there were, at minimum, 5 SNPs in an instrument. Additionally, leave-one-out permuta-tion analyses were performed to examine whether any results were driven by individual influ-ential SNPs in IVW models. Lastly, Steiger filtering was employed to orient the direction of causal relationships between presumed risk factors and outcomes for some analyses [46]. This method compares the proportion of risk factor and outcome variance explained by SNPs used as instruments, to help establish whether SNPs associated with both risk factors and outcomes primarily represent (1) a direct association of a SNP with a risk factor, which then influences an outcome, or (2) a direct association of a SNP with an outcome, which then influences the level of a risk factor. Extended descriptions of these sensitivity analyses, along with their assumptions, are provided inS2 Text.
There was no formal prespecified protocol for this study. All analyses described above were decided a priori. All statistical analyses were performed using R version 3.3.1.
This study is reported as per the Strengthening the Reporting of Observational Studies in Epidemiology (STROBE) guideline (S1 STROBE Checklist).
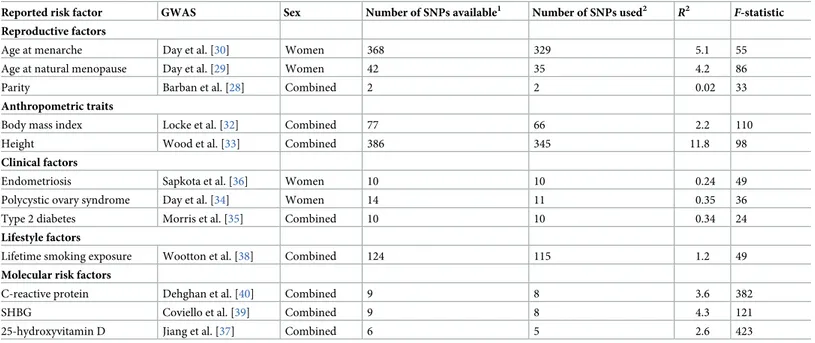
Table 1. Catalogue of GWASs used for genetic instruments and estimates of instrument strength for previously reported risk factors.
Reported risk factor GWAS Sex Number of SNPs available1 Number of SNPs used2 R2
F-statistic Reproductive factors
Age at menarche Day et al. [30] Women 368 329 5.1 55
Age at natural menopause Day et al. [29] Women 42 35 4.2 86
Parity Barban et al. [28] Combined 2 2 0.02 33
Anthropometric traits
Body mass index Locke et al. [32] Combined 77 66 2.2 110
Height Wood et al. [33] Combined 386 345 11.8 98
Clinical factors
Endometriosis Sapkota et al. [36] Women 10 10 0.24 49
Polycystic ovary syndrome Day et al. [34] Women 14 11 0.35 36
Type 2 diabetes Morris et al. [35] Combined 10 10 0.34 24
Lifestyle factors
Lifetime smoking exposure Wootton et al. [38] Combined 124 115 1.2 49
Molecular risk factors
C-reactive protein Dehghan et al. [40] Combined 9 8 3.6 382
SHBG Coviello et al. [39] Combined 9 8 4.3 121
25-hydroxyvitamin D Jiang et al. [37] Combined 6 5 2.6 423
R2represents the proportion of variance in a risk factor explained by the genetic instrument.
F-statistic represents the strength of the association between the genetic
instrument and levels of the risk factor.
1Corresponds to the number of SNPs available after pruning top SNPs reported in corresponding linkage disequilibrium at
R2< 0.001 at a clumping distance of 10,000
kilobases from the lead SNP atP < 5 × 10⁻⁸.
2Corresponds to the number of SNPs (or linkage disequilibrium proxies) available in ovarian cancer datasets. GWAS, genome-wide association study; SHBG, sex hormone binding globulin; SNP, single nucleotide polymorphism. https://doi.org/10.1371/journal.pmed.1002893.t001
Results
Across the 12 risk factors that we examined,F-statistics for their respective genetic instruments
ranged from 24 to 423, suggesting that our analyses were unlikely to suffer from weak instru-ment bias. For each risk factor, the number of SNPs included in the genetic instruinstru-ment, along withR2andF-statistics for the instrument, are provided inTable 1. Complete primary and sensitivity analyses are presented inTable 2for invasive epithelial ovarian cancer and inS1–S5
Tables for invasive epithelial ovarian cancer histotypes and low malignant potential tumours (subtype-specific analyses). Scatter plots for findings showing strong or suggestive evidence of association in IVW analyses that were consistent in sensitivity analyses are presented inS1 Plots. Leave-one-out plots are presented inS2 Plots.
Reproductive factors
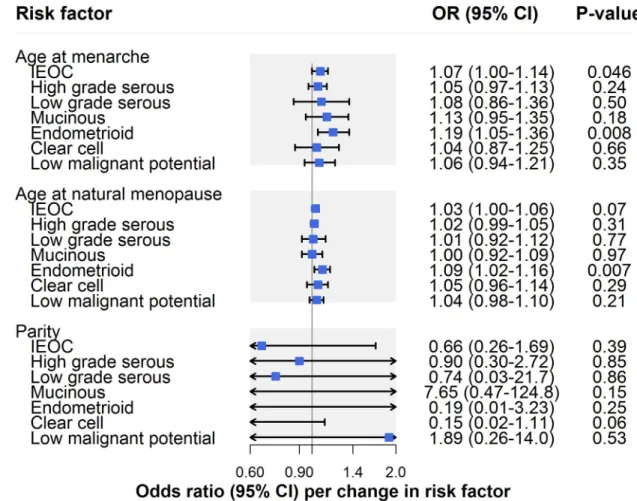
In IVW models, there was suggestive evidence for an association of earlier age at menarche with risk of invasive epithelial ovarian cancer (OR per year earlier onset: 1.07, 95% CI 1.00– 1.14;P = 0.046) (Fig 2;Table 2). However, there was some evidence that horizontal pleiotropy was biasing the IVW estimate. This is because the effect estimate attenuated toward the null when employing MR–Egger regression (OR 1.00, 95% CI 0.89–1.13) and a weighted median estimator (OR 1.01, 95% CI 0.92–1.10) and moved in a protective direction when using a weighted mode estimator (OR 0.98, 95% CI 0.25–3.84). In analyses examining invasive epithe-lial ovarian cancer histotypes and low malignant potential tumours, there was suggestive evi-dence for an association of earlier age at menarche with endometrioid carcinoma (OR 1.19, 95% CI 1.05–1.36;P = 0.008), which was robust to MR–Egger, weighted median, weighted
mode, and leave-one-out analyses (S1 Table).
There was little evidence for an association of later age at natural menopause with risk of invasive epithelial ovarian cancer risk (OR per year later onset: 1.03, 95% CI 1.00–1.06;
P = 0.07) (Fig 2;Table 2). However, in subtype-specific analyses, there was suggestive evidence for an association of later age at natural menopause with risk of endometrioid carcinoma (OR 1.09, 95% CI 1.02–1.16;P = 0.007), which was consistent in sensitivity analyses examining
hor-izontal pleiotropy. While there was little evidence of an association of age at natural meno-pause with clear cell carcinoma in IVW models (OR 1.05, 95% CI 0.96–1.14;P = 0.29), the
association strengthened when employing MR–Egger (OR 1.26, 95% CI 1.05–1.52), weighted median (OR 1.11, 95% CI 0.99–1.25), and weighted mode estimators (OR 1.16, 95% CI 1.02– 1.31), suggesting horizontal pleiotropy in the IVW model (S1 Table).
In parity analyses, effect estimates were in a protective direction for 5 of 7 ovarian cancer outcomes but were imprecisely estimated, with 95% confidence intervals crossing the null line (Table 2;S1 Table).
Anthropometric traits
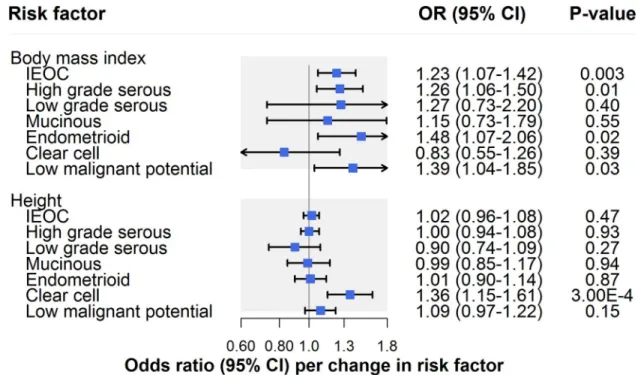
There was strong evidence for an association of BMI with invasive epithelial ovarian cancer (OR per 1-SD [4.6 kg/m2] increase: 1.23, 95% CI 1.07–1.42;P = 0.003) (Fig 3;Table 2). Though there was little evidence for horizontal pleiotropy when performing MR–Egger (OR 1.32, 95% CI 0.88–1.99), inconsistency of effect estimates across weighted median (OR 1.14, 95% CI 0.93–1.40) and weighted mode (OR 1.05, 95% CI 0.75–1.51) approaches suggested potential violations of instrumental variable assumptions.
In IVW models, there was suggestive evidence for an association of BMI with HGSC (OR 1.26, 95% CI 1.06–1.50;P = 0.01), endometrioid carcinoma (OR 1.48, 95% CI 1.07–2.06; P = 0.02), and low malignant potential tumours (OR 1.39, 95% CI 1.04–1.85; P = 0.03) but not
the IVW estimate for HGSC: The effect estimate was attenuated when performing MR–Egger regression (OR 1.05, 95% CI 0.63–1.75) and was inconsistent when employing weighted median (OR 1.17, 95% CI 0.91–1.50) and weighted mode (OR 0.95, 95% CI 0.53–1.35) estima-tors. Likewise, there was some inconsistency of effect estimates across sensitivity analyses for low malignant potential tumours, with a modest attenuation of the effect estimate observed when employing a weighted mode estimator (OR 1.17, 95% CI 0.55–2.49). Inconsistencies across sensitivity analyses for low malignant potential tumours could reflect horizontal pleiot-ropy or could reflect limited statistical power for analyses of these tumours. In contrast to HGSC and low malignant potential tumours, the association of BMI with endometrioid carcinoma was also seen across sensitivity analyses using MR–Egger, weighted median, and weighted mode estimators, and in leave-one-out analyses (S2 Table).
There was little evidence for an association of height with invasive epithelial ovarian cancer risk (OR per 1-SD [6.3 cm] increase: 1.02, 95% CI 0.96–1.08;P = 0.47) (Fig 3;Table 2). In
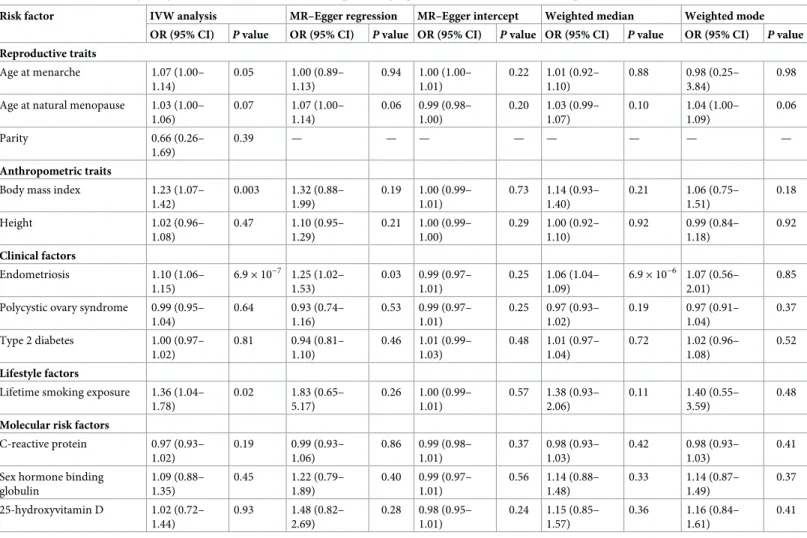
Table 2. IVW and sensitivity analysis estimates for the association of previously reported risk factors with invasive epithelial ovarian cancer risk.
Risk factor IVW analysis MR–Egger regression MR–Egger intercept Weighted median Weighted mode
OR (95% CI) P value OR (95% CI) P value OR (95% CI) P value OR (95% CI) P value OR (95% CI) P value Reproductive traits Age at menarche 1.07 (1.00– 1.14) 0.05 1.00 (0.89– 1.13) 0.94 1.00 (1.00– 1.01) 0.22 1.01 (0.92– 1.10) 0.88 0.98 (0.25– 3.84) 0.98 Age at natural menopause 1.03 (1.00–
1.06) 0.07 1.07 (1.00– 1.14) 0.06 0.99 (0.98– 1.00) 0.20 1.03 (0.99– 1.07) 0.10 1.04 (1.00– 1.09) 0.06 Parity 0.66 (0.26– 1.69) 0.39 — — — — — — — — Anthropometric traits
Body mass index 1.23 (1.07–
1.42) 0.003 1.32 (0.88– 1.99) 0.19 1.00 (0.99– 1.01) 0.73 1.14 (0.93– 1.40) 0.21 1.06 (0.75– 1.51) 0.18 Height 1.02 (0.96– 1.08) 0.47 1.10 (0.95– 1.29) 0.21 1.00 (0.99– 1.00) 0.29 1.00 (0.92– 1.10) 0.92 0.99 (0.84– 1.18) 0.92 Clinical factors Endometriosis 1.10 (1.06– 1.15) 6.9× 10⁻⁷ 1.25 (1.02– 1.53) 0.03 0.99 (0.97– 1.01) 0.25 1.06 (1.04– 1.09) 6.9× 10⁻⁶ 1.07 (0.56– 2.01) 0.85 Polycystic ovary syndrome 0.99 (0.95–
1.04) 0.64 0.93 (0.74– 1.16) 0.53 0.99 (0.97– 1.01) 0.25 0.97 (0.93– 1.02) 0.19 0.97 (0.91– 1.04) 0.37 Type 2 diabetes 1.00 (0.97– 1.02) 0.81 0.94 (0.81– 1.10) 0.46 1.01 (0.99– 1.03) 0.48 1.01 (0.97– 1.04) 0.72 1.02 (0.96– 1.08) 0.52 Lifestyle factors
Lifetime smoking exposure 1.36 (1.04– 1.78) 0.02 1.83 (0.65– 5.17) 0.26 1.00 (0.99– 1.01) 0.57 1.38 (0.93– 2.06) 0.11 1.40 (0.55– 3.59) 0.48
Molecular risk factors
C-reactive protein 0.97 (0.93– 1.02) 0.19 0.99 (0.93– 1.06) 0.86 0.99 (0.98– 1.01) 0.37 0.98 (0.93– 1.03) 0.42 0.98 (0.93– 1.03) 0.41 Sex hormone binding
globulin 1.09 (0.88– 1.35) 0.45 1.22 (0.79– 1.89) 0.40 0.99 (0.97– 1.01) 0.56 1.14 (0.88– 1.48) 0.33 1.14 (0.87– 1.49) 0.37 25-hydroxyvitamin D 1.02 (0.72– 1.44) 0.93 1.48 (0.82– 2.69) 0.28 0.98 (0.95– 1.01) 0.24 1.15 (0.85– 1.57) 0.36 1.16 (0.84– 1.61) 0.41
Estimates are scaled to represent the association of a 1-year decrease in age at menarche; a 1-year increase in age at natural menopause; a 1-child increase in number of children ever born; a 1-SD increase in body mass index (kg/m2); a 1-SD increase in height (cm); a 50% higher odds liability to type 2 diabetes, endometriosis, or polycystic ovary syndrome; a 1-unit increase in lifetime smoking exposure; a 1-unit increase in natural-log-transformed 25-hydroxyvitamin D (ng/ml); a 1-unit increase in natural-log-transformed C-reactive protein (mg/l); and a 1-unit increase in natural-log-transformed sex hormone binding globulin (nmol/l). IVW, inverse-variance-weighted; OR, odds ratio.
analyses examining histotypes and low malignant potential tumours, there was strong evidence for an association of height with clear cell carcinoma (OR 1.36, 95% CI 1.15–1.61;P = 0.0003),
but not with other subtypes. This finding was robust to various sensitivity analyses (S2 Table).
Clinical factors
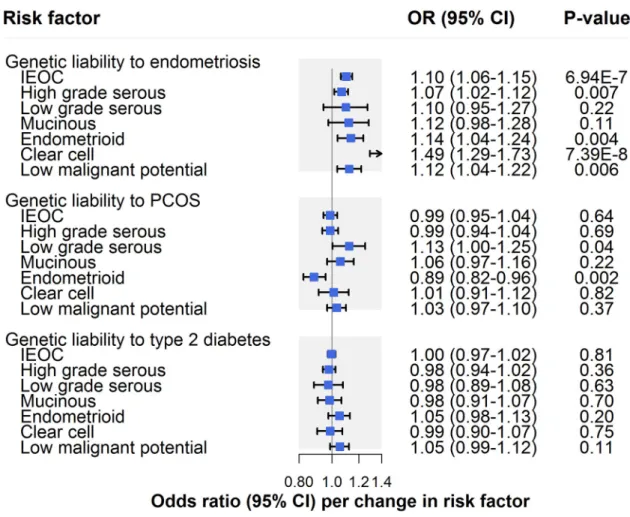
There was strong evidence for an association of genetic liability to endometriosis with invasive epithelial ovarian cancer (OR per 50% higher odds liability to endometriosis: 1.10, 95% CI 1.06–1.15;P = 6.94 × 10⁻⁷), which was consistent across sensitivity analyses examining hori-zontal pleiotropy (Fig 4;Table 2). In subtype-specific analyses, there was also strong evidence for an association with clear cell carcinoma (OR 1.49, 95% CI 1.29–1.73;P = 7.39 × 10⁻⁸) and suggestive evidence for an association with endometrioid carcinoma (OR 1.14, 95% CI 1.04– 1.24;P = 0.004), low malignant potential tumours (OR 1.12, 95% CI 1.04–1.22; P = 0.006), and
HGSC (OR 1.07, 95% CI 1.02–1.12;P = 0.007). Findings for clear cell carcinoma were also
seen in sensitivity analyses examining horizontal pleiotropy, whereas somewhat inconsistent effect estimates were found for endometrioid carcinoma, low malignant potential tumours, and HGSC. While these inconsistencies could reflect potential violations of instrumental vari-able assumptions, divergent effect estimates in endometrioid and low malignant potential
Fig 2. Inverse-variance-weighted estimates for the association of reproductive factors with risk of invasive epithelial ovarian cancer, invasive epithelial ovarian cancer histotypes, and low malignant potential tumours. IEOC, invasive epithelial ovarian
cancer; OR, odds ratio. Causal estimates are scaled to represent the effect of a 1-year decrease in age at menarche, a 1-year increase in age at natural menopause, and a 1-child increase in number of children ever born.
tumour analyses could also reflect limited statistical power in these analyses (S3 Table). Analy-ses employing Steiger filtering provided strong evidence that the causal direction between genetic liability to endometriosis and invasive epithelial ovarian cancer was from the former to the latter (P = 10−10), whereas the causal direction could not be clearly established for clear cell carcinoma analyses (P = 0.10).
There was little evidence that genetic liability to PCOS influenced invasive epithelial ovarian cancer risk (OR per 50% higher odds liability to PCOS: 0.99, 95% CI 0.95–1.04;P = 0.64) (Fig 4;Table 2). In subtype-specific analyses, there was strong evidence for an inverse association of genetic liability to PCOS with endometrioid carcinoma (OR 0.89, 95% CI 0.82–0.96;
P = 0.002), which was robust to sensitivity analyses. In contrast, suggestive evidence for an
association of PCOS with low grade serous carcinoma (OR 1.13, 95% CI 1.00–1.25;P = 0.04)
in IVW models was not seen across all sensitivity analyses, suggesting presence of horizontal pleiotropy or potentially reflecting limited statistical power in these analyses. There was little evidence of an association of genetic liability to type 2 diabetes with invasive epithelial ovarian cancer (OR per 50% higher odds liability to type 2 diabetes: 1.00, 95% CI 0.97–1.02;P = 0.81)
or subtype-specific ovarian cancer (S3 Table).
Lifestyle factors
There was suggestive evidence for an association of lifetime smoking exposure with invasive epithelial ovarian cancer (OR per unit increase in smoking score: 1.36, 95% CI 1.04–1.78;
P = 0.02) (Fig 5;Table 2). A unit increase in smoking score is approximately equivalent to an individual smoking 10 cigarettes per day for 39 years and stopping 16 years ago or an individ-ual smoking 30 cigarettes per day for 14 years and stopping 9 years ago. In subtype-specific analyses, there was also suggestive evidence for an association of smoking with HGSC (OR
Fig 3. Inverse-variance-weighted estimates for the association of anthropometric traits with risk of invasive epithelial ovarian cancer, invasive epithelial ovarian cancer histotypes, and low malignant potential tumours. IEOC, invasive epithelial ovarian
cancer; OR, odds ratio. Causal estimates are scaled to represent the effect of a 1-SD increase in body mass index (kg/m2) and a 1-SD increase in height (cm).
Fig 4. Inverse-variance-weighted estimates for the association of clinical factors with risk of invasive epithelial ovarian cancer, invasive epithelial ovarian cancer histotypes, and low malignant potential tumours. IEOC, invasive epithelial ovarian cancer; OR,
odds ratio; PCOS, polycystic ovary syndrome. Causal estimates are scaled to represent the effect of a 50% higher odds liability to endometriosis, PCOS, or type 2 diabetes.
https://doi.org/10.1371/journal.pmed.1002893.g004
Fig 5. Inverse-variance-weighted estimates for the association of lifestyle factors with risk of invasive epithelial ovarian cancer, invasive epithelial ovarian cancer histotypes, and low malignant potential tumours. IEOC, invasive epithelial ovarian cancer; OR,
odds ratio. Causal estimates are scaled to represent the effect of a 1-unit increase in lifetime smoking exposure. https://doi.org/10.1371/journal.pmed.1002893.g005
1.44, 95% CI 1.05–1.98;P = 0.02) but little association with other subtypes. The smoking
find-ings for invasive epithelial ovarian cancer and HGSC were robust to horizontal pleiotropy sen-sitivity analyses (Tables2andS4).
Molecular risk factors
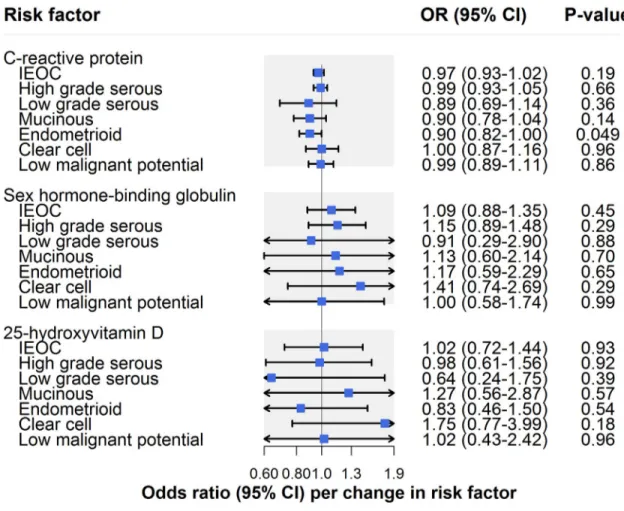
There was little evidence that CRP influenced invasive epithelial ovarian cancer risk (OR per unit increase in natural log CRP (mg/l): 0.97, 95% CI 0.93–1.02;P = 0.19) (Fig 6;Table 2). In analyses examining histotypes and low malignant potential tumours, there was suggestive evi-dence for an inverse association of CRP with endometrioid carcinoma (OR 0.90, 95% CI 0.82– 1.00;P = 0.049) (S5 Table). This association was robust to sensitivity analyses using MR– Egger, weighted median, and weighted mode methods in addition to using a restricted CRP instrument (exclusively using 4 SNPs inCRP: OR 0.72, 95% CI 0.42–1.22; P = 0.14). CRP was
not clearly associated with other histotypes or with low malignant potential tumours. There was no strong or suggestive evidence for an association of sex hormone binding globulin (OR per unit increase in natural-log-transformed sex hormone binding globulin [nmol/l]: 1.09, 95% CI 0.88–1.35;P = 0.45) or circulating 25-hydroxyvitamin D (OR per unit increase in
Fig 6. Inverse-variance-weighted estimates for the association of molecular risk factors with risk of invasive epithelial ovarian cancer, invasive epithelial ovarian cancer histotypes, and low malignant potential tumours. IEOC, invasive epithelial ovarian
cancer; OR, odds ratio. Causal estimates are scaled to represent the effect of a 1-unit increase in natural-log-transformed C-reactive protein (mg/l), a 1-unit increase in natural-log-transformed sex hormone binding globulin (nmol/l), and a 1-unit increase in natural-log-transformed 25-hydroxyvitamin D (ng/ml).
natural-log-transformed 25-hydroxyvitamin D [ng/ml]: OR 1.02, 95% CI 0.72–1.44;P = 0.93)
with invasive epithelial ovarian cancer risk (Fig 6;Table 2) or with subtype-specific ovarian cancer (S5 Table).
Discussion
This MR analysis of up to 66,450 women supports associations of genetic liability to endome-triosis and lifetime smoking exposure with invasive epithelial ovarian cancer risk but found little clear evidence to support roles of 10 other previously reported risk factors in ovarian car-cinogenesis. In analyses examining invasive epithelial ovarian cancer histotypes and low malig-nant potential tumours, there was strong or suggestive evidence for associations of ages at menarche and natural menopause, BMI, height, lifetime smoking exposure, CRP, and genetic liabilities to endometriosis and PCOS with ovarian cancer risk. There was little evidence to support associations of genetic liability to type 2 diabetes, parity, or circulating levels of 25-hydroxyvitamin D or sex hormone binding globulin with the various ovarian cancer out-comes assessed.
Though historically considered a homogeneous disease with a single cellular origin, epithe-lial ovarian cancer is now recognised as heterogeneous, consisting of multiple histological subtypes, each with its own distinct origins, morphological characteristics, and molecular alterations [22,47–50]. The largely histotype-specific findings in this analysis using genetic var-iants as proxies to minimise confounding and avoid reverse causation bias thus help to extend these insights further by supporting distinct causal pathways across invasive epithelial ovarian cancer histotypes.
Some of the histotype-specific findings are consistent with previous studies. For example, in agreement with previous observational and MR analyses [7–10,13,51,52], most risk factors did not show clear evidence of association with HGSC. Consistent with some studies, age at natural menopause was most strongly associated with endometrioid carcinoma [8], and height was most strongly associated with clear cell carcinoma [14,53]. While our finding of little evi-dence of an association of BMI with HGSC is consistent with previous observational and MR analyses, we were unable to examine—using the summarised genetic association data available to us—whether the previously reported 29% (95% CI 3%–61%) increased odds of non-HGSC (per 5-unit increase in genetically proxied BMI) was replicated in our sample [13,54].
Some findings in this MR analysis were not consistent with those observed in previous conventional observational and MR analyses. Most notably, previously reported associations between smoking and mucinous carcinoma [9,55–57] were not corroborated in MR analyses of lifetime smoking exposure. Though estimates from primary and sensitivity analyses all included the null line, inconsistencies in effect estimates across these analyses support pleiotro-pic biases distorting the causal effect estimate, though we cannot rule out that divergent effect estimates could also reflect the unit change in lifetime smoking exposure that our analyses are scaled to. Hypothetically, analyses scaled to a smaller unit change in lifetime smoking exposure would be expected to show greater convergence of effect estimates around the null, providing less appearance of “inconsistency” across effect estimates. Though parity has been consistently inversely associated with risk of ovarian cancer in conventional analyses [10,58–62], MR effect estimates suggesting a protective association of giving birth to more children were imprecise, and 95% confidence intervals spanned the null line. Given the few SNPs available to proxy for parity (2 independent variants in this analysis), these results likely reflect limited statistical power. Though genetically proxied height has previously been associated with increased risk of both invasive epithelial ovarian cancer (OR per 5-cm increase in height: 1.06, 95% CI 1.01– 1.11) and low malignant potential tumours (OR 1.15, 95% CI 1.02–1.29), we found little
consistent evidence for associations with height across our primary and sensitivity analyses, though 95% confidence intervals overlapped across both studies [14]. While this previous indi-vidual-data MR analysis was smaller than ours (16,395 versus 22,406 cases), the authors con-structed genetic instruments from individual-level data for height using 609 SNPs (versus 345 SNPs in our analysis), which may have afforded this previously reported analysis greater instrument strength and, thus, greater statistical power to detect effects reported. We restricted our analysis to 345 independent variants in order to allow us to employ various summary-level data sensitivity analyses that require independent variants in the instrument. Likewise, consis-tent with a previous MR analysis of 25-hydroxyvitamin D and multiple-site cancer risk (including ovarian cancer) [63], we were unable to replicate previously reported inverse associ-ations of genetically proxied 25-hydroxyvitamin D with epithelial ovarian cancer (OR per 20-nmol/l increase in 25-hydroxyvitamin D: 0.79, 95% CI 0.66–0.94) or HGSC (OR 0.65, 95% CI 0.50–0.84) [15]. When we employed the same 3 variants used to proxy 25-hydroxyvitamin D in this other study, along with the same SNP–exposure estimates within our analysis, we likewise found little evidence of association with invasive epithelial ovarian cancer (OR per 20-nmol/l increase: 0.91, 95% CI 0.81–1.04) or HGSC (OR 0.90, 95% CI 0.77–1.04).
Our MR analyses found some evidence for an unexpected inverse association of CRP, a marker of systemic inflammation, with endometrioid carcinoma. Given recent evidence suggesting a role of infectious agents in ovarian cancer [64,65], a possible protective effect of CRP on endometrioid carcinoma could speculatively reflect the involvement of CRP in acute immune response (i.e., protection against active bacterial and viral infections).
Overall, few previously reported risk factors showed clear evidence of a role in invasive epi-thelial ovarian cancer or HGSC, the most common (approximately 70% of cases) and lethal histotype, suggesting that some previously reported associations may have been driven by residual confounding, misclassification biases, or reverse causation [66]. A notable exception was suggestive evidence that smoking increased the odds of HGSC, consistent with some [67,68], but not all [9,55,64,65], observational analyses. An association of genetic liability to endometriosis with invasive epithelial ovarian cancer corroborates findings from conventional analyses that women with this condition are at elevated risk of subsequent disease [9,69]. This finding also suggests that subclinical manifestations of or pathways leading to endometri-osis may influence oncogenesis, indicating important avenues for future mechanistic work. While observational and MR estimates examining associations between measures of endome-triosis and risk of invasive epithelial ovarian cancer are qualitatively similar (i.e., in the same direction), it is important to emphasise that observational effect estimates for disease states examined in this analysis (i.e., endometriosis, PCOS, type 2 diabetes) cannot be compared quantitatively (i.e., in direction and magnitude) to the MR estimates presented in this analysis as the latter are examining the association of genetic liability to disease (i.e., subclinical mani-festations of or pathways leading to the disease), rather than presence of disease per se.
It is important to note that while the risk factors included in this analysis have all been iden-tified in systematic or narrative reviews and cancer prevention guidelines as being potentially implicated in ovarian cancer development, there are varying degrees of evidence from the observational literature supporting their role in cancer risk. For example, while both the WCRF/AICR 2014 report and Cancer Research UK (https://www.cancerresearchuk.org/ about-cancer/ovarian-cancer/risks-causes; accessed on 4 September 2019) state that excess body fatness is linked to ovarian cancer, only the WCRF/AICR 2014 report finds “convincing evidence” that adult attained height increases risk of this disease. Nulliparity and endometri-osis have been consistently associated with elevated ovarian cancer risk in observational stud-ies [8–10,69], whereas there is weaker evidence linking earlier age at menarche to cancer risk [8–10]. Though current cigarette smoking has been strongly linked to mucinous ovarian
cancer in large pooled analyses, associations with other subtypes have been less consistent [64,65]. Given that few well-powered studies to date have stratified analyses across common ovarian cancer subtypes, it is a challenge to develop a consensus on the current strength of evi-dence linking previously reported risk factors to these subtypes.
Strengths of this analysis include the use of a systematic approach to collate previously reported risk factors for epithelial ovarian cancer, the appraisal of the role of these risk factors in disease aetiology using a MR framework to reduce confounding and avoid reverse causation bias, the employment of complementary sensitivity analyses to rigorously assess for violations of MR assumptions, and the restriction of datasets utilised to women of primarily or exclu-sively European descent to minimise confounding through population stratification.
There are several limitations to these analyses. First, thoughF-statistics generated for most
risk factors suggested that results were unlikely to suffer from weak instrument bias, statistical power for some analyses of less common ovarian cancer subtypes (low grade serous, mucin-ous, and clear cell carcinomas) was likely modest, meaning that the possibility that some results may reflect “false negative” findings cannot be ruled out. This limited statistical power may account for instances where risk factors showed strong or suggestive evidence of associa-tion for a single subtype but for which there was little apparent evidence of heterogeneity in effect estimates across all subtypes assessed (e.g., for age at menarche and age at natural meno-pause analyses). As such, it is important to emphasise that for some risk factors, subtype-spe-cific findings are more likely to reflect differences in statistical power across subtypes than genuine differences in the aetiological role of that risk factor in disease onset. Further, given the low statistical power of sensitivity analyses employed to examine horizontal pleiotropy (MR–Egger, weighted median, and weighted mode estimators), particularly for analyses of less common ovarian cancer subtypes, we were unable to robustly discriminate whether divergent effect estimates across sensitivity analyses in these subtypes reflected evidence of horizontal pleiotropy or limited statistical power. Since analyses were performed using summarised genetic association data in aggregate, it was not possible to restrict age at natural menopause analyses exclusively to participants who had undergone menopause. However, given that most ovarian cancer cases occur after menopause and that age-matched controls were used, the inclusion of some pre- or perimenopausal women in these analyses would likely have biased results toward the null (i.e., providing a conservative effect estimate). A genetic instrument for lifetime smoking exposure was constructed from genome-wide association analyses reported in a preprint [38]. As with all analyses that have not been formally peer-reviewed, findings from preprints may be subject to change prior to publication. Though a multiple-testing cor-rection was applied to findings from analyses to account for the 12 risk factors examined, false positive findings arising from the number of analyses performed across ovarian cancer out-comes cannot be ruled out, especially as statistical power was limited in analyses of histotypes. Additionally, all models employed assumed no interaction (e.g., gene–environment, gene– gene) or effect modification, and linear relationships between risk factors and ovarian cancer. Lastly, the use of a MR framework precluded directly examining the role of some ovarian can-cer risk factors that do not have robust genetic variants available to serve as proxies (e.g., use of oral contraceptives, hormone replacement therapy).
Though the largely null findings for invasive epithelial ovarian cancer in this analysis can assist in de-prioritising certain intervention targets for ovarian cancer prevention, they also underscore the challenges in establishing effective primary prevention strategies for this malignancy. To date, beyond risk-reducing surgical interventions, only regular use of oral contraceptive pills has shown compelling evidence of reducing the risk of subsequent dis-ease [61,70,71]. The continued identification of robust genetic variants to proxy other life-style and molecular factors previously reported to influence ovarian cancer (e.g., additional
sex hormones, gonadotropins, inflammatory markers) will allow for a more refined assess-ment of the influence of these factors in ovarian carcinogenesis [51,72]. Additionally, fur-ther work to understand the possible mechanisms through which factors that appear to influence ovarian cancer in these analyses promote oncogenesis (e.g., genetic liability to endometriosis, low CRP levels) could help to increase the scope for prevention opportuni-ties across the life course. Lastly, for the vast majority of women who develop ovarian cancer with no previous history of smoking and who do not have endometriosis [9,55,73], there is a need to identify novel modifiable risk factors for this condition, as has been advocated else-where [74,75].
Conclusions
Of 12 previously reported risk factors examined for association with invasive epithelial ovarian cancer, only genetic liability to endometriosis and lifetime smoking exposure showed evidence of association with disease risk. When stratified on histotype and low malignant potential tumours, most risk factors were associated with 1 or more subtypes, underscoring the hetero-geneous nature of this disease. While this aetiological heterogeneity could have implications for understanding mechanisms of tumour pathology and for studies examining histotype-spe-cific prognosis, given the low incidence of epithelial ovarian cancer in the general population, prevention strategies targeting factors causally implicated in overall epithelial ovarian cancer risk are most likely to confer important population-level reductions in disease incidence. Along with effective clinical management of endometriosis and policies to prevent the initia-tion of tobacco use and encourage smoking cessainitia-tion, established preveninitia-tion strategies like the use of oral contraceptives continue to be an important mechanism for reducing ovarian cancer risk. The identification of novel modifiable risk factors remains an important priority for the control of epithelial ovarian cancer.
Supporting information
S1 Data. Summary genetic association data used to perform analyses.
(XLSX)
S1 Plots. Scatter plots for findings showing strong or suggestive evidence of association in IVW analyses that were consistent in sensitivity analyses.
(PDF)
S2 Plots. Leave-one-out permutation analyses.
(PDF)
S1 STROBE Checklist. STROBE reporting checklist.
(DOC)
S1 Table. IVW and sensitivity analysis estimates for the association of reproductive factors with risk of invasive epithelial ovarian cancer histotypes and low malignant potential tumours.
(DOCX)
S2 Table. IVW and sensitivity analysis estimates for the association of anthropometric traits with risk of invasive epithelial ovarian cancer histotypes and low malignant potential tumours.
S3 Table. IVW and sensitivity analysis estimates for the association of clinical factors with risk of invasive epithelial ovarian cancer histotypes and low malignant potential tumours.
(DOCX)
S4 Table. IVW and sensitivity analysis estimates for the association of lifestyle factors with risk of invasive epithelial ovarian cancer histotypes and low malignant potential tumours.
(DOCX)
S5 Table. IVW and sensitivity analysis estimates for the association of molecular risk fac-tors with risk of invasive epithelial ovarian cancer histotypes and low malignant potential tumours.
(DOCX)
S1 Text. Description of OCAC and OncoArray analyses, complete PubMed and Web of Science search strategies, review papers identified from PubMed and Web of Science searches, risk factors ascertained for inclusion, and risk factor inclusion stages.
(DOCX)
S2 Text. Description of GWAS and genetic instrument selection, sensitivity analyses to examine horizontal pleiotropy, assessment of sex-specific instruments, and risk-factor-specific sensitivity analyses.
(DOCX)
Acknowledgments
The authors would like to thank the participants of the individual studies contributing to OCAC for their participation in these studies along with the principal investigators of OCAC for generating the data utilised for this analysis and for making these data available in the pub-lic domain.
Author Contributions
Conceptualization: James Yarmolinsky, Caroline L. Relton, Artitaya Lophatananon, Jie
Zheng, Richard M. Martin, Sarah J. Lewis.
Data curation: Usha Menon, Aleksandra Gentry-Maharaj, Peter Fasching, Wei Zheng, Woo
Yin Ling, Sue K. Park, Byoung-Gie Kim, Ji-Yeob Choi, Boyoung Park.
Investigation: Axel Walther, George Davey Smith.
Methodology: James Yarmolinsky, Caroline L. Relton, Artitaya Lophatananon, Kenneth
Muir, Richard M. Martin, Sarah J. Lewis.
Writing – original draft: James Yarmolinsky.
Writing – review & editing: James Yarmolinsky, Caroline L. Relton, Artitaya Lophatananon,
Kenneth Muir, Usha Menon, Aleksandra Gentry-Maharaj, Axel Walther, Jie Zheng, Peter Fasching, Wei Zheng, Woo Yin Ling, Sue K. Park, Byoung-Gie Kim, Ji-Yeob Choi, Boy-oung Park, George Davey Smith, Richard M. Martin, Sarah J. Lewis.
References
1. Ferlay J, Shin HR, Bray F, Forman D, Mathers C, Parkin DM. Estimates of worldwide burden of cancer in 2008: GLOBOCAN 2008. Int J Cancer. 2010; 127(12):2893–917.https://doi.org/10.1002/ijc.25516 PMID:21351269
2. Siegel R, Naishadham D, Jemal A. Cancer statistics, 2012. CA Cancer J Clin. 2012; 62(1):10–29. https://doi.org/10.3322/caac.20138PMID:22237781
3. Henderson BE, Feigelson HS. Hormonal carcinogenesis. Carcinogenesis. 2000; 21(3):427–33.https:// doi.org/10.1093/carcin/21.3.427PMID:10688862
4. Noone AM, Howlander N, Krapcho M, Miller D, Brest A, Yu M, et al., editors. SEER cancer statistics review, 1975–2015. Bethesda: National Cancer Institute; 2018.
5. Cress RD, Chen YS, Morris CR, Petersen M, Leiserowitz GS. Characteristics of long-term survivors of epithelial ovarian cancer. Obstet Gynecol. 2015; 126(3):491–7.https://doi.org/10.1097/AOG. 0000000000000981PMID:26244529
6. Berek JS Bast RC Jr. Epithelial ovarian cancer. In Kufe DW, Pollock RE, Weichselbaum RR, Bast RC Jr, Gansler TS, Holland JF, et al., editors. Holland-Frei cancer medicine. 6th edition. Hamilton (ON): BC Decker; 2003.
7. Fortner RT, Ose J, Merritt MA, Schock H, Tjonneland A, Hansen L, et al. Reproductive and hormone-related risk factors for epithelial ovarian cancer by histologic pathways, invasiveness and histologic sub-types: results from the EPIC cohort. Int J Cancer. 2015; 137(5):1196–208.https://doi.org/10.1002/ijc. 29471PMID:25656413
8. Gates MA, Rosner BA, Hecht JL, Tworoger SS. Risk factors for epithelial ovarian cancer by histologic subtype. Am J Epidemiol. 2010; 171(1):45–53.https://doi.org/10.1093/aje/kwp314PMID:19910378 9. Wentzensen N, Poole EM, Trabert B, White E, Arslan AA, Patel AV, et al. Ovarian cancer risk factors by
histologic subtype: an analysis from the Ovarian Cancer Cohort Consortium. J Clin Oncol. 2016; 34 (24):2888–98.https://doi.org/10.1200/JCO.2016.66.8178PMID:27325851
10. Yang HP, Trabert B, Murphy MA, Sherman ME, Sampson JN, Brinton LA, et al. Ovarian cancer risk fac-tors by histologic subtypes in the NIH-AARP Diet and Health Study. Int J Cancer. 2012; 131(4):938–48. https://doi.org/10.1002/ijc.26469PMID:21960414
11. Davey Smith G, Ebrahim S. ‘Mendelian randomization’: can genetic epidemiology contribute to under-standing environmental determinants of disease? Int J Epidemiol. 2003; 32(1):1–22.https://doi.org/10. 1093/ije/dyg070PMID:12689998
12. Yarmolinsky J, Wade KH, Richmond RC, Langdon RJ, Bull CJ, Tilling KM, et al. Causal inference in cancer epidemiology: what is the role of Mendelian randomization? Cancer Epidemiol Biomarkers Prev. 2018; 27(9):995–1010.https://doi.org/10.1158/1055-9965.EPI-17-1177PMID:29941659
13. Dixon SC, Nagle CM, Thrift AP, Pharoah PD, Pearce CL, Zheng W, et al. Adult body mass index and risk of ovarian cancer by subtype: a Mendelian randomization study. Int J Epidemiol. 2016; 45(3):884– 95.https://doi.org/10.1093/ije/dyw158PMID:27401727
14. Dixon-Suen SC, Nagle CM, Thrift AP, Pharoah PDP, Ewing A, Pearce CL, et al. Adult height is associ-ated with increased risk of ovarian cancer: a Mendelian randomisation study. Br J Cancer. 2018; 118 (8):1123–9.https://doi.org/10.1038/s41416-018-0011-3PMID:29555990
15. Ong JS, Cuellar-Partida G, Lu Y, Australian Ovarian Cancer Study, Fasching PA, Hein A, et al. Associa-tion of vitamin D levels and risk of ovarian cancer: a Mendelian randomizaAssocia-tion study. Int J Epidemiol. 2016; 45(5):1619–30.https://doi.org/10.1093/ije/dyw207PMID:27594614
16. Amos CI, Dennis J, Wang Z, Byun J, Schumacher FR, Gayther SA, et al. The OncoArray Consortium: a network for understanding the genetic architecture of common cancers. Cancer Epidemiol Biomarkers Prev. 2017; 26(1):126–35.https://doi.org/10.1158/1055-9965.EPI-16-0106PMID:27697780 17. Phelan CM, Kuchenbaecker KB, Tyrer JP, Kar SP, Lawrenson K, Winham SJ, et al. Identification of 12
new susceptibility loci for different histotypes of epithelial ovarian cancer. Nat Genet. 2017; 49(5):680– 91.https://doi.org/10.1038/ng.3826PMID:28346442
18. 1000 Genomes Project Collaboration, Auton A, Brooks LD, Durbin RM, Garrison EP, Kang HM, et al. A global reference for human genetic variation. Nature. 2015; 526(7571):68–74.https://doi.org/10.1038/ nature15393PMID:26432245
19. Bowtell DD, Bohm S, Ahmed AA, Aspuria PJ, Bast RC Jr, Beral V, et al. Rethinking ovarian cancer II: reducing mortality from high-grade serous ovarian cancer. Nat Rev Cancer. 2015; 15(11):668–79. https://doi.org/10.1038/nrc4019PMID:26493647
20. Crane TE, Khulpateea BR, Alberts DS, Basen-Engquist K, Thomson CA. Dietary intake and ovarian cancer risk: a systematic review. Cancer Epidemiol Biomarkers Prev. 2014; 23(2):255–73.https://doi. org/10.1158/1055-9965.EPI-13-0515PMID:24142805
21. Hunn J, Rodriguez GC. Ovarian cancer: etiology, risk factors, and epidemiology. Clin Obstet Gynecol. 2012; 55(1):3–23.https://doi.org/10.1097/GRF.0b013e31824b4611PMID:22343225
22. Karnezis AN, Cho KR, Gilks CB, Pearce CL, Huntsman DG. The disparate origins of ovarian cancers: pathogenesis and prevention strategies. Nat Rev Cancer. 2017; 17(1):65–74.https://doi.org/10.1038/ nrc.2016.113PMID:27885265
23. Trope CG, Kaern J, Davidson B. Borderline ovarian tumours. Best Pract Res Clin Obstet Gynaecol. 2012; 26(3):325–36.https://doi.org/10.1016/j.bpobgyn.2011.12.006PMID:22321906
24. Webb PM, Jordan SJ. Epidemiology of epithelial ovarian cancer. Best Pract Res Clin Obstet Gynaecol. 2017; 41:3–14.https://doi.org/10.1016/j.bpobgyn.2016.08.006PMID:27743768
25. World Cancer Research Fund, American Institute for Cancer Research. Ovarian cancer 2014 report: food, nutrition, physical activity, and the prevention of ovarian cancer. London: World Cancer Research Fund; 2014 [cited 2019 Jul 19].https://www.wcrf.org/sites/default/files/Ovarian-Cancer-2014-Report.pdf. 26. MacArthur J, Bowler E, Cerezo M, Gil L, Hall P, Hastings E, et al. The new NHGRI-EBI catalog of
pub-lished genome-wide association studies (GWAS Catalog). Nucleic Acids Res. 2017; 45(D1):D896–901. https://doi.org/10.1093/nar/gkw1133PMID:27899670
27. Hemani G, Zheng J, Elsworth B, Wade KH, Haberland V, Baird D, et al. The MR-Base platform supports systematic causal inference across the human phenome. Elife. 2018; 7:e34408.https://doi.org/10. 7554/eLife.34408PMID:29846171
28. Barban N, Jansen R, de Vlaming R, Vaez A, Mandemakers JJ, Tropf FC, et al. Genome-wide analysis identifies 12 loci influencing human reproductive behavior. Nat Genet. 2016; 48(12):1462–72.https:// doi.org/10.1038/ng.3698PMID:27798627
29. Day FR, Ruth KS, Thompson DJ, Lunetta KL, Pervjakova N, Chasman DI, et al. Large-scale genomic analyses link reproductive aging to hypothalamic signaling, breast cancer susceptibility and BRCA1-medi-ated DNA repair. Nat Genet. 2015; 47(11):1294–303.https://doi.org/10.1038/ng.3412PMID:26414677 30. Day FR, Thompson DJ, Helgason H, Chasman DI, Finucane H, Sulem P, et al. Genomic analyses
iden-tify hundreds of variants associated with age at menarche and support a role for puberty timing in cancer risk. Nat Genet. 2017; 49(6):834–41.https://doi.org/10.1038/ng.3841PMID:28436984
31. Mbarek H, Steinberg S, Nyholt DR, Gordon SD, Miller MB, McRae AF, et al. Identification of common genetic variants influencing spontaneous dizygotic twinning and female fertility. Am J Hum Genet. 2016; 98(5):898–908.https://doi.org/10.1016/j.ajhg.2016.03.008PMID:27132594
32. Locke AE, Kahali B, Berndt SI, Justice AE, Pers TH, Day FR, et al. Genetic studies of body mass index yield new insights for obesity biology. Nature. 2015; 518(7538):197–206.https://doi.org/10.1038/ nature14177PMID:25673413
33. Wood AR, Esko T, Yang J, Vedantam S, Pers TH, Gustafsson S, et al. Defining the role of common var-iation in the genomic and biological architecture of adult human height. Nat Genet. 2014; 46(11):1173– 86.https://doi.org/10.1038/ng.3097PMID:25282103
34. Day F, Karaderi T, Jones MR, Meun C, He C, Drong A, et al. Large-scale genome-wide meta-analysis of polycystic ovary syndrome suggests shared genetic architecture for different diagnosis criteria. PLoS Genet. 2018; 14(12):e1007813.https://doi.org/10.1371/journal.pgen.1007813PMID:30566500 35. Morris AP, Voight BF, Teslovich TM, Ferreira T, Segre AV, Steinthorsdottir V, et al. Large-scale
associ-ation analysis provides insights into the genetic architecture and pathophysiology of type 2 diabetes. Nat Genet. 2012; 44(9):981–90.https://doi.org/10.1038/ng.2383PMID:22885922
36. Sapkota Y, Steinthorsdottir V, Morris AP, Fassbender A, Rahmioglu N, De Vivo I, et al. Meta-analysis identifies five novel loci associated with endometriosis highlighting key genes involved in hormone metabolism. Nat Commun. 2017; 8:15539.https://doi.org/10.1038/ncomms15539PMID:28537267 37. Jiang X, O’Reilly PF, Aschard H, Hsu YH, Richards JB, Dupuis J, et al. Genome-wide association study
in 79,366 European-ancestry individuals informs the genetic architecture of 25-hydroxyvitamin D levels. Nat Commun. 2018; 9(1):260.https://doi.org/10.1038/s41467-017-02662-2PMID:29343764
38. Wootton RE, Richmond RC, Stuijfzand BG, Lawn RB, Sallis HM, Taylor GMJ, et al. Causal effects of lifetime smoking on risk for depression and schizophrenia: evidence from a Mendelian randomisation study. bioRxiv. 2018 Dec 20.https://doi.org/10.1101/381301
39. Coviello AD, Haring R, Wellons M, Vaidya D, Lehtimaki T, Keildson S, et al. A genome-wide association meta-analysis of circulating sex hormone-binding globulin reveals multiple loci implicated in sex steroid hormone regulation. PLoS Genet. 2012; 8(7):e1002805.https://doi.org/10.1371/journal.pgen.1002805 PMID:22829776
40. Dehghan A, Dupuis J, Barbalic M, Bis JC, Eiriksdottir G, Lu C, et al. Meta-analysis of genome-wide association studies in>80 000 subjects identifies multiple loci for C-reactive protein levels. Circulation. 2011; 123(7):731–8.https://doi.org/10.1161/CIRCULATIONAHA.110.948570PMID:21300955 41. Burgess S, Thompson SG, CRP CHD Genetics Collaboration. Avoiding bias from weak instruments in
Mendelian randomization studies. Int J Epidemiol. 2011; 40(3):755–64.https://doi.org/10.1093/ije/ dyr036PMID:21414999
42. Burgess S, Dudbridge F, Thompson SG. Combining information on multiple instrumental variables in Mendelian randomization: comparison of allele score and summarized data methods. Stat Med. 2016; 35(11):1880–906.https://doi.org/10.1002/sim.6835PMID:26661904