The Journal of Clinical Investigation
R e s e a R c h a R t i c l eIntroduction
Collagen is the most abundant intrinsic matrix scaffolding protein and contributes to tissue tensile strength (1). Various aspects of collagen metabolism, including its expression, deposition, orga-nization, and turnover, are aberrant in epithelial cancer and have been implicated in tumor progression (2). Evidence from multiple types of human epithelial cancers and experimental tumor mod-els suggests that tumor extracellular matrix (ECM) stiffness is enhanced by an accumulation of collagen stabilized by covalent intra- and inter-molecular cross-links (3). Collagen cross-linking is initiated in the extracellular space by the action of lysyl oxidase (LOX), a secreted copper-dependent amine oxidase that converts
telopeptidyl lysine (Lys) and hydroxylysine (Hyl) residues to reac-tive aldehydes (Lysald and Hylald, respectively) that condense with juxtaposed Lys, Hyl, and histidine (His) residues to form vari-ous types of cross-links (4). The discovery that tumor cells have high expression of LOX and LOX-like family members led to the development of pharmacological inhibitors of these enzymes that, when administered to tumor-bearing animals, decrease the amount of collagen cross-links in tumors and suppress metasta-sis, suggesting that the amount of collagen cross-links in tumors controls disease progression (5).
The types of collagen cross-links that form in normal connec-tive tissues are determined prior to cross-link formation by the hydroxylation of telopeptidyl and helical Lys residues on collagen (4). Mediating these changes are lysyl hydroxylases (LH1, LH2, and LH3) encoded by distinct procollagen-lysine, 2-oxoglutarate 5-dioxygenase (PLOD) genes; these intracellular enzymes induce hydroxylation of Lys residues on collagen prior to the formation of triple helical pro-collagen molecules (6–11). Following secretion of pro-collagen molecules into the extracellular space, the telopep-tidyl Hyl residues undergo LOX-induced oxidative deamination into Hylald, which then forms Hylald-derived aldimine cross-links Epithelial tumor metastasis is preceded by an accumulation of collagen cross-links that heighten stromal stiffness and
stimulate the invasive properties of tumor cells. However, the biochemical nature of collagen cross-links in cancer is still unclear. Here, we postulated that epithelial tumorigenesis is accompanied by changes in the biochemical type of collagen cross-links. Utilizing resected human lung cancer tissues and a p21CIP1/WAF1-deficient, K-rasG12D-expressing murine metastatic lung cancer model, we showed that, relative to normal lung tissues, tumor stroma contains higher levels of hydroxylysine aldehyde– derived collagen cross-links (HLCCs) and lower levels of lysine aldehyde–derived cross-links (LCCs), which are the predominant types of collagen cross-links in skeletal tissues and soft tissues, respectively. Gain- and loss-of-function studies in tumor cells showed that lysyl hydroxylase 2 (LH2), which hydroxylates telopeptidyl lysine residues on collagen, shifted the tumor stroma toward a high-HLCC, low-LCC state, increased tumor stiffness, and enhanced tumor cell invasion and metastasis. Together, our data indicate that LH2 enhances the metastatic properties of tumor cells and functions as a regulatory switch that controls the relative abundance of biochemically distinct types of collagen cross-links in the tumor stroma.
Lysyl hydroxylase 2 induces a collagen cross-link
switch in tumor stroma
Yulong Chen,1 Masahiko Terajima,2 Yanan Yang,3 Li Sun,1 Young-Ho Ahn,1,4 Daniela Pankova,1 Daniel S. Puperi,5
Takeshi Watanabe,2 Min P. Kim,6 Shanda H. Blackmon,6 Jaime Rodriguez,7 Hui Liu,7 Carmen Behrens,7 Ignacio I. Wistuba,7 Rosalba Minelli,8 Kenneth L. Scott,8 Johannah Sanchez-Adams,9 Farshid Guilak,9 Debananda Pati,10 Nishan Thilaganathan,1 Alan R. Burns,11 Chad J. Creighton,12,13 Elisabeth D. Martinez,14,15 Tomasz Zal,16 K. Jane Grande-Allen,5 Mitsuo Yamauchi,2 and Jonathan M. Kurie1
1Department of Thoracic/Head and Neck Medical Oncology, University of Texas MD Anderson Cancer Center, Houston, Texas, USA. 2NC Oral Health Institute, University of North Carolina at Chapel Hill, Chapel Hill, North Carolina, USA. 3Division of Pulmonary and Critical Care Medicine, Department of Biochemistry and Molecular Biology, Mayo Clinic Cancer Center, Rochester, Minnesota, USA. 4Department of Molecular Medicine, Ewha Womans University School of Medicine, Seoul, South Korea. 5Department of Bioengineering, Rice University, Houston, Texas, USA. 6Department of Surgery, Houston Methodist Research Institute, Houston, Texas, USA. 7Department of Translational Molecular Pathology, University of Texas MD Anderson Cancer Center, Houston, Texas, USA. 8Department of Molecular and Human Genetics, Baylor College of Medicine, Houston, Texas, USA. 9Department of Orthopaedic Surgery, Duke University Medical Center, Durham, North Carolina, USA. 10Department of Pediatrics, Baylor College of Medicine, Houston, Texas, USA. 11College of Optometry, University of Houston, Houston, Texas, USA. 12Department of Bioinformatics and Computational Biology, University of Texas MD Anderson Cancer Center, Houston, Texas, USA. 13Department of Medicine and Dan L. Duncan Cancer Center, Baylor College of Medicine, Houston, Texas, USA. 14Hamon Center for Therapeutic Oncology Research and 15Department of Pharmacology, UT Southwestern Medical Center at Dallas, Dallas, Texas, USA. 16Department of Immunology, University of Texas MD Anderson Cancer Center, Houston, Texas, USA.
Note regarding evaluation of this manuscript: Manuscripts authored by scientists
associated with Duke University, the University of North Carolina at Chapel Hill, Duke-NUS, and the Sanford-Burnham Medical Research Institute are handled not by members of the editorial board but rather by the science editors, who consult with selected external editors and reviewers.
Conflict of interest: The authors have declared that no conflict of interest exists. Submitted: December 12, 2013; Accepted: January 5, 2015.
Reference information: J Clin Invest. 2015;125(3):1147–1162. doi:10.1172/JCI74725.
of metastasis in mice that develop K-ras-mutant lung adenocarci-nomas. However, KC mice had fewer lung tumors than Cdkn1aWT
K-rasLA1 mice did (Supplemental Figure 1A; supplemental material available online with this article; doi:10.1172/JCI74725DS1), and the incidence of adenocarcinomas was similar in the two groups (Supplemental Figure 1B), showing that the prometastatic effect of p21 deficiency was not associated with increased numbers or accelerated growth of primary lung tumors.
Metastasis of KC cells does not require p21 deficiency. Recogniz-ing that KC mice are completely deficient in p21, we reasoned that metastasis could result from p21 deficiency in tumor cells, host tissues, or both. To examine the contribution of p21 deficiency in tumor cells, we established 4 lung adenocarcinoma cell lines (KC1–KC4) from lung tumors in KC mice and 2 lung adenocarci-noma cell lines (K1 and K2) from Cdkn1aWT K-rasLA1 mice. All of these cells expressed SPC (Supplemental Figure 2), had somati-cally recombined the latent K-rasG12D allele (Supplemental Figure
3A), and were either p21 deficient (KC1–KC4) or replete (K1 and K2) (Supplemental Figure 3B)(See complete unedited blots in Supplemental Material). Following injection of the various cell types into the flanks of syngeneic, immunocompetent Cdkn1a-null mice, primary tumors and lung metastases were quantified. As groups, p21-deficient tumors were larger (Figure 2A) and generated more lung metastases (Figure 2B) than p21-replete tumors did. However, the p21-deficient tumors were not uni-formly tumorigenic and metastatic; KC1–KC3 tumors were sig-nificantly larger than KC4 tumors, and they generated more lung metastases than KC4 tumors did (Figure 2, A and B). Thus, KC cell lines generated tumors with variable biological properties in a p21-deficient host. To determine whether p21 reconstitution in tumor cells suppresses the growth and metastasis of tumors, we injected KC3 cells that express ectopic p21 or empty vector (Sup-plemental Figure 4A) into syngeneic Cdkn1aWT or Cdkn1a-null
mice. We found that p21 reconstitution in tumor cells did not sup-press tumor size or metastasis in either host (Supplemental Fig-ure 4, B and C). To determine whether p21 expression in the host modifies the metastatic potential of p21-deficient tumor cells, we injected p21-deficient tumor cells that were highly (KC2) or poorly (KC4) metastatic into syngeneic Cdkn1aWT or Cdkn1a-null
mice. We found that p21 deficiency in the host did not increase the size or metastatic propensity of KC2 tumors (Supplemental Figure 4, D and E) or KC4 tumors (Supplemental Figure 4, F and G). Collectively, these data suggest that p21 deficiency in tumor cells exerted a prometastatic effect at early stages of lung tum-origenesis and that the impact was irreversible.
To gain insight into how p21 deficiency regulates tumor cell metastatic capacity, we compared the in vitro properties of the 6 cell lines. Although the cell lines all exhibited epithelial mor-phologies, forming tight clusters of polygonal cells on plastic (Fig-ure 2C), they varied in their proliferative, migratory, and invasive activities. As groups, p21-deficient cell lines (KC1–KC4) were more migratory than p21-replete cells (K1 and K2) (Figure 2D), but the two groups of cells were not significantly different in their invasive (Figure 2D), proliferative (Supplemental Figure 5A), or colony-forming activities (Supplemental Figure 5B). Cocultured in Boyden chambers, KC2 cells suppressed K1 cell invasion (Sup-plemental Figure 6A), whereas KC2 cells did not alter the mor-that spontaneously rearrange into stable ketoamines; these further
mature into stable Hylald-derived collagen cross-links (HLCCs) (12). In contrast, LOX-induced oxidative deamination of telopep-tidyl Lys residues forms a labile aldimine or an aldol condensation product that matures into unstable Lysald-derived collagen cross-links (LCCs) (12). We have shown that overexpression of LH2 in osteoblasts induces a switch in the predominant type of collagen cross-link from LCC to HLCC, which qualitatively affects fibril-logenesis and matrix organization (7, 8). HLCCs are abundant in skeletal tissues that require high mechanical strength, whereas LCCs are abundant in soft connective tissues (4). HLCC’s central role in matrix organization and function is illustrated by the fact that patients with Bruck syndrome, a recessively inherited disorder with inactivating mutations in the gene encoding LH2 (PLOD2/ LH2), have traits of osteogenesis imperfecta with congenital con-tractures of the large joints (13). Conversely, skin fibroblasts from patients with systemic sclerosis, a fibrotic disease involving skin and other organs, have elevated LH2 expression and increased production of HLCCs (11, 14).
In contrast to the evidence from patients with connective tis-sue disorders, little is known about the biochemical nature of col-lagen cross-links in cancer. It is unclear whether the production of LCCs and HLCCs changes during tumor progression or whether these types of cross-links play distinct roles in the regulation of ECM maturation and metastasis promotion. Here, we postulated that tumor cells control the relative levels of HLCCs and LCCs in the tumor stroma and that a switch toward a high-HLCC, low-LCC state favors metastasis.
Results
Cdkn1a/p21WAF1/CIP1 (p21) deficiency promotes metastasis of
K-ras-mutant lung adenocarcinomas. To test our hypothesis, we interbred K-rasLA1 mice, which develop non-metastatic lung ade-nocarcinomas from expression of a somatically activated K-rasG12D allele (15), with Cdkn1a-null mice (16), which are deficient in p21, a cyclin-dependent kinase inhibitor that suppresses fibrosis in lung tis-sues (17). p21 is silenced epigenetically in lung cancer cells, and p21 silencing is associated with advanced stage of disease in lung can-cer and accelerates the progression of epithelial tumors induced by irradiation or H-ras expression in mice (18–23). However, it is unclear whether p21 functions as a suppressor of fibrosis and/or metastasis in K-ras-mutant lung adenocarcinomas.
To address this question, we generated mouse cohorts that had neither, either, or both mutant alleles (K-rasG12D and Cdkn1a–/–).
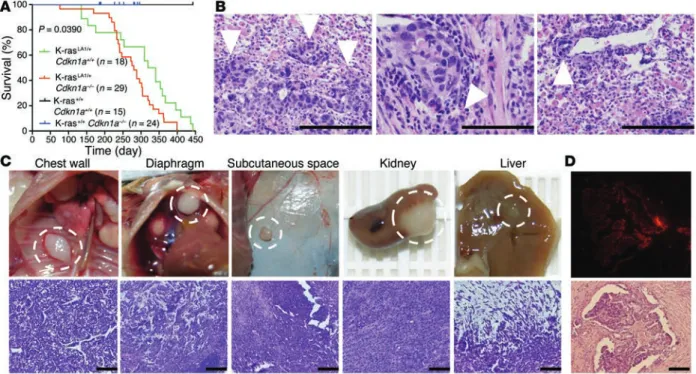
Alone, p21 deficiency was associated with no reductions in sur-vival or visible spontaneous tumors in the lung or other organs within the time frame of this study, which is consistent the rela-tively weak oncogenic activity of p21 deficiency in the absence of other oncogenic events (21, 22). However, K-rasLA1 mice that were Cdkn1a-null (KC mice) had a shorter mean time to death than did Cdkn1aWT K-rasLA1 mice (Figure 1A). Metastases were present in KC mice (14 of 29, or 48%) but not Cdkn1aWT K-rasLA1 mice (0 of 18). KC mice had invasive lung adenocarcinomas (Figure 1B) and mul-tifocal metastases that were histologically confirmed to be adeno-carcinomas (Figure 1C). A pleural metastasis expressed surfactant protein C (SPC) (Figure 1D), a type II alveolar cell marker consis-tent with lung origin. Thus, p21 deficiency increased the incidence
The Journal of Clinical Investigation
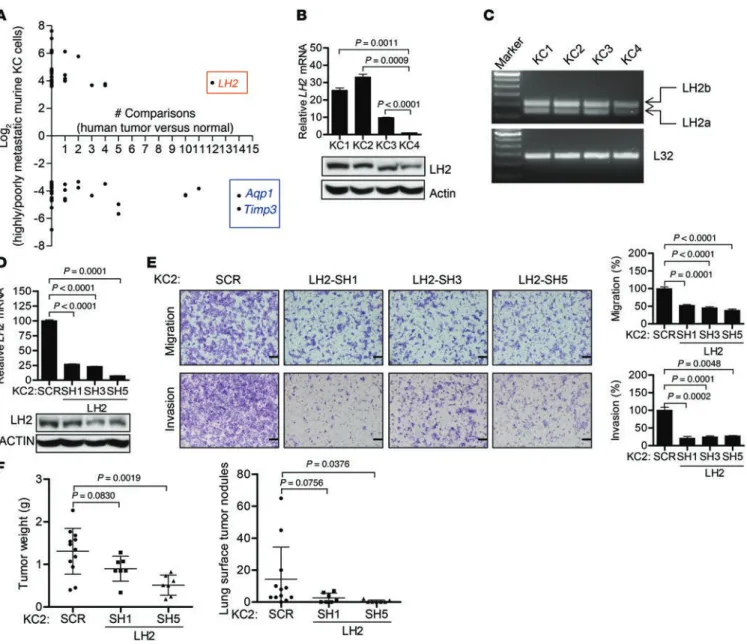
R e s e a R c h a R t i c l emurine model are coordinately up- or downregulated in human lung cancer, we probed a database that compares human lung can-cer with normal lung tissues (https://www.oncomine.org) with 67 genes that had the greatest fold change (31 up- and 36 downregu-lated) in our 1,809-gene expression signature. Twenty-five genes were coordinately up- or downregulated (P < 0.01, fold-change >1.5 relative to normal lung) in at least one of the human datasets (Figure 3A). Of these, AQP1 (a water channel protein) and TIMP3 (a metalloproteinase inhibitor) were decreased, and LH2 (a collagen- modifying enzyme) was increased, in the majority of the tumor-to-normal tissue comparisons (Figure 3A and Supplemental Table 3) and in highly metastatic KC cells (Supplemental Figure 8A); however, only Aqp1 differed between p21-deficient and -replete cells (Supplemental Figure 8A). Furthermore, ectopic p21 expres-sion in KC3 cells did not reverse the upregulation of LH2 or the downregulation of Aqp1 or Timp3 (Supplemental Figure 8B). Thus, AQP1, TIMP3, and LH2 were of interest as candidate mediators of a p21-independent transcriptional program that regulates the met-astatic propensity of KC cells.
LH2 promotes lung cancer metastatic behavior and predicts poor prognosis in patients. Gain-of-function studies on TIMP3 and AQP1, which were downregulated in highly metastatic KC cells, revealed no detectable effect of ectopic expression of either gene on the migration or invasion of KC2 cells in Boyden cham-bers (Supplemental Figure 9, A and B). Expression levels of the third gene of interest, LH2, were 10–30 times higher in the highly metastatic KC cells (Figure 3B) and included both LH2 isoforms, phology of K1 cell spheroids in collagen gels (Supplemental Figure
6B), suggesting that secreted paracrine factors regulated tumor cell invasive activity in a contextual manner. Furthermore, highly metastatic cells (KC1–KC3) were more invasive than the poorly metastatic KC4 cells (Figure 2D), whereas poorly metastatic KC4 cells were more proliferative in monolayer culture (Supplemental Figure 5A) and formed more colonies in soft agar (Supplemental Figure 5B). Restoring p21 expression in KC3 cells did not suppress cell proliferation (Supplemental Figure 6C), migration, or inva-sion (Supplemental Figure 6D), indicating that p21 deficiency led to irreversible changes.
LH2 expression is upregulated in metastatic tumors. These find-ings raised the possibility that KC cells had acquired secondary genomic or epigenetic alterations. Each of the 6 cell lines exhibited aneuploidy (Supplemental Figure 7A) and contained chromosomal translocations (Supplemental Figure 7B), but no recurrent translo-cations were identified. Given that p21-replete and -deficient tumor cells were similarly aneuploid, aneuploidy was not examined fur-ther as a candidate driver of metastasis in these cells.
Next, we turned our attention to transcriptional regulation as a basis for metastasis. Using poorly metastatic KC4 cells as the reference, we identified 9,963 transcripts that were differentially expressed (P < 0.01, >1.5-fold change) in at least 1 of the 3 highly metastatic KC cells (Supplemental Figure 7C and Supplemental Table 1), of which 1,809 genes were up- or downregulated in all 3 highly metastatic KC cells (Supplemental Figure 7, D and E, and Supplemental Table 2). To determine whether genes from the
Figure 1. p21 loss confers metastatic capacity to lung adenocarcinomas in K-rasLA1 mice. (A) Kaplan-Meier survival analysis of a single experiment in
which mouse cohorts were generated with the indicated genotypes and sample sizes. The P value was calculated with the log-rank (Mantel-Cox) test of the difference between mean survival times in the p21-replete (K-rasLA1/+ Cdkn1a+/+) and p21-deficient (K-rasLA1/+ Cdkn1a–/– [KC]) groups. (B) Examples of
invasive lung adenocarcinomas in KC mice. Arrowheads indicate invasive front at the edge of (left to right) a primary tumor, peribronchial invasion, and perivascular invasion. Scale bars: 200 μm (left), 100 μm (middle and right). (C) Examples of metastatic foci in KC mice. Images (left to right) of metastases to chest wall, diaphragm, subcutaneous space, kidney, and liver. H&E staining of adjacent tissue sections (lower panels). Scale bars: 100 μm. (D) A pleural implant subjected to immunofluorescence staining with antibodies against SPC (top), a marker of type II alveolar cells. Scale bars: 100 μm.
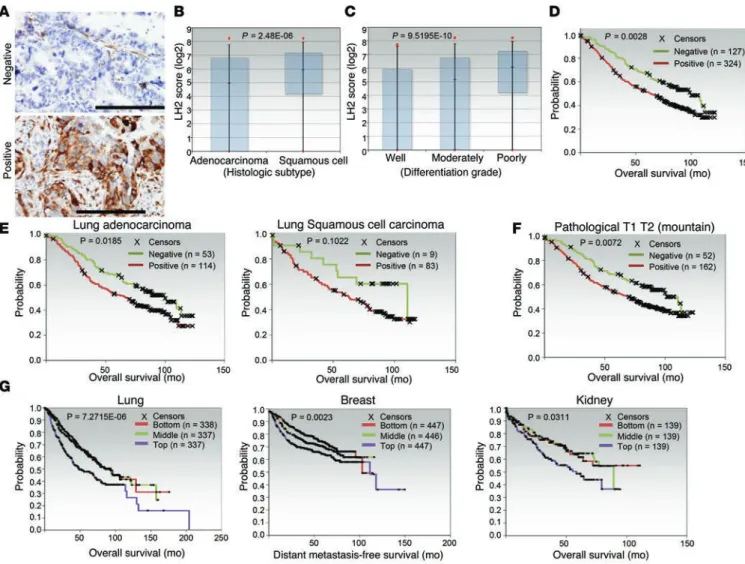
On the basis of these findings, we postulated that LH2 has a prometastatic role in human lung cancer and tested this hypothesis by quantifying intratumoral LH2 levels in a cohort of patients (n = 490) with stage I–IV lung adenocarcinoma or squamous cell carcinoma and correlating LH2 expression with survival duration. LH2 protein levels varied among tumors (Fig-ure 4A) and were higher in tumors with squamous cell histology (Figure 4B) or poor differentiation (Figure 4C) but did not cor-relate with KRAS mutational status. LH2 expression was associ-ated with shorter survival (Figure 4D) in all patients evaluable for clinical outcome (n = 451, Supplemental Table 4); in patients with adenocarcinoma, but not squamous, histology (Figure 4E); and in patients with small primary tumors (Figure 4F). The prog-nostic value of LH2 was confirmed in a compendium of 11 lung adenocarcinoma cohorts (n = 1,012 patients) (refs. 25–35 and Figure 4G). Similar associations between LH2 mRNA levels and full-length (LH2b) and spliced at exon 13 (LH2a) (ref. 24 and
Figure 3C). Using 3 distinct shRNAs to deplete LH2 in highly metastatic KC1 and KC2 cells (Figure 3D and Supplemental Fig-ure 10A), we showed that LH2 depletion significantly reduced KC1 and KC2 cell migration and invasion in Boyden chambers (Figure 3E and Supplemental Figure 10B). LH2 depletion had no detectable effect on KC2 cell proliferation in monolayer culture or colony formation in soft agar (Supplemental Figure 10, C and D). In syngeneic Cdkn1aWT mice, LH2-deficient KC2 tumors were
smaller and generated fewer lung metastases than KC2 tumors transfected with scrambled shRNA did (Figure 3F). To extend these findings to human lung cancer, we used shRNAs to deplete LH2 in A549, a K-ras-mutant lung adenocarcinoma cell line that has high levels of LH2 expression (Supplemental Figure 11, A and B), which decreased A549 cell migration and invasion in Boyden chambers (Supplemental Figure 11C).
Figure 2. Characterization of p21-deficient (KC) and -replete (K) murine lung adenocarcinoma cells. (A and B) Scatter plots of primary tumor weights (A)
and total numbers of lung metastases (B). Syngeneic Cdkn1a-null mice injected subcutaneously with K and KC cells. Dot, single mouse; bars and whiskers,
mean ± SD of replicate mice from a single experiment. (C) Cell morphologies in monolayer culture. (D) Images show migrating and invading cells in Boyden
chambers. Scale bars: 100 μm (C) 200 μm (D). Bar graphs show mean ± SD of triplicate samples in a single experiment. P values shown in figures, 2-tailed Student’s t test. One-way ANOVA, A (P < 0.0001), B (P < 0.0001), and D (P < 0.0001).
The Journal of Clinical Investigation
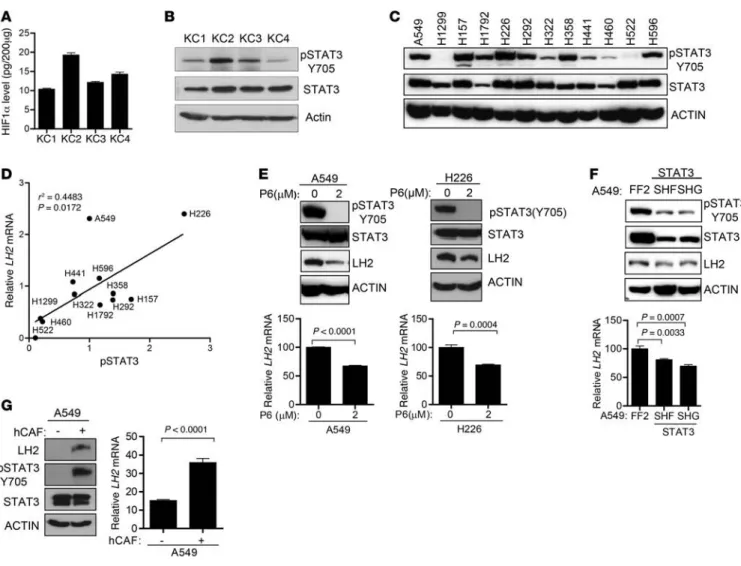
R e s e a R c h a R t i c l eencodes LH2 (PLOD2) contains several predicted STAT3-binding sites (http://jaspar.genereg.net). STAT3 Y705 phosphorylation was lower in poorly metastatic KC4 cells than in highly metastatic KC1–KC3 cells (Figure 5B) and correlated with LH2 mRNA levels in a panel of human lung cancer cell lines (Figure 5, C and D, and Sup-plemental Figure 11A). Inhibition of STAT3 activity by treatment with a Janus kinase inhibitor (pyridone 6 [P6]) or by transfection of STAT3 shRNAs decreased LH2 expression in A549 and H226 human lung cancer cell lines (Figure 5, E and F). Given that STAT3 survival duration were observed in patients with breast cancer
(36) or renal cancer (ref. 37 and Figure 4G).
LH2 expression is upregulated by STAT3 and by paracrine sig-nals from cancer-associated fibroblasts. LH2 is a hypoxia-inducible gene and contains a hypoxia-inducible factor–1–binding (HIF-1– binding) site in the gene promoter (38). However, HIF-1α levels in KC cell lines were not significantly different (Figure 5A), suggest-ing that HIF-1α levels alone were not sufficient to explain the dif-ferences in LH2 expression. The promoter region for the gene that
Figure 3. LH2 expression is upregulated in human and murine lung cancer and promotes the migration and invasion of KC cells. (A) The 67 genes
dif-ferentially expressed between highly and poorly metastatic KC cells (KC1–KC3 versus KC4) with the greatest fold change (up- or downregulation) were analyzed in 15 human lung cancer cohorts (https://www.oncomine.org). For each gene (dot), location on the y axis indicates fold difference between the two groups of murine cells; location on the x axis indicates the number of human data sets in which the gene is differentially expressed in cancer relative to normal lung (P < 0.01, >1.5-fold). (B) LH2 mRNA (bar graph) and protein (gels) levels measured using Q-PCR (triplicate samples) and
immu-noblotting, respectively. P < 0.0001 (1-way ANOVA). (C) LH2a and LH2b isoforms measured by RT-PCR. (D) Q-PCR analysis (bar graphs) and immunoblot
analysis (gels) of KC2 cells stably transfected with vectors expressing LH2 shRNA (SH1, SH3, and SH5) or scrambled control shRNA (SCR). Normalized Q-PCR results are expressed as mean ± SD values of triplicate samples. (E) Images show migrating and invading cells in Boyden chambers. Scale bars:
200 μm. Bar graphs show mean ± SD of triplicate wells expressed as the percent change relative to control transfectants (SCR), which were set at 100%. (F) Scatter plots of primary tumor weights (left) and total numbers of lung metastases (right). Dot, single mouse; bars and whiskers, mean ± SD. P values shown in figure, 2-tailed Student’s t test. L32 and actin were used as loading controls for Q-PCR and Western blot assays, respectively. Each
result is from a single experiment.
is a cytokine-activated transcription factor, we postulated that LH2 expression in tumor cells is upregulated by extracellular paracrine signals. Using a population of cancer-associated fibroblasts (CAFs) in lung cancers that secretes diverse cytokines, chemokines, and growth factors (39), we tested this hypothesis by coculturing A549 cells with CAFs in Boyden chambers, which revealed that CAFs increased LH2 expression in A549 cells (Figure 5G).
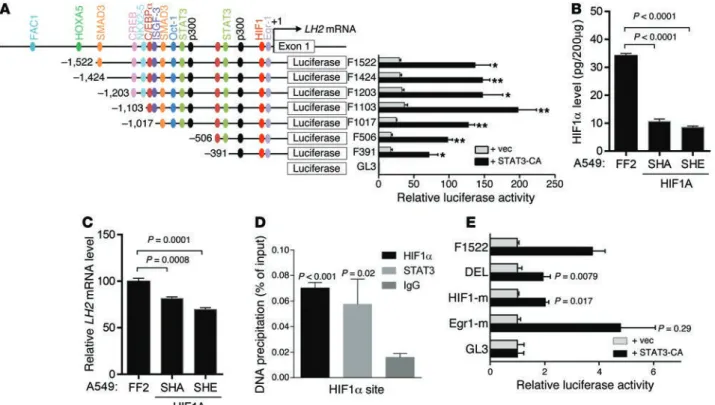
To determine whether STAT3 upregulates LH2 expression by binding directly to the LH2 gene promoter, we first performed cotransfection assays and found that STAT3 activated a LH2 gene promoter reporter (Figure 6A), but serial 5′ promoter deletions revealed that a minimal region required for STAT3 activation (–391 to +1) contained predicted binding sites for HIF-1 but not STAT3 (http://jaspar.genereg.net) (Figure 6A). Because STAT3 forms a
complex with HIF-1α and thereby cooperates with HIF-1α to regu-late the expression of HIF-1α target genes (40), we posturegu-lated that STAT3-induced LH2 expression is HIF-1α dependent. In support of this hypothesis, LH2 expression in A549 cells was diminished by shRNA-mediated depletion of HIF-1α (Figure 6, B and C). Fur-thermore, STAT3 and HIF-1α bound to a region of the endogenous LH2 promoter containing the HIF-1α–binding site (Figure 6D), and STAT3-induced LH2 promoter activation was mitigated by site-directed mutagenesis of the HIF-1α–binding site but not an adjacent Egr1-binding site (Figure 6E).
LH2 regulates tumor mechanical properties. Tumor cells secrete a variety of proteases and collagen cross-linking enzymes to remove obstructions in the ECM and align collagen fibers that pro-vide substrates for integrin-mediated cell attachment and tracks
Figure 4. LH2 expression has prognostic value in cancer patients. (A) Human lung cancers that are negative (upper panel) or positive (lower panel) for LH2
expression. LH2 expression (brown) in the stroma serves as a positive control for staining in the LH2-negative tumor. Scale bars: 200 μm. (B) Box plots rep-resenting the median and 25th and 75th percentiles of LH2 protein levels in lung adenocarcinoma and squamous cell carcinoma. P value, 2-tailed t test on log-transformed data. (C) Box plots representing the median and 5th and 95th percentiles of the LH2 protein levels in lung tumors of different grades. P value, 2-tailed t test on log-transformed data. (D) Kaplan-Meier survival analysis. Tumors classified as positive or negative for LH2 expression on the basis
of immunohistochemical staining (A). P value, log-rank (Mantel-Cox) test (LH2-positive versus -negative). (E and F) Kaplan-Meier survival analysis of human
lung cancers on the basis of different tumor histologies (E) and tumor grades (F). P values, log-rank (Mantel-Cox) test of differences between the
LH2-posi-tive and -negaLH2-posi-tive groups. (G) Kaplan-Meier plot (P values, log-rank test) of publically available data from patient cohorts with lung adenocarcinoma (lung),
breast adenocarcinoma (breast), or renal cell carcinoma (kidney). Analysis compares top third (highest expression), bottom third (lowest expression), and middle third (intermediate expression) of LH2 mRNA levels. Breast and lung tumor cohorts each represent a compendium of multiple datasets. Sample sizes in each cohort are indicated.
The Journal of Clinical Investigation
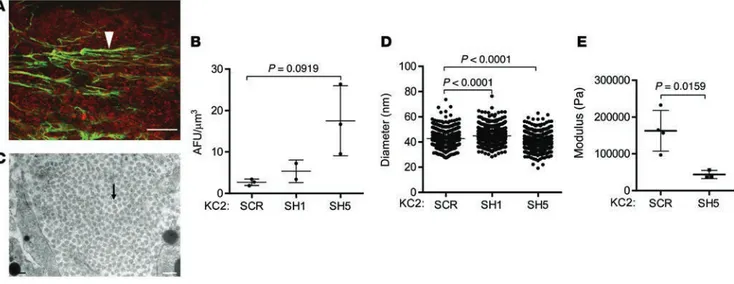
R e s e a R c h a R t i c l efor cell migration (41). Comparisons between poorly and highly metastatic KC cells revealed similar levels of matrix metallopro-teinase 2 (MMP2) enzymatic activity (Supplemental Figure 12), but highly metastatic cells had increased expression levels of Mmp9, Itga2, and Itgb3 and lower levels of Mmp3, Mmp10, Itga1, Itgb5, and Itgb7 (Supplemental Figures 13 and 14), raising the possibility that LH2 is part of a larger matrix remodeling process regulated by tumor cells. By second harmonic generation (SHG) analysis, intratumoral collagen was organized into defined tube-like structures with variable diameters, lengths, and branching (Figure 7A). However, quantification of collagen fiber alignment by SHG (Figure 7B) and collagen fibril diameters by transmission electron microscopy (Figures 7C and 7D) revealed no consis-tent differences between LH2-replete (SCR) and LH2-deficient (SH1 and SH5) tumors. Despite their macromolecular and
ultrastructural similarities to LH2-replete tumors, LH2-deficient tumors were markedly less stiff (Figure 7E), which implied that LH2-regulated collagen cross-links play a critical role in regu-lating tumor mechanical properties and indicated that further investigations into the collagen cross-links regulated by LH2 in the tumor stroma were warranted.
LH2 induces a switch in the type of collagen cross-link. While all 3 LH family members catalyze the hydroxylation of helical Lys res-idues on collagen, only LH2 catalyzes the hydroxylation of telo-peptidyl Lys residues and increases the formation of the HLCCs including dehydro-dihydroxylysinonorleucine/its ketomine (DHLNL), pyridinoline (Pyr), and deoxypyridinoline (d-Pyr) (4). In contrast, dehydro-histidinohydroxymerodesmosine (HHMD) is an LCC, and hydroxylysinonorleucine/its ketom-ine (HLNL) can be classified as HLCC or LCC depending on
Figure 5. LH2 expression is upregulated by STAT3 and paracrine signals from CAFs. (A) HIF-1α levels in cell lysates determined by ELISA. Data from a
sin-gle experiment expressed as mean ± SD of triplicate samples. (B and C) Immunoblot analysis of KC (B) and human (C) lung cancer cell lines. Actin was used
as loading control. (D) Correlation of LH2 mRNA levels in Supplemental Figure 11A with pSTAT3 (Y705) levels determined densitometrically from C. P and r2
values, linear regression analysis. (E) Immunoblotting (gels) and Q-PCR analysis (bar graphs) of data from a single experiment in which human lung cancer
cells were untreated (0) or treated with a Janus kinase inhibitor, P6, for 48 hours. Normalized Q-PCR values are expressed as mean of triplicate samples.
(F) Immunoblotting (gels) and Q-PCR analysis (bar graph) of a single experiment in which A549 cells were stably transfected with 1 of 2 STAT3 shRNAs
(SHF and SHG) or control shRNA (FF2). Q-PCR results (mean values of triplicate samples) are expressed relative to control transfectants, which were set at 100%. Actin was used as a loading control for immunoblot. (G) Immunoblotting (gels) and Q-PCR analysis (bar graphs) of A549 cells were monocultured
(–) or co-cultured with human cancer-associated fibroblasts (hCAF) (+) for 24 hours in Boyden chambers. Q-PCR results are expressed as mean values of triplicate samples. Actin was used as a loading control for immunoblot. P values, 2-tailed Student’s t test unless otherwise specified.
Next, we determined whether the HLCC-to-LCC ratio is cor-related with tumor metastatic properties. LCCs and HLCCs were quantified in tumors generated by injecting highly metastatic KC2 cells or poorly metastatic tumor cells (K1 or KC4) into syngeneic Cdkn1aWT mice. Prior to analysis, we confirmed that the cells had the
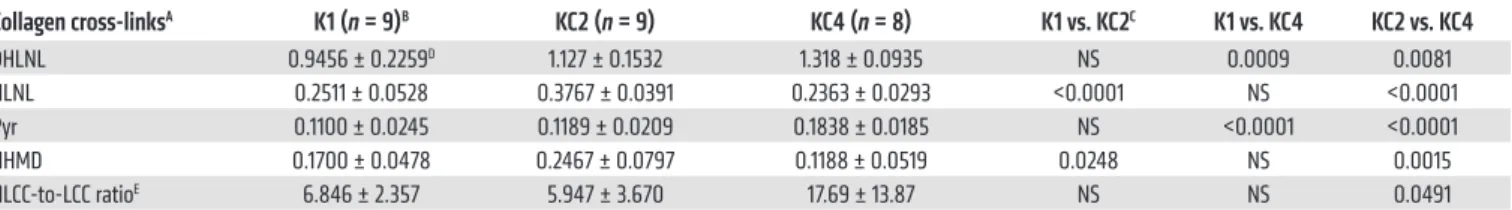
aforementioned relative LH2 expression levels and metastatic activ-ities (Supplemental Figure 15, A and B). Unexpectedly, KC4 tumors had the highest levels of the HLCCs DHLNL and Pyr (Table 1). The HLCC-to-LCC ratio was significantly different between KC4 and KC2 tumors (17.69 ± 13.87 versus 5.95 ± 3.67, P = 0.049) but not between p21-replete K1 tumors (6.85 ± 2.36) and p21-deficient tumors (KC2 or KC4), or between highly (KC2) and poorly (K1 or KC4) metastatic tumors (Table 1), indicating that HLCC-to-LCC ratios did not correlate with LH2 levels or metastatic potential in the cell line panel. To explore the basis for this surprising finding, we quantified the expression of LH family members (LH1–LH3), a galactosyltransferase that modifies hydroxylysines on collagen (GLT25D1), and LOX and LOX-like family members (LOXL1– LOXL4). We found that, relative to KC2 cells, KC4 cells had 10-fold higher levels of LOX (Supplemental Figure 16), which initiates cross-link formation in the extracellular space (4) and is therefore a potential contributor to the high HLCC levels in KC4 tumors.
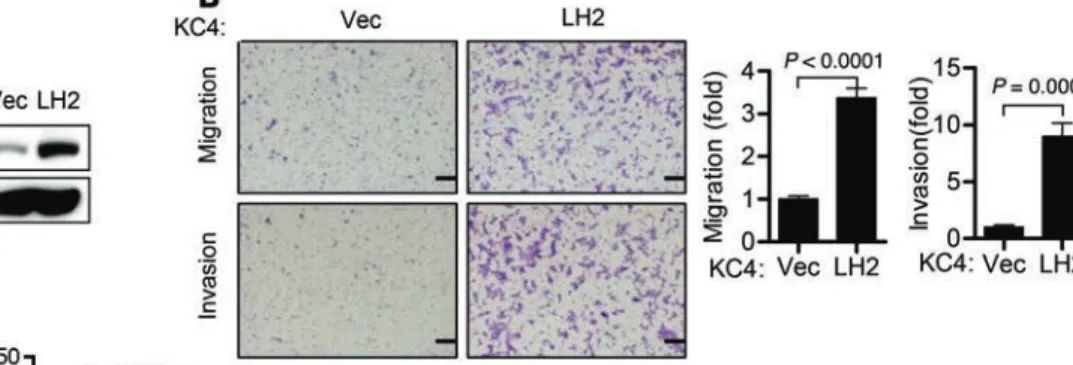
Despite having significantly lower HLCC levels than KC4 tumors (Table 1), KC2 tumors required LH2 to produce HLCCs (Figure 8E) and metastasize (Figure 3F). One interpretation of these findings is that KC2 and KC4 tumors differ in their respon-siveness to HLCCs, and that the high endogenous HLCC levels in KC4 tumors are insufficient to induce metastasis. To determine whether KC4 tumors have a higher threshold of response, we ectopically expressed LH2 in KC4 cells (Figure 9A) and found that ectopic LH2 expression increased cell migration and invasion in Boyden chambers (Figure 9B) and enhanced tumor growth and metastatic capacity in syngeneic Cdkn1aWT mice (Figure 9C).
Discussion
Our findings show that LH2 promotes tumor cell invasion and metastasis, is correlated with poor prognosis in lung cancer patients, and functions as a regulatory switch that increases the HLCC-to-LCC ratio in tumors. The finding that tumor stiffness can be regulated by a change in the type of collagen cross-link challenges the current paradigm, in which the total amount of collagen cross-links is paramount (41). This finding may also have implications for fibrosis associated with other diseases, including whether cross-links form between telopeptidyl Hylald and
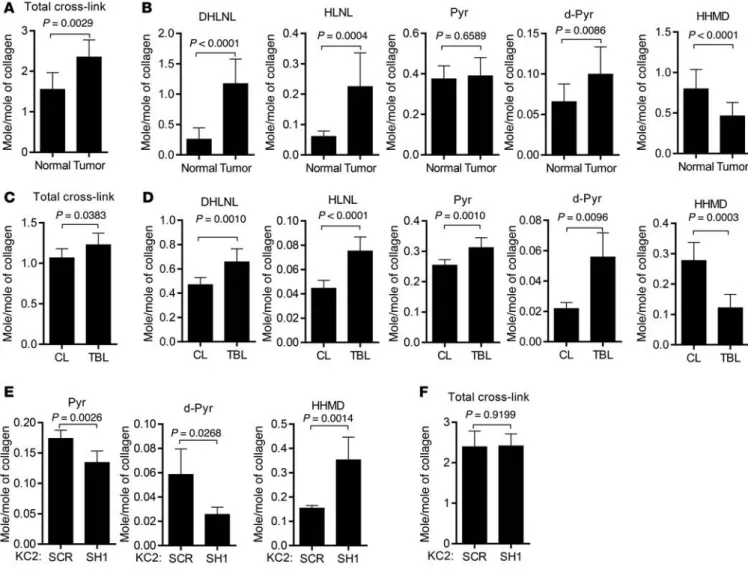
heli-cal Lys or telopeptidyl Lysald and helical Hyl, respectively (4). We quantified these collagen cross-links in human lung ade-nocarcinomas (n = 12) and a squamous cell carcinoma that were pathologic stage IA (n = 5), IB (n = 1), IIA (n = 3), and IIB (n = 3). Normal lung tissues from each patient’s resected lobe were included as a comparison. All of the tissues analyzed had detectable levels of DHLNL, Pyr, d-Pyr, HLNL, and HHMD (Fig-ure 8, A and B). Compared with normal lung tissues, lung tumors had increased total amounts of collagen cross-links (Figure 8A), higher levels of the HLCCs DHLNL and d-Pyr, and reduced lev-els of the LCC HHMD (Figure 8B). Expressed as a ratio of total HLCCs (DHLNL + Pyr + d-Pyr) to LCCs (HHMD), lung tumors had a significantly higher HLCC-to-LCC ratio than normal lung tissues did (4.28 ± 2.38 versus 0.93 ± 0.31, P = 0.0004).
To determine whether tumors switch to a high-HLCC, low-LCC state independently of p21 expression status, we quantified collagen cross-links in normal and tumor-bearing lung tissues from age-matched KC mice (n = 3), Cdkn1aWT K-rasLA1 mice (n = 2), Cdkn1aWT mice (n = 3), and Cdkn1a–null mice (n = 6), which were
combined into a tumor-bearing group (KC mice and Cdkn1aWT
K-rasLA1 mice) and a non-tumor-bearing group (Cdkn1aWT
and Cdkn1a-null). Compared with non-tumor-bearing lungs, tumor-bearing lungs had increased total amounts of collagen cross-links (Figure 8C), higher levels of HLCCs (DHLNL, Pyr, and d-Pyr), and lower levels of the LCC HHMD (Figure 8D). The HLCC-to-LCC ratio was higher in tumor than normal lung for all tissues analyzed (9.19 ± 3.43 versus 2.77 ± 0.56, P = 0.0134) and for tumor and normal lung tissues that were p21-deficient (7.30 ± 1.09 versus 2.76 ± 0.54) or -replete (12.02 ± 2.89 versus 2.80 ± 0.51). Thus, the murine lung tumors shifted toward a high-HLCC, low-LCC state independently of p21 expression status.
To determine whether the HLCC-to-LCC ratio is regulated by LH2, we quantified LCCs and HLCCs in tumors generated by injecting KC2 cells stably transfected with scrambled or LH2-specific shRNAs into syngeneic Cdkn1aWT mice. Relative
to scrambled shRNA-transfected KC2 tumors, LH2-depleted KC2 tumors had reduced levels of HLCCs (Pyr and d-Pyr) and increased levels of HHMD (Figure 8E), which significantly reduced the HLCC-to-LCC ratio (11.83 ± 1.93 versus 5.11 ± 1.26, P < 0.0001) but did not change the total amount of collagen cross-links (Figure 8F), indicating that LH2 induced a switch toward a high-HLCC, low-LCC state.
Table 1. Quantification of intratumoral collagen cross-links
Collagen cross-linksA K1 (n = 9)B KC2 (n = 9) KC4 (n = 8) K1 vs. KC2C K1 vs. KC4 KC2 vs. KC4 DHLNL 0.9456 ± 0.2259D 1.127 ± 0.1532 1.318 ± 0.0935 NS 0.0009 0.0081 HLNL 0.2511 ± 0.0528 0.3767 ± 0.0391 0.2363 ± 0.0293 <0.0001 NS <0.0001 Pyr 0.1100 ± 0.0245 0.1189 ± 0.0209 0.1838 ± 0.0185 NS <0.0001 <0.0001 HHMD 0.1700 ± 0.0478 0.2467 ± 0.0797 0.1188 ± 0.0519 0.0248 NS 0.0015 HLCC-to-LCC ratioE 6.846 ± 2.357 5.947 ± 3.670 17.69 ± 13.87 NS NS 0.0491
ADHLNL, HLNL, Pyr, and HHMD were quantified in tumors generated by the indicated cell lines in syngeneic mice. BNumber of replicates. CComparisons between tumors (Student’s t test). Dmol/mol of collagen (mean ± SD). EHLCC-to-LCC ratio was defined as the sum of HLCC mean values (DHLNL + Pyr) divided by LCC (HHMD) mean values; shown as mean ± SD. HLNL was excluded from the analysis because it can be classified as LCC or HLCC depending on its derivation.
The Journal of Clinical Investigation
R e s e a R c h a R t i c l eof cyclin-dependent kinases CDK1 and CDK2, which blocks the transition from G1 phase to S phase or from G2 phase to mitosis after DNA damage, enabling the repair of damaged DNA (18).
p21 is a negative regulator of lung fibrosis induced by TGF-β1 (17), which promotes lung inflammation and fibrosis in patients with various diseases, including chronic obstructive pulmonary disease, idiopathic pulmonary fibrosis, and lung cancer (47). Our results show that p21 silencing in lung tumor cells influences collagen cross-linking in the tumor stroma through the upregula-tion of LH2 expression. We observed that LH2 can directly modify tumor progression. These results are consistent with evidence that LH2 expression is elevated in other tumor types and is a determi-nant of tumor cell behavior. For example, in sarcomas and breast cancers, LH2 expression is HIF-1α inducible; promotes tumor cell invasion and metastasis; and influences collagen deposition, organization, and stiffness (38, 48–50), but the actual types of col-lagen cross-links were not analyzed in these studies. Our findings provide a biochemical link between high LH2 expression and its induced changes in collagen biophysical properties by showing that LH2 controls the relative abundance of HLCCs and LCCs in the tumor stroma. This finding is consistent with evidence in osteoblasts that LH2 induces a switch in the predominant type idiopathic pulmonary fibrosis (42), and aging, where tissues
become stiffer and contain high levels of collagen cross-links (43). Our data show how modulating the expression of a single gene that is silenced in advanced human lung cancer, p21, can promote metastasis of K-ras-mutant lung adenocarcinoma. p21 is a target gene of a potent tumor suppressor, p53, that is somatically mutated and inactivated in lung cancer (44). Although Tp53 inactivation promotes metastasis of K-ras-mutant lung adenocarcinomas in mice (45), the incidence of metastases induced by p53 deficiency is much lower than that observed in KC mice, implying that inacti-vation of p53-dependent signal transduction is not the only driver of metastasis development in KC mice. In further support of this conclusion, we showed that the metastatic properties of KC cells are variable, are not reversed by reconstituting p21 expression, and are associated with a high degree of transcriptomic dysregulation. Aneuploidy was present in the lung adenocarcinoma cells estab-lished from K-rasLA1 mice, which is consistent with evidence that mutant K-ras expression leads to aneuploidy (46). There was no difference in aneuploidy between p21-deficient and -replete tumor cells, arguing that p21 deficiency is not the primary driver of aneu-ploidy in these cells. However, p21 plays an important role in main-taining genomic integrity by binding to and inhibiting the activity
Figure 6. STAT3-induced LH2 expression is HIF-1 dependent. (A) LH2 gene promoter fragments created by PCR contain the predicted transcription factor
binding sites (color-coded) (JASPAR: http://jaspar.genereg.net/ and BIOBASE: http://www.biobase-international.com/). A549 cells transiently cotrans-fected with an empty (vec) or constitutively active (CA) mutant STAT3 expression vector, a Renilla luciferase reporter (for normalization), and a firefly luciferase reporter driven by LH2 promoter constructs. Firefly luciferase activities from a single experiment (bar graphs aligned with promoter constructs) expressed as mean ± SD of triplicate wells relative to the activity of the basal reporter (pGL3), which was set at 1.0. (B) HIF-1α levels determined by ELISA
on A549 cell lysates stably transfected with HIF-1α or control (FF2) shRNA. Data from a single experiment are expressed as mean ± SD of triplicate sam-ples. (C) Q-PCR analysis of LH2 expression in A549 cells stably transfected with HIF-1α shRNA (SHA or SHE) or control shRNA (FF2). Normalized Q-PCR
results from a single experiment are expressed as mean ± SD of triplicate samples. (D) ChIP assay performed on A549 cell lysates using anti–HIF-1α and
-STAT3 antibodies. Precipitated DNA amounts (percent of input) expressed as mean ± SD of triplicate samples from a single experiment. IgG was used as a negative control. (E) Luciferase assays performed in a single experiment on A549 cells as described in A. LH2 promoter reporter constructs contain
site-directed mutations in HIF-1α (HIF-1-m) or Egr1 (Egr1-m) binding sites or deletion of both sites (DEL). P values, 2-tailed Student’s t test.
Although most cell types produce collagen, CAFs are con-sidered the primary source of collagen in epithelial tumors (53). Tumor cells that produce minimal collagen can still play a critical role in the regulation of stromal maturation by secreting LOX and LOX-like family members that initiate cross-linking of collagen deposited by CAFs or any other cell type in the tumor stroma, thereby increasing the deposition of cross-linked (fibrillar) collagen in epithelial tumors (54). In contrast, LH2 is an intra-cellular, endoplasmic reticulum–resident enzyme that modifies procollagen α chains before triple helix formation and secretion into extracellular space, implying that tumor cells that express LH2 are a source of collagen that can regulate stromal biophysi-cal properties. Given that these two enzyme classes are potentially complementary, coexpression of LH2 and LOX family members may identify tumor cells with a particularly high potential to regu-late collagen cross-linking and metastasize. Indeed, coexpression of LH2 and LOX can occur because both genes are HIF-1 targets and are upregulated by extracellular signals that control the inva-sive and metastatic potential of tumor cells (54). In the context of our findings, not only does hypoxia upregulate LH2, but STAT3 and paracrine signals from CAFs may also do so, demonstrating that LH2 is positioned downstream of multiple extracellular sig-nals that control collagen cross-linking and promote metastasis.
Cancer progression is accompanied by dynamic ECM remodeling involving collagen deposition, modifications, and removal (41). These processes are regulated by numerous cell types in the tumor microenvironment that secrete collagen, pro-teases, and cross-linking-associated enzymes such as LOX and LH family members (55–57). Coordinating these processes in the ECM are factors such as TGF-β, which increases the secre-tion of peptides that evoke inflammasecre-tion, drive fibrosis, and pro-mote metastasis; conversely, forces generated by the ECM can modulate TGF-β–induced intracellular signaling (58, 59). TGF-β of collagen cross-link that qualitatively affects fibrillogenesis and
matrix organization (7, 8). Furthermore, we showed that, even in the absence of other cellular and soluble factors, LH2 modified the migratory and invasive behavior of lung adenocarcinoma cells, suggesting that the physical parameters of the tumor microenvi-ronment regulated by LH2 may modify the biological properties of tumor cells. This observation is the first direct biochemical evidence, to our knowledge, that a change in the abundance of HLCCs in the tumor stroma accompanies tumor progression.
By performing LH2 loss-of-function studies, we showed that LH2 increased HLCC production and enhanced tumor cell met-astatic activity. In contrast, comparisons between cell lines did not show positive correlations among LH2 expression, HLCC production, and metastatic activity. Although the basis for this discrepancy is unclear, we showed that LOX, which initiates cross-link formation (4), is highly expressed in KC4 cells and could lead to high HLCC production. Alternatively, cell lines could differentially express factors that regulate LH2 activity through mechanisms that are currently undefined, such as LH2 post-translational modifications or altered trafficking. Indeed, LH2 was recently found to be an N-glycosylated protein in col-orectal cancer tissues (51). The poor correlation could also reflect LH2 substrates other than collagen that promote metastasis and are differentially expressed in cells. Although collagen is the only known substrate for LH2, additional LH2 substrates are possible, given that LH family members bind collagen family members with distinct specificities (52), and studies on other collagen-modifying enzymes such as LOX and LOXL family members have shown that they are not entirely dedicated to collagen and elastin and bind to histones and potentially other intracellular substrates (5). Thus, a regulator of collagen function such as LH2 might have other substrates involved in distinct biological func-tions that promote metastasis.
Figure 7. Analysis of intratumoral collagen properties regulated by LH2. (A) Collagen structures (green, arrowhead) and tumor cells (red) in a
subcutane-ous KC2 tumor analyzed by second harmonic generation (SHG) detected at 430 nm following excitation at 860 nm by femtosecond laser illumination under a scanning multiphoton microscope. Scale bar: 100 μm. (B) SHG signal quantification from a single experiment. Dot, single tumor; bars and whiskers, mean ± SD. (C) Transmission electron microscopy of collagen fibrils (arrow) in a subcutaneous KC2 tumor. Scale bar: 200 nm. (D) Quantification of collagen fibril
cross-sectional diameters (800 fibrils per tumor, 1 tumor per transfectant). Dot, single fibril; bars and whiskers, mean ± SD. (E) Quantification of tumor
The Journal of Clinical Investigation
R e s e a R c h a R t i c l ehere raise the possibility that Janus kinase inhibitors, which are under investigation for the treatment of multiple cancer types, may be used to downregulate LH2 expression in tumors.
Methods
Mouse experiments. K-rasLA1/+ mice were inter-bred with Cdkn1a+/+ and
Cdkn1a–/– mice to generate K-rasLA1/+ Cdkn1a+/+ and K-rasLA1/+ Cdkn1a–/–
mice, respectively. K-rasLA1 and Cdkn1a–/– alleles were both on 129/Sv
genomic backgrounds. Mice were monitored daily for signs of illness or obvious tumor burden, and moribund mice were killed. Lung tis-sues and metastatic tumor tistis-sues were fixed with 3.7% buffered for-malin, embedded in paraffin, and sectioned. Single sections for each lung were stained with H&E for histological evaluation.
Isolation of human CAFs. Using techniques described
previ-ously (39), human CAFs were isolated from resected lung tumor tissues by flow cytometric analysis to first remove hematopoietic cells activity can, in turn, be regulated by LOX (55). These findings
highlight the dynamic and reciprocal interactions between force and ECM deposition, maturation, and removal. Clinical strate-gies to target these processes will need to take into account the growing evidence that cancer is a rapidly changing, phenotypi-cally plastic, and coordinated tissue remodeling process that is tightly regulated by biochemical and physical cues. Tools in the development of such therapeutic strategies include inhibitors of LOX and LOX-like family members that have demonstrated antimetastatic activity in preclinical models (5). Although direct inhibitors of LH2 enzymatic activity have not been reported, LH2’s catalytic activity is dependent on the same co-factors (iron, oxygen, ascorbate, and α-ketoglutarate) used by other LHs, including the Jumonji histone demethylases, antagonists of which have been developed (60) and might be modified to selectively inhibit LH2. Furthermore, the findings presented
Figure 8. A LH2-regulated switch in the type of collagen cross-link in tumors. (A and B) Quantification of collagen cross-links (mol/mol of collagen) in human
lung adenocarcinomas (tumor) and adjacent normal lung (normal) resected from patients (n = 12). Total cross-links in A represent the sum of cross-links in B. Results are expressed as mean ± SD. (C and D) Quantification of collagen cross-links (mol/mol of collagen) in tumor-bearing lung tissues (n = 5, TBL) from Cdkn1aWT K-rasLA1 mice (n = 2) and KC mice (n = 3) and age-matched non-tumor-bearing lung tissues (n = 9, CL) from mice that are Cdkn1aWT (n = 3) or -null
(n = 6). Total cross-links in C represent the sum of cross-links in D. Results are expressed as mean ± SD. (E and F) Quantification of collagen cross-links (mol/
mol of collagen) in tumors generated by injecting KC2 cells stably transfected with LH2 shRNA (SH1, n = 7) or control shRNA (SCR, n = 5) in Cdkn1aWT mice. Total
cross-links in F represent the sum of cross-links in E. Mean ± SD. P values, 2-tailed Student’s t test.
anti–human EpCAM (#347197) from BD Biosciences. STAT3 inhib-itor P6 (Calbiochem), mitomycin C, MTT (Sigma-Aldrich), 7-AAD (Sigma-Aldrich), and WST-1 (Clontech) were purchased.
Plasmids. Murine p21, Aqp1, Timp3, and LH2 were amplified from
the cDNAs of LKR-13 cells (a lung adenocarcinoma cell line derived from K-rasLA1 mice), KC4, or KC2 cells and cloned into pLVX-Puro vec-tor (Clontech). shRNAs against human LH2 (SHC [V2LHS_131378], SHD [V3LHS_306074]), STAT3 (SHF [V3LHS_641819], SHG [V3LHS_645974]), and HIF-1α (SHA [V2LHS_132150], SHE [V3LHS_374853]) in pGIPZ system were obtained from the shRNA and ORFeome Core at the MD Anderson Cancer Center. pGIPZ-FF2 control, which targets the firefly luciferase gene, was a gift from Kenneth Scott at Baylor College of Medicine. Scrambled shRNA (Addgene plasmid #1864) was a gift from David Sabatini, Whitehead Institute, Cambridge, Massachusetts, USA (61). Murine LH2 shRNAs were constructed by inserting the hairpin sequences into the pLKO.1-TRC cloning plasmid (Addgene plasmid #10878), which was a gift from David Root, Broad Institute, Cambridge, Massachusetts, USA (62). Target sequences for murine LH2 were SH1 (5′-CTGTGAAGGTTCTTGGTCA-3′), SH3 (5′-CCGCAATGCTAGAGATATG-3′), and SH5 (5′-CGTGAACAT-GTCTCTGAAG-3′). pMD2.G (Addgene plasmid #12259) and psPAX2 (Addgene plasmid #12260), which were gifts from Didier Trono, Ecole Polytechnique Fédérale de Lausanne, Lausanne, Switzerland, were used for lentiviral packaging as described below. Stat3-C Flag pRc/CMV was a gift from James Darnell, Rockefeller University, New York, New York, USA (Addgene plasmid #8722). The Stat3-C Flag cod-ing sequences were subcloned into the pIREShyg3 vector (Clontech) to generate the STAT3-CA expression vector
Stable transfectant generation. Cells were infected with lentiviruses
carrying shRNA or cDNA that had been packaged in 293T cells using pMD2.G and psPAX2 plasmids. After 48 hours, conditioned media were collected from the 293T cells and used for lentiviral infection of target cells. Stable transfectants were generated by selection with puromycin (10 μg/ml) for 2 weeks.
(anti-CD45), endothelial cells (anti-CD31), and epithelial cells (anti– epithelial cell adhesion molecule [anti-EpCAM]) and then positively select fibroblasts using an antibody against cell-surface glycoprotein Thy1 (CD90). 7-Aminoactinomycin D (7-AAD; 2 μg/ml) was used as a viability dye for flow cytometric detection and exclusion of nonviable cells. Cells (5 × 10⁷ cells/ml) were resuspended in PBS and 2% FBS in an optimally pre-titered cocktail of antibodies and incubated for 45 minutes on ice. The labeled cells were washed in excess PBS–2% FBS and resuspended at 5 × 10⁶ to 10 × 106 cells/ml and held on ice for flow cytometric analysis and sorting using a FACSAria cell sorter (BD Biosciences). Fibroblasts were cultured in modified essential medium (MEM) (Cellgro) supplemented with 20% FBS, penicillin/ streptomycin, l-glutamine, and sodium pyruvate.
Cell culture. The human lung cancer cell lines were obtained from
ATCC. Cells were grown in a humidified atmosphere with 5% CO2 at 37°C in Dulbecco’s modified Eagle’s medium/Ham’s F-12 medium (1:1) supplemented with 10% FBS. Murine lung adenocarcinoma cell lines (K1, K2, and KC1–KC4) were derived from 6 different primary lung tumors obtained at necropsy using the Cancer Cell Isolation Kit (Affyme-trix) and cultured in RPMI 1640 medium supplemented with 10% FBS.
Antibodies and reagents. We purchased anti-STAT3 (#9132) and
anti–phospho-STAT3 (Y705) (#9131) from Cell Signaling Technol-ogy; anti-SPC (ABC99) from Millipore; anti-LH2 (21214-1-AP) from Proteintech; anti-LH2 (MAB4445) from R&D Systems; anti-actin (A2066) from Sigma-Aldrich; anti-p21 (sc-6246) from Santa Cruz Biotechnology Inc.; donkey anti-rabbit Alexa 594 (R37119) and FITC-conjugated secondary antibody (F2765) from Life Technol-ogies. For isolation of human CAFs, we purchased APC–mouse anti–human CD90 (#17-0909-41), PE–mouse anti–human CD31 (#12-0319-41), APC–Mouse IgG1 K Isotype Control (#17-4714), FITC–Mouse IgG1 K Isotype Control (#11-4714-41), and PE–Mouse IgG1 K Isotype Control (#12-4714-41) from eBioscience; APC/Cy7– mouse anti–human CD45 (#304014) and APC/Cy7–Mouse IgG1 K Isotype Control (#400127) from BioLegend; and FITC–mouse
Figure 9. Ectopic LH2 increases KC4 tumor size and metastasis. (A) Q-PCR analysis (bar graph)
and immunoblot analysis (gels) of KC4 cells stably transfected with murine LH2 cDNA expression vector or empty vector control. Mean ± SD of triplicate samples. Actin was used as a loading control. P values, 2-tailed Student’s t test. (B) Images show migrating and invading KC4 cells
stably transfected with murine LH2 cDNA expression vector or empty vector control in Boyden chambers. Scale bars: 200 μm. Mean ± SD of triplicate wells from a single experiment are expressed as the fold change relative to control transfectants, which were set at 1.0. P values, 2-tailed Student’s t test. (C) Scatter plots of primary tumor weights (left) and total numbers of
lung metastases (right) from a single experiment in which mice were injected subcutaneously with KC4 cells stably transfected with LH2 expression vector or empty vector control. Dot, single mouse; bars and whiskers, mean ± SD. P values, Mann-Whitney U test.
The Journal of Clinical Investigation
R e s e a R c h a R t i c l e phosphate-buffered saline and cold distilled water, and then lyophilized and weighed. Aliquots were reduced with standardized NaB3H4 and hydrolyzed with 6N HCl. The hydrolysates were then subjected to amino acid and cross-link analyses (66). The reducible cross-links, HLNL, DHLNL, and HHMD, were identified and measured as their reduced forms. The mature trivalent cross-links (Pyr and d-Pyr) were simultaneously identified and quantified by their fluorescence. All cross-links were quantified as mol/mol of collagen based on the value of 300 residues of hydroxyproline per collagen molecule.
Chromosome spread and karyotype analysis. KC1–KC4 cells at
pas-sage 40 were grown to 60% confluence before addition of colcemid for 3 hours for the accumulation of mitotic cells. The cells were then fixed in 3:1 methanol–acetic acid solution for karyotyping. Cells were prepared by cytospin onto slides and stained with Giemsa, and at least 75–100 metaphases were counted for karyotype analysis.
Spectral karyotyping analysis. Spectral karyotyping (SKY) analysis
was performed as previously described (67). The cocktail of mouse chromosome paints was obtained from Applied Spectral Imaging (ASI). Hybridization and detection were carried out according to the manufacturer’s protocol. Chromosomes were counterstained with DAPI. Images were acquired with an SD300H Spectra cube (ASI) mounted on a Zeiss Axioplan II microscope using a custom designed optical filter (SKY-1) (Chroma Technology) and analyzed using SKY View 2.1.1 software (ASI). At least 10 cells per sample were analyzed.
Syngeneic tumor model. Wild-type littermates of KC mice (129/Sv)
from our colony (males and females) at least 8 weeks old were used for the syngeneic tumor experiments. Subcutaneous injections of 1 × 10⁶ cells in single-cell suspension were placed in the posterior flank in a volume of 100 μl phosphate-buffered saline. Animals were monitored regularly and euthanized when they exhibited signs of morbidity or when the size of the subcutaneous tumor reached 1.5 cm in diameter, which occurred typically at 4 weeks’ time.
Migration and invasion assays. Cells (1 × 10⁵) were cultured in the upper wells (in triplicate) of Transwell and Matrigel chambers (BD Biosciences) and allowed to invade and migrate, respectively, toward 10% FBS in the bottom wells. After 18 hours of incubation, migrating or invading cells were stained with Diff-Quik Stain Set (Siemens), pho-tographed, and counted manually using Adobe Photoshop software.
Proliferation assay. Cells (1 × 10³) were seeded in 96-well plates (1 × 10³ cells/well) and incubated for defined time points; cell numbers were then measured using the WST-1 assay.
Colony formation assay. Cells in monolayer culture were
har-vested by brief digestion with 0.05% Trypsin-EDTA (Invitrogen), resuspended in medium containing 10% FBS, and aspirated through a 25G needle to generate single-cell suspensions. These cells (1 × 10⁴) were mixed with 0.3% agar and plated in triplicate on 0.6% agar in medium supplemented with 20% FBS in 12-well plates. Cultures were maintained for 21 days to allow the formation of cell colonies, which were then visualized by MTT staining, manually counted under light microscopy, and expressed as the mean ± SD of the number of colo-nies from replicate wells.
Luciferase reporter assays. Murine LH2 promoter (F1522, –1,522 to
+109 bp from the transcription start site) was isolated by PCR ampli-fication from genomic DNA of TC-1 mouse embryonic stem cells and ligated into the pGL3-Basic Vector (Promega) at the MluI site. Promoter constructs deleted in the 5′ regions (F1424, F1203, F1103, F506, and F391) and the HIF-1–binding site (DEL, +104 to +83 bp) and
Affymetrix gene expression profiling. Total RNA was extracted
from KC1–KC4 cells using TRIzol and then hybridized to Affymetrix GeneChip Mouse Genome 430 2.0 array (Asuragen). Data processing and determination of differentially expressed genes were carried out essentially as described previously (63). Transcriptomic data sets were deposited in GEO (GSE49315).
Reverse transcription polymerase chain reaction (RT-PCR) and quanti-tative real-time RT-PCR (Q-PCR). Total RNA was isolated from the cells
using TRIzol (Invitrogen) according to the manufacturer’s protocol. RT-PCR was performed to determine the presence or absence of LH2a and LH2b mRNA isoforms using reported methods (64). Q-PCR assays were performed to analyze mRNA levels using a SYBR Green–based system (Applied Biosystems) after reverse transcription with qScript cDNA SuperMix (Quanta). mRNA levels were normalized on the basis of mRNA for ribosomal protein L32 (Rpl32). The primers for RT-PCR and Q-PCR are listed in Supplemental Tables 5 and 6, respectively.
Western blotting. Cells were washed with phosphate-buffered
saline and then lysed to extract total proteins with cell lysis buffer (Cell Signaling Technology). Cell lysates were separated by SDS-PAGE, transferred onto a nitrocellulose transfer membrane (Whatman Schleicher&Schuell), and then incubated with primary antibodies and horseradish peroxidase–conjugated secondary antibodies (GE Healthcare). Protein bands were visualized with Pierce ECL Western Blotting substrate (Thermo Scientific).
HIF-1α ELISA. HIF-1α protein levels were analyzed in cell lysates
using the Human/Mouse Total HIF-1α immunoassay kit (R&D Systems).
LH2 immunohistochemical analysis. Histological sections of
for-malin-fixed, paraffin-embedded human lung cancer tissues in a tissue microarray were stained with a mouse monoclonal anti–human lysyl hydroxylase 2 antibody (R&D Systems, MAB4445). All immunoreac-tions were performed using a Leica BOND-MAX automated immunos-tainer machine (Leica Biosystems). Formalin-fixed, paraffin-embedded pellets of A549 and H522 cell lines, known to be respectively positive and negative for LH2 expression by Western blot analysis, were used for staining optimization and as controls for the tissue microarray staining. The microarray sections were deparaffinized, hydrated, and stained in the immunostainer system. In particular, epitope retrieval was per-formed with ER Solution 2 (EDTA buffer, H2; Leica Microsystems), endogenous peroxidase blocking was done for 15 minutes at room tem-perature, and protein blocking was performed with Novocastra Blocking Solution (Leica Biosystems) for 20 minutes. The primary antibody was then incubated for 60 minutes at room temperature, using a previously optimized dilution of 1:1,000. The detection system used was the Leica Polymer Refine Detection Kit (Leica Biosystems). Finally, the sections were rinsed, counterstained with hematoxylin, and mounted on glass slides prior to evaluation under the microscope. Two lung cancer pathol-ogists evaluated the positive and negative controls for quality control of the IHC and then examined the slides using light microscopy. For survival analyses, tumors were scored as positive or negative based on cytoplasmic expression of LH2 in the tumor cells or as a continuous vari-able using a four-value intensity score (0, none; 1, weak; 2, moderate; and 3, strong) and percentage (0%–100%) of the extent of reactivity in the tumor cells, which were combined to obtain a final expression score by multiplying the intensity and reactivity values (range, 0–300) as described previously (65).
Collagen cross-link analysis. Tissues were pulverized in liquid
nitrogen using a Spex Freezer Mill (Spex Inc.), washed with cold
mounted on single slot copper grids and imaged on a Tecnai G2 Spirit BioTWIN transmission electron microscope (FEI Company). Cross-sectional diameters were measured in 800 collagen fibrils per tumor.
Coculture of K1 cell spheroids with KC2 cells in 3D collagen matrix.
Cells were detached with EDTA (1 mM) and trypsin (0.075%; Invit-rogen), and multicellular spheroids were generated using the hang-ing-drop method (68). Cells were resuspended in medium supple-mented with methylcellulose (20%; Sigma-Aldrich) and Matrigel (1%, Discovery Labware Inc.) and incubated as droplets (25 μl) con-taining 2,000 cells for 24–48 hours to ensure multicellular aggrega-tion. K1 cell spheroids were washed with medium and mixed with a solution of KC2 cells in rat tail collagen (SERVA Electrophoresis) (2.0 mg/ml), which was pipetted as a drop-matrix, polymerized at 37°C, and replaced with medium. Spheroids were examined for inva-sive features 24 hours after seeding.
Statistics. For global mRNA expression studies, we performed
2-sided t tests using log-transformed data to determine signifi-cant differences in mean mRNA levels between highly (KC1, KC2, and KC3) and poorly (KC4) metastatic cells. Two-tailed t test on log-transformed LH2 scores in tissue microarray was used to test the difference in LH2 protein levels in lung tumors of different his-tologies and grades. The Kaplan-Meier method was used to con-struct overall and distant metastasis-free survival curves, and the log-rank test was used to test the difference by covariate levels. One-way ANOVA was used for multiple comparisons. Unless otherwise indicated, comparisons between the means of different experimen-tal groups were performed using a Student’s t test. Mann-Whitney U test was performed to examine the effect of LH2 overexpression on the tumorigenicity and metastatic activity of KC4 cells. P values less than 0.05 were considered significant.
Study approval. All animal experiments were reviewed and
approved by the Institutional Animal Care and Use Committee of the University of Texas MD Anderson Cancer Center. The use of inciden-tal lung tissues for isolation of CAFs and quantification of collagen cross-links in this study was performed under Institutional Review Board–approved protocol IRB(2)0910-01565x at Houston Methodist Research Institute, and written informed consent was obtained from participants or their guardians.
Acknowledgments
This work was supported by NIH grants R01 CA109478 (to D. Pankova), CA125123 (to C.J. Creighton), R01 CA125269 (to E.D. Martinez), R01 CA157450 (to J.M. Kurie), R21AR060978 (to M. Yamauchi), 1R21 CA184817-01 (to Y. Yang), P30 EY007551 (to A.R. Burns); and by Cancer Prevention Research Institute of Texas Multi-Investigator Research Award RP120713 (to C.J. Creighton), UT Lung Specialized Programs of Research Excel-lence grant P50 CA70907 (to J.M. Kurie and I.I. Wistuba), Department of Defense PROSPECT grant W81XWH-07-1-0306 (to I.I. Wistuba), and MD Anderson Cancer Center Support Grant CA016672. J.M. Kurie is the Elza and Ina A. Shackelford-Free-man Endowed Professor in Lung Cancer Research. Gifts used in this work include the constitutively active mutant STAT3 plas-mid from James E. Darnell Jr., the pLKO.1-TRC cloning plasplas-mid from David Root, the pMD2.G and psPAX2 plasmids from Didier Trono, and the scrambled shRNA plasmid from David Sabatini. We thank Yiqun Zhang for technical assistance.
mutated in HIF-1α (HIF-1-m) and Egr1 (Egr1-m) sites were generated by using a PCR-based method. The primers used for the promoter cloning and construction are listed in Supplemental Table 7. A549 cells were seeded on 24-well plates (1 × 10⁵ cells/well) 1 day before trans-fection. Cells were cotransfected with promoter reporters (500 ng) and constitutively active STAT3 (STAT3-CA, 500 ng). A pRL-TK vec-tor (50 ng, Promega) was cotransfected as an internal control. After 48 hours of transfection, luciferase activity was measured with the Dual-Luciferase Reporter Assay System (Promega) according to the manufacturer’s protocol.
Immunofluorescence staining. Tumor cells were cultured on glass
coverslips, fixed with formaldehyde, permeabilized, and incubated with antibody to SPC followed by FITC-conjugated secondary anti-body. Cells were analyzed using a fluorescence microscope, and digi-tal images of FITC staining were captured.
ChIP assays. A549 cells were cross-linked with 1% formaldehyde
and then incubated in lysis buffer (50 mM Tris-HCl [pH 8.1], 1% SDS, 10 mM EDTA, and protease inhibitor cocktail) on ice for 10 min-utes. After sonication (Cole-Parmer GEX-130 sonicator; 50% power, pulse-on for 10 seconds, pulse-off for 10 seconds, 20 cycles), samples were immunoprecipitated with anti-STAT3 (Cell Signaling Technol-ogy), anti–HIF-1α antibody (Novus Biologicals), or anti-mouse IgG (Santa Cruz Biotechnology Inc.). DNA was eluted and purified with a PCR purification kit (QIAGEN), and Q-PCR was carried out with specific primers to amplify the HIF-1–binding site of the LH2 pro-moter (–209 ~ +25 bp, forward: 5′-TAACGCAGCTGAGTGAGGTC-3′, reverse: 5′-CGCAGGCAGCTCCTTAAATA-3′) or a nonspecific region within intron 17 of LH2 mRNA as a negative control (forward: 5′-GCAGTCTCAGCTGCTTGATG-3′, reverse: 5′-TTACTGCCTCTG-CACGGTTA-3′). The percentage of DNA bound was calculated using the following formula: DNA precipitation (% of input) = 2ΔCt/10 × 100 (%), where ΔCt = Ct(input) − Ct(sample), and Ct is cycle threshold. One-tenth of lysate used for immunoprecipitation was used as input.
SHG using two-photon microscopy. SHG signal from collagen were
detected upon excitation with a 920 nm laser and collected using a BP 460/50 filter. The images were acquired using the SP5 RS Leica multi-photon microscope with a 25× NA 1.10 W Nikon objective lens.
Stiffness measurement. Tumors were mechanically
character-ized by unconfined compression testing using a Bose ElectroForce ELF 3200 mechanical testing machine and 22.5 N load cell (Bose ElectroForce). Sections of tumor were cut out using a 5-mm biopsy punch trimmed to 2 mm thick with a scalpel. The sections were placed between flat platens and compressed to 40% strain at 0.01 mm/s. Force and displacement data were recorded at 100 points per second and translated to stress and stain by dividing force by cross-sectional area and displacement by initial thickness, respectively. The compres-sive modulus was determined by simple linear regression of the stress-versus-strain curve from 5% to 15% strain, with the slope of the line calculated by least-squares fitting.
Electron microscopy. Tumors were fixed in 100 mM sodium
cacodylate buffer (pH 7.2) containing 2.5% glutaraldehyde for 2 hours at room temperature. After rinsing in 100 mM sodium cacodylate buffer, the tumors were post-fixed and heavy metal–contrasted with potassium ferrocyanide, osmium tetroxide, thiocarbohydrazide, ura-nyl acetate, and lead aspartate. Next, the tumors were dehydrated in ethanol followed by acetone and embedded in Embed 812 resin (Elec-tron Microscopy Sciences). Ultrathin sections 100–200 nm thick were