The association of sex
hormone-binding globulin (SHBG) with
non-alcoholic fatty liver disease
in type 2 diabetic patients
Jang Yel Shin
The Graduate School
Yonsei University
Department of Medicine
The association of sex
hormone-binding globulin (SHBG) with
non-alcoholic fatty liver disease
in type 2 diabetic patients
A Dissertation
Submitted to the Department of Medicine
and the Graduate School of Yonsei University
in partial fulfillment of the
requirements for the degree of
Ph.D. in Medical Science
Jang Yel Shin
This certifies that the dissertation
of Jang Yel Shin is approved.
signature]___________________________
Thesis Supervisor: Soo-Ki Kim
[signature]___________________________
Choon Hee Chung: Thesis Committee Member #1
[signature]___________________________
Soon Koo Baik: Thesis Committee Member #2
[signature]___________________________
Byung Il Yeh: Thesis Committee Member #3
[signature]___________________________
Hyun Soo Kim: Thesis Committee Member #4
The Graduate School
Yonsei University
December 2010
감사의 글
많은 분들이 도움이 있었기에 오늘 본 논문이 완성될 수
있었다고 생각합니다. 연구의 처음 시작부터 끝날 때까지
물심양면으로 전폭적인 도움을 주시고, 애정 어린 충고와
조언으로 지도 편달해주신 김수기 지도교수님께 진심으로
감사의 마음을 전해 드립니다. 저의 부족한 부분에 대해
세심한 지도와 충고를 보내주신 정춘희 교수님, 깊은 관심과
예리한 조언을 주신 백순구 교수님, 미진한 부분을 꼼꼼하게
교정해주시고 격려를 보내주신 예병일 교수님, 그리고 진심
어린 충고와 따뜻한 격려를 보내주신 김현수 교수님께
진정으로 깊은 감사를 드립니다.
평소 따뜻한 애정과 관심으로 지켜봐 주시는 권상옥
교수님, 황금 교수님, 신영구 교수님을 비롯한 여러
교수님들께 감사를 드립니다. 기초실험에 큰 도움을 주신
미생물학 교실의 조현철 선생님께도 감사를 드립니다.
사랑과 정성으로 바르게 키워주신 존경하는 부모님,
그리고 사랑하는 누나, 동생과 작은 기쁨을 나누고 싶습니다.
마지막으로 기쁠 때, 슬플 때, 어려울 때도 항상 옆에서
변함없는 지지와 사랑을 보내준 사랑하는 소중한 아내와
항상 맑은 웃음과 재롱으로 지친 마음에 평안과 위로가
되어준 사랑스런 민서, 민진, 민주에게 이 논문을 바칩니다.
저 자 씀
iiiTable of contents
List of Figures --- ⅵ List of Tables --- ⅶ Abstract --- ⅷ
1. Introduction --- 1
2. Materials and Methods --- 3
2.1. Subjects --- 3
2.2. Clinical and biochemical assessments --- 3
2.3. Sex hormones measurements --- 4
2.4. Measurements of the severity of fatty liver disease --- 5
2.5. SHBG gene polymorphism assessment --- 6
2.6. The measurement of SHBG mRNA and protein expression in TNF-α treated HepG2 cells --- 8
2.7. Statistical analyses --- 9
3. Results --- 10
3.1. Baseline characteristics of the subjects according to the severity of fatty liver disease --- 10
3.2. The associations of SHBG gene polymorphisms with plasma SHBG level and overt NAFLD --- 15
3.3. Correlations of SHBG level with various metabolic parameters after adjustments for age and/or gender --- 19
3.4. Correlations of the metabolic parameters with overt NAFLD --- 21
3.5. Basal characteristics of men and women according to the tertile of SHBG levels --- 23
v
3.6. Odds ratio predicting the presence of overt fatty liver according to the
tertile of SHBG levels --- 25
3.7. Human SHBG mRNA and protein expressions in TNF-α treated HepG2 cells --- 27
4. Discussion --- 30
5. Conclusion --- 36
References --- 37
List of Figures
Fig. 1. Overview of single base primer extension assay using an ABI PRISM SNaPShot Multiplex kit --- 7 Fig. 2. Serum SHBG levels on the basis of the severity of fatty liver
disease --- 11 Fig. 3. The relative mRNA expressions of SHBG in HepG2 cells --- 28 Fig. 4. SHBG concentrations in culture medium of HepG2 cells --- 29
List of Tables
Table 1-A. Clinical characteristics of the subjects according to the severity of fatty liver disease --- 13 Table 1-B. Chemical characteristics of the subjects according to the severity of fatty liver disease --- 14 Table 2. Primer and probe sequences for the amplification of the SHBG SNPs --- 16 Table 3. Genotype distribution of the SHBG SNPs --- 17 Table 4. Serum levels of SHBG according to SHBG genotype --- 18 Table 5. Correlation of SHBG levels with various metabolic parameters after
adjustment for age and/or gender --- 20 Table 6. Multiple logistic regression analysis of metabolic parameters predicting the presence of overt fatty liver after adjustment for age and/or gender --- 22 Table 7. Characteristics of men and women according to the tertile of SHBG levels --- 24 Table 8. Odds ratio predicting the presence of overt fatty liver according to the
tertile of SHBG levels --- 26
Abstract
The association of sex hormone-binding globulin (SHBG) with
non-alcoholic fatty liver disease
in type 2 diabetic patients
Jang Yel Shin Department of Medicine
The Graduate School, Yonsei University (Directed by Professor Soo-Ki Kim)
Non-alcoholic fatty liver disease (NAFLD) is a predictor of metabolic syndrome (MetS), type 2 diabetes, and cardiovascular disease (CVD) and is considered as a hepatic phenotype of MetS. Low sex hormone-binding globulin (SHBG) level has been reported to be significantly associated with insulin resistance (IR), MetS, type 2 diabetes and CVD. Furthermore, several polymorphisms in the SHBG gene have been associated with plasma SHBG level, IR and type 2 diabetes. In this study, we investigated the associations of serum SHBG level with NAFLD, and further evaluated the associations of SHBG polymorphisms with SHBG level and NAFLD in type 2 diabetes.
We enrolled 279 type 2 diabetic patients (age 57.0±9.3 years, men 55.2%) and measured their clinical and chemical metabolic parameters. The severity of NAFLD was measured using liver ultrasound. Sex hormones (SHBG, total and free testosterone, and estradiol) levels and the SHBG polymorphisms were measured.
The SHBG levels were lower in men, patients with MetS, and patients with overt NAFLD compared to those of women, patients without MetS, and patients
without NAFLD (p < 0.01). The SHBG levels were significantly decreased in proportion to the severity of fatty liver disease. The rs6259 locus had a allele frequency of 21.8%, but the rs6257 and the rs1799941 loci had minor-allele frequencies of 0%. However, the presence of a variant minor-allele of rs6259 yielded no difference in SHBG level and was not significantly associated with overt NAFLD. After adjustments for age and gender, the SHBG level was negatively correlated with hypertension, MetS, body mass index (BMI), waist circumference, overt NAFLD, triglycerides, alanine aminotransferase (ALT), γ-glutamyltransferase (γGT), fasting insulin, HOMA-IR and C-reactive protein (CRP) levels. The SHBG level was positively correlated with testosterone and estradiol levels (p < 0.05). The odds ratio (OR) predicting the presence of overt NAFLD after adjusting for age was significantly decreased with increasing levels of SHBG in both men and women. The ORs with increasing level of SHBG in both men and women remained significant even after adjustments for BMI, waist circumference, hypertension, MetS, triglycerides, γGT, ALT, CRP, HOMA-IR, testosterone, and estradiol. To confirm this in vitro, TNF-α treatment decreased the mRNA and protein expression of SHBG in HepG2 cells.
Collectively, these data indicate that low serum SHBG level in both men and women were closely associated with overt NAFLD in type 2 diabetic patients. This suggests that SHBG level might be used as a supplementary marker for the assessment of NAFLD severity in type 2 diabetes.
Key Words: sex hormone-binding globulin, non-alcoholic fatty liver disease, polymorphisms, type 2 diabetes
1. Introduction
Metabolic syndrome (MetS) is characterized by dyslipidemia, visceral obesity, hypertension, and impaired glucose tolerance. The risks for the development of type 2 diabetes and cardiovascular disease (CVD) increase in patients with MetS1-2, and insulin resistance (IR) plays a causal role in pathogenesis of MetS. IR is strongly associated with an accumulation of ectopic fat in the body, specially increased visceral fat3.
Non-alcoholic fatty liver disease (NAFLD), a state in which ectopic fat is accumulated in the liver, yields fatty infiltrations in more than 5% of hepatocytes4. The prevalence of NAFLD is 20-30% of the total population5 and 75% in type 2 diabetic patients6,7 in developed countries. Kotronen et al. has demonstrated that NAFLD is closely correlated with all components of MetS independent of obesity8. NAFLD has been shown in epidemiological studies to predict MetS, type 2 diabetes, and CVD independent of traditional risk factors
9-11. Therefore, NAFLD is considered as a hepatic phenotype of MetS.
Sex hormone-binding globulin (SHBG), mainly synthesized in the liver, plays a vital role in the transport of sex hormones to target tissues, thus modulating the biological activities of these hormones. Several clinical studies showed that decreased SHBG level was significantly associated with insulin resistance12,13, MetS14-18, type 2 diabetes19-21, and CVD22-25 in both men and women. Previous in vitro studies have demonstrated that de novo lipogenesis in hepatocyte regulated human hepatic SHBG production via hepatocyte nuclear factor (HNF)-4α26,27.
Several polymorphisms in the SHBG gene have been found to be associated with plasma SHBG level28-29, insulin resistance30, type 2 diabetes21, reduced bone mineral density (BMD)31, breast cancer32, and prostate cancer33. Ding et al. reported that two variants in the SHBG gene (rs6259, and rs6257) were directly associated with plasma SHBG level and the risk of type 2 diabetes21. Perry et al. reported that the other SHBG gene polymorphism (rs1799941) was strongly associated with increased SHBG level and the risk of type 2 diabetes34.
In this study, we investigated the associations of the serum SHBG level with the presence of NAFLD and further evaluated the associations of the SHBG polymorphisms with serum SHBG level and the presence of NAFLD in type 2 diabetes.
2. Materials and Methods
2.1. Subjects
We enrolled 279 type 2 diabetic subjects using following inclusion criteria: 1) alcohol consumption less than 20 g/day, 2) no known history of viral/ toxic liver disease or hepatic malignancy, and 3) hepatic enzymes levels less than three times the upper normal. Patients with a known history of acute infection, malignancy, hormone replacement therapy, or hyperthyroidism were excluded. The mean age of the subjects was 57.0 ± 9.3 years, and 55.2% of the total subjects were men. The protocol was approved by the ethics committee of Yonsei University Wonju College of Medicine. Written informed consents were obtained from all of the subjects, and all of the reported investigations were carried out according to the principles of the Declaration of Helsinki (the year 2000 revision).
2.2. Clinical and biochemical assessments
A complete medical history revealed alcohol intake, smoking habits, medication, and medical history. Anthropometric data including weight, height, waist and hip circumference and blood pressure were measured. Body mass index (BMI) was calculated as weight divided by height squared (kg/m2). All
blood samples were obtained after overnight fasting. Fasting plasma glucose, insulin, HbA1c, urine albumin excretion, hepatic enzyme levels, high sensitivity C-reactive protein (CRP) and lipid profiles were measured. Serum tumor
necrosis factor (TNF)-α level was measured using ELISA (R&D system, Minneapolis, MN, USA). ELISA methods are performed as follows: The microtiter plate has been pre-coated with a monoclonal antibody specific to TNF-α. Standards or samples are then added to the appropriate microtiter plate wells with a biotin-conjugated polyclonal antibody preparation specific for TNF-α and incubated. The microtiter plate wells are thoroughly washed to remove unbound TNF-α and other components of the sample. In order to quantitate the amount of TNF-α present in the sample, avidin conjugated to Horseradish Peroxidase (HRP) is added to each microplate well and incubated. The wells are thoroughly washed to remove all unbound HRP-conjugated avidin and a TMB (3, 3'5, 5' tetramethyl-benzidine) substrate solution is added to each well. The enzyme (HRP) and substrate are allowed to react over a short incubation period. Only those wells that contain TNF-α, biotin conjugated antibody, and enzyme-conjugated avidin will exhibit a change in color. The enzyme-substrate reaction is terminated by the addition of a sulphuric acid solution and the color change is measured spectrophotometrically at a wavelength of 450 nm ± 2 nm. The concentration of TNF-α in the samples is then determined by comparing the O.D. of the samples to the standard curve.
2.3. Sex hormones measurements
Serum levels of sex hormone-binding globulin were measured using a chemiluminescent immunoassay (CLIA) (Roche Diagnostics, Indianapolis, IN, USA). Also, plasma estradiol (E2) and total testosterone levels were measured
using CLIA. CLIA methods are performed as follows: In the incubation, goat anti-rabbit IgG-coated wells are incubated with 25 μl E2 standards, controls,
patient samples, 100 μl estradiol-HRP Conjugate Reagent and 50 μl rabbit anti-estradiol reagent at room temperature (18-25°C) for 90 minutes. Unbound E2 peroxidase conjugate is then removed and the wells washed. A
solution of chemiluminescent substrate is then added and read relative light units (RLU) with a luminometer. By reference to a series of E2 standards assayed in
the same way, the concentration of E2 in the unknown sample is quantified.
Free testosterone (T) levels were measured using an immunoradiometric assay (IRMA). IRMA methods are performed as follows: Free serum T by equilibrium dialysis measures percent free T by adding T to serum and dialyzing the mixture for 11 h against a phosphate-saline buffer, which is placed on the opposite side of the dialysis membrane, at 37˚C using a dialysis cell. The percent free T is calculated at equilibrium as T in buffer/T in serum. Serum free T is then calculated by multiplying the percent free T (by equilibrium dialysis).
2.4. Measurements of the severity of fatty liver disease
All of the abdominal ultrasounds were performed by the same specialist in the same clinical setting. The severity of NAFLD on ultrasound was graded. Mild (grade 1) was defined as a slight diffuse increase in liver echogenicity in the hepatic parenchyma with normal visualization of the diaphragm and the portal veins. Moderate (grade 2) was defined as a moderately diffuse increase in liver echogenicity with a slightly impaired visualization of the diaphragm and the
portal veins. Severe (grade 3) was defined as a marked increase in liver echogenicity with poor or no visualization of the diaphragm and the portal veins. We defined overt NAFLD in this study as greater than a moderate degree of fatty liver disease.
2.5. SHBG gene polymorphism assessment
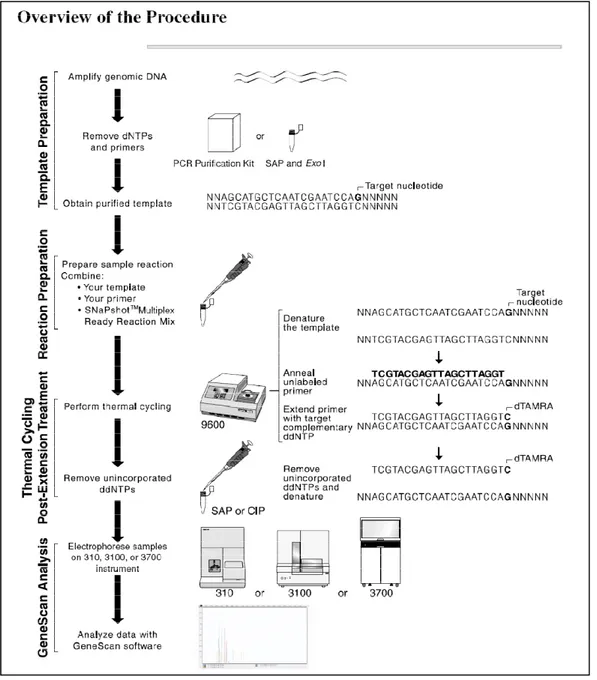
Genomic DNA was isolated from peripheral blood lymphocytes. The SHBG gene polymorphism (rs6257, rs6259, and rs1799941) were assayed via a single base primer extension assay using an ABI PRISM SNaPShot Multiplex kit (ABI, Foster, CA, USA) according to the manufacturer´s recommendations (Fig. 1). These polymorphisms were selected because they were reported to be associated with circulating SHBG level and type 2 diabetes in previous studies21,34. The genotyping success rate was 100%.
Fig. 1. Overview of single base primer extension assay using an ABI PRISM SNaPShot Multiplex kit
2.6. The measurement of SHBG mRNA and protein expression
in TNF-α treated HepG2 cells
HepG2 cells were cultivated in DMEM containing 10% fetal calf serum (FCS) and 5% CO2 at 37˚C. For TNF-α treatment, HepG2 cells were seeded on 35
mm dishes at a density of 1x10⁶ Cells/cm2 and cultivated for 24 hours. The cultivated medium was replaced with a fresh medium without FCS. After a 24 hours incubation with TNF-α(25 ng/ml and 50 ng/ml), HepG2 cells were washed three times with sodium phosphate buffer (pH 7.5). Total RNA was isolated by using the RNeasy plus mini kit (Qiagen, Hilden, Germany). The cDNA were synthesized by using the QuantiTect Reverse transcription kit (Qiagen, Hilden, Germany). Real Time RT-PCRs were performed using SYBR Green I. All primers and dual-labeled probes were designed with Primer3. Two pairs of SHBG primers were used for detection and differentiation: (forward, 5´ -ACTCAGGCAGAATTCAATCTC-3´; reverse, 5´-CTTTAATGGGAAGCGTCAGT-3´). Each sample was investigated by two RT-PCRs using the two pairs of primers, respectively. The reactions began with reverse transcription (50˚C for 2 min), and this was followed by denaturation (95˚C for 10 mim) and 40 cycles of amplification (95˚C for 15 sec, 60˚C for 30 sec, 72˚C for 30 sec). The fluorescence signals were measured during the extension step (72˚C for 30 s). The analyses for assessing the relative gene expression of SHBG were performed using the software, Rotor-Gene Real Time Analysis Software 6.1.
Human SHBG production by HepG2 cells incubated with TNF-α (25 ng/ml
and 50 ng/ml) were measured using ELISA (Alpha Diagnostic International, San Antonio, TX, USA).
2.7. Statistical analyses
Statistical analysis was performed using SPSS (version 15.0; SPSS, Inc, Chicago, IL, USA). Data are presented as means ± SD and as a number (in percentages) for categorical measures. Data that were not normally distributed were logarithmically transformed before analysis. For continuous variables, the differences between groups were compared using either an unpaired Student’s t test or a one-way ANOVA. The χ2 test was used to compare categorical variables between groups. Correlations of the SHBG with various metabolic parameters were analyzed using multiple regression analysis after adjustment for age and/or gender. Logistic regression analysis was performed to assess the odds ratio (OR) of the metabolic parameters for the presence of overt NAFLD after adjustments for age and/or gender. All patients were divided into three groups according to the tertile of the SHBG level in men and women, respectively. Multiple logistic regression analysis was used to assess the OR for the presence of overt NAFLD in subjects in the higher SHBG tertiles compared to those inh the lowest tertile. Two-sided values of p less than 0.05 were considered significant.
3. Results
3.1. Baseline characteristics of the subjects according to the
severity of fatty liver disease
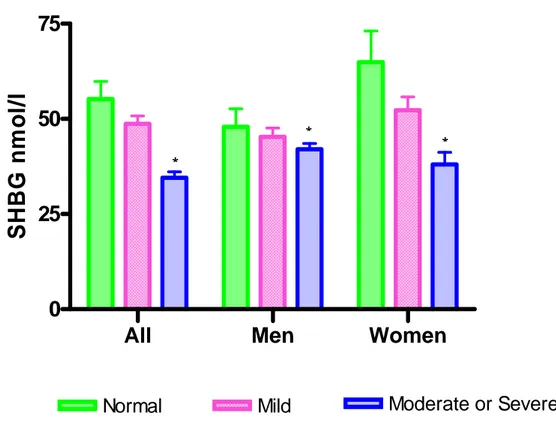
The mean duration of diabetes was 7.3 years, while the mean HbA1C level was 7.7%. The percentages of patients with MetS and overt NAFLD were 69.2% and 43.0%, respectively. Menopausal patients constituted 80.2% of the females. All subjects were divided on the basis of the severity of their fatty liver disease into three subgroups: normal (10.0%), mild degree (47.0%), and greater than moderate degree (43.0%). SHBG levels in patients with overt NAFLD were significantly lower in both men and women compared to patients without overt NAFLD (Fig. 2).
Fig. 2. Serum SHBG level on the basis of the severity of fatty liver disease. SHBG level was significantly decreased in proportion to the severity of fatty liver disease. *: p value < 0.01 compared with the normal.
All
Men
Women
0
25
50
75
Normal
SHBG
n
m
o
l/l
* * *Moderate or Severe
Mild
- 11 -As shown in Table 1, patients with overt NAFLD had not only higher values of BMI, but also higher values of waist circumference, triglycerides, hepatic enzymes, fasting insulin, and HOMA-IR (p < 0.05). However, these same patients were younger, and had a shorter duration of diabetes and lower HDL levels (p < 0.05) compared to those without NAFLD. Also, patients with overt NAFLD were more likely to have MetS than were those without overt NAFLD.
The SHBG levels also showed differences according to gender (men vs. women: 39.5 ± 17.6 vs. 47.9 ± 27.3 nmol/l, p < 0.01). The SHBG levels in menopausal women showed no significant difference compared to those of pre-menopausal women (pre-menopause vs. post-menopause: 50.8 ± 36.7 vs. 47.2 ± 24.5 nmol/l, p = 0.6). The SHBG levels were significantly lower in patients with MetS compared to those without MetS (40.8 ± 20.0 vs. 48.7 ± 27.5 nmol/l, p < 0.01).
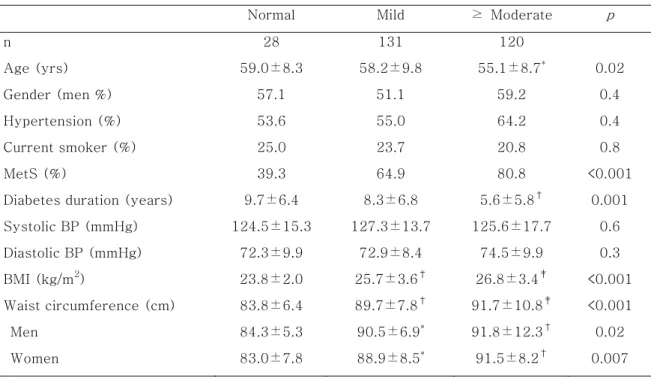
Table 1-A. Clinical characteristics of the subjects according to the severity of fatty liver disease
Normal Mild ≥ Moderate p
n 28 131 120 Age (yrs) 59.0±8.3 58.2±9.8 55.1±8.7* 0.02 Gender (men %) 57.1 51.1 59.2 0.4 Hypertension (%) 53.6 55.0 64.2 0.4 Current smoker (%) 25.0 23.7 20.8 0.8 MetS (%) 39.3 64.9 80.8 <0.001
Diabetes duration (years) 9.7±6.4 8.3±6.8 5.6±5.8† 0.001
Systolic BP (mmHg) 124.5±15.3 127.3±13.7 125.6±17.7 0.6 Diastolic BP (mmHg) 72.3±9.9 72.9±8.4 74.5±9.9 0.3 BMI (kg/m2) 23.8±2.0 25.7±3.6† 26.8±3.4‡ <0.001 Waist circumference (cm) 83.8±6.4 89.7±7.8† 91.7±10.8‡ <0.001 Men 84.3±5.3 90.5±6.9* 91.8±12.3† 0.02 Women 83.0±7.8 88.9±8.5* 91.5±8.2† 0.007
Data are means ± SD unless indicated otherwise. p value: the difference among three groups using χ2 test and ANOVA test. *: p value < 0.05 compared with normal. †: p
value < 0.01 compared with normal. ‡: p value < 0.001 compared with normal.
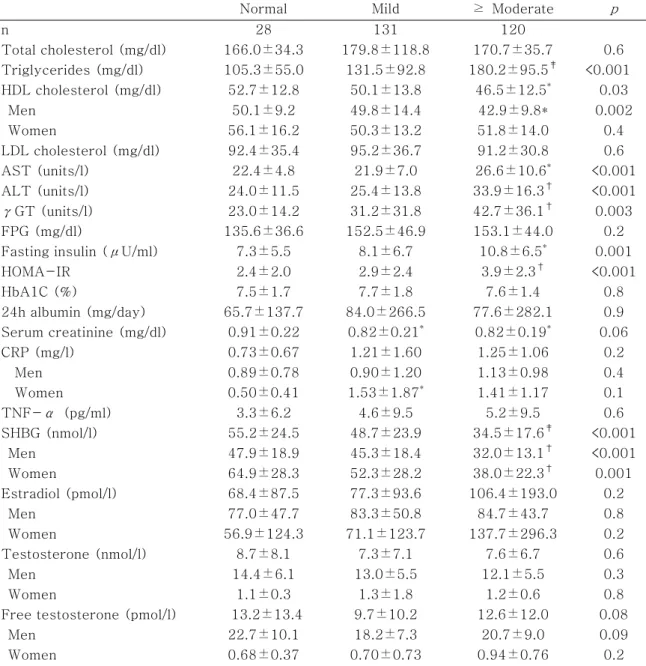
Table 1-B. Chemical characteristics of the subjects according to the severity of fatty liver disease
Normal Mild ≥ Moderate p
n 28 131 120 Total cholesterol (mg/dl) 166.0±34.3 179.8±118.8 170.7±35.7 0.6 Triglycerides (mg/dl) 105.3±55.0 131.5±92.8 180.2±95.5‡ <0.001 HDL cholesterol (mg/dl) 52.7±12.8 50.1±13.8 46.5±12.5* 0.03 Men 50.1±9.2 49.8±14.4 42.9±9.8* 0.002 Women 56.1±16.2 50.3±13.2 51.8±14.0 0.4 LDL cholesterol (mg/dl) 92.4±35.4 95.2±36.7 91.2±30.8 0.6 AST (units/l) 22.4±4.8 21.9±7.0 26.6±10.6* <0.001 ALT (units/l) 24.0±11.5 25.4±13.8 33.9±16.3† <0.001 γGT (units/l) 23.0±14.2 31.2±31.8 42.7±36.1† 0.003 FPG (mg/dl) 135.6±36.6 152.5±46.9 153.1±44.0 0.2
Fasting insulin (μU/ml) 7.3±5.5 8.1±6.7 10.8±6.5* 0.001
HOMA-IR 2.4±2.0 2.9±2.4 3.9±2.3† <0.001 HbA1C (%) 7.5±1.7 7.7±1.8 7.6±1.4 0.8 24h albumin (mg/day) 65.7±137.7 84.0±266.5 77.6±282.1 0.9 Serum creatinine (mg/dl) 0.91±0.22 0.82±0.21* 0.82±0.19* 0.06 CRP (mg/l) 0.73±0.67 1.21±1.60 1.25±1.06 0.2 Men 0.89±0.78 0.90±1.20 1.13±0.98 0.4 Women 0.50±0.41 1.53±1.87* 1.41±1.17 0.1 TNF-α (pg/ml) 3.3±6.2 4.6±9.5 5.2±9.5 0.6 SHBG (nmol/l) 55.2±24.5 48.7±23.9 34.5±17.6‡ <0.001 Men 47.9±18.9 45.3±18.4 32.0±13.1† <0.001 Women 64.9±28.3 52.3±28.2 38.0±22.3† 0.001 Estradiol (pmol/l) 68.4±87.5 77.3±93.6 106.4±193.0 0.2 Men 77.0±47.7 83.3±50.8 84.7±43.7 0.8 Women 56.9±124.3 71.1±123.7 137.7±296.3 0.2 Testosterone (nmol/l) 8.7±8.1 7.3±7.1 7.6±6.7 0.6 Men 14.4±6.1 13.0±5.5 12.1±5.5 0.3 Women 1.1±0.3 1.3±1.8 1.2±0.6 0.8
Free testosterone (pmol/l) 13.2±13.4 9.7±10.2 12.6±12.0 0.08
Men 22.7±10.1 18.2±7.3 20.7±9.0 0.09
Women 0.68±0.37 0.70±0.73 0.94±0.76 0.2
Data are means ± SD unless indicated otherwise. p value: the difference among three groups using ANOVA test. *: p value < 0.05 compared with normal. †: p value < 0.01 compared with normal. ‡: p value < 0.001 compared with normal.
3.2. The associations of SHBG gene polymorphisms with
plasma SHBG level and overt NAFLD
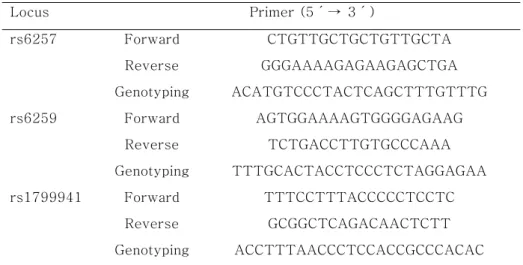
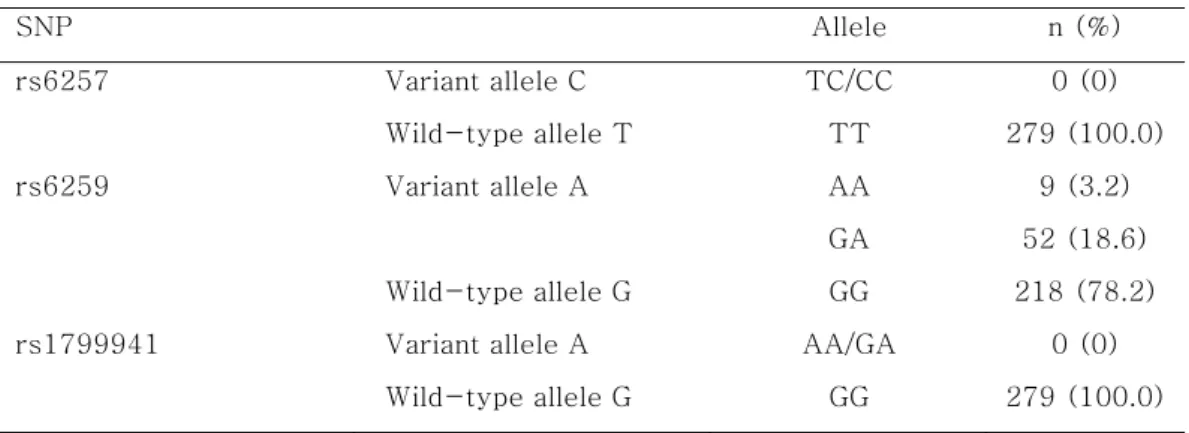
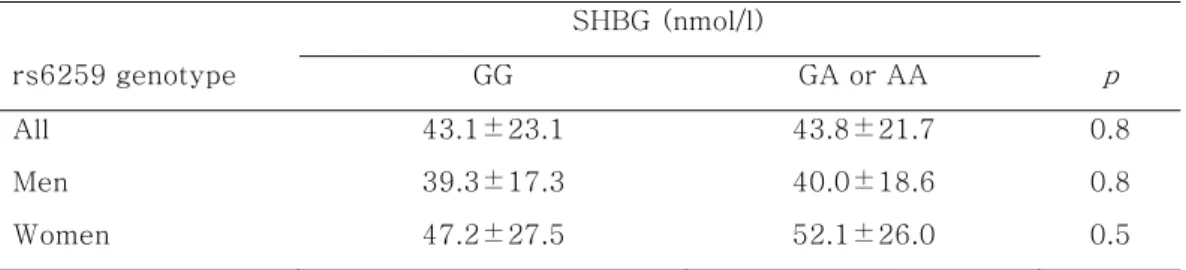
The primer sequences used in this study are shown in Table 2. The rs6259 locus had a minor-allele frequency of 21.8%, but rs6257 and rs1799941 loci had minor-allele frequencies of 0% (Table 3). The presence of a variant allele of rs6259 yielded no difference in serum SHBG level (Table 4), nor was it significantly associated with overt NAFLD (Table 5).
Table 2. Primer and probe sequences for the amplifications of the SHBG SNPs Locus Primer (5´→ 3´) rs6257 Forward CTGTTGCTGCTGTTGCTA Reverse GGGAAAAGAGAAGAGCTGA Genotyping ACATGTCCCTACTCAGCTTTGTTTG rs6259 Forward AGTGGAAAAGTGGGGAGAAG Reverse TCTGACCTTGTGCCCAAA Genotyping TTTGCACTACCTCCCTCTAGGAGAA rs1799941 Forward TTTCCTTTACCCCCTCCTC Reverse GCGGCTCAGACAACTCTT Genotyping ACCTTTAACCCTCCACCGCCCACAC - 16 -
Table 3. Genotype distributions of the SHBG SNPs SNP Allele n (%) rs6257 Variant allele C TC/CC 0 (0) Wild-type allele T TT 279 (100.0) rs6259 Variant allele A AA 9 (3.2) GA 52 (18.6) Wild-type allele G GG 218 (78.2)
rs1799941 Variant allele A AA/GA 0 (0)
Wild-type allele G GG 279 (100.0)
Table 4. Serum levels of SHBG according to SHBG genotype SHBG (nmol/l) rs6259 genotype GG GA or AA p All 43.1±23.1 43.8±21.7 0.8 Men 39.3±17.3 40.0±18.6 0.8 Women 47.2±27.5 52.1±26.0 0.5 - 18 -
3.3. Correlations of SHBG level with various metabolic
parameters after adjustments for age and/or gender
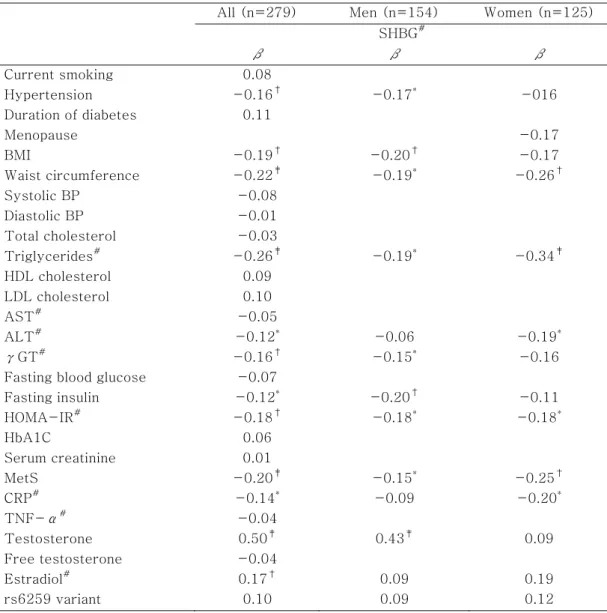
As shown in Table 5, age and gender adjusted SHBG level was negatively correlated with hypertension, MetS, BMI, waist circumference, triglycerides, alanine aminotransferase (ALT), γ-glutamyltransferase (γGT), fasting insulin, HOMA-IR, and CRP levels. While, the SHBG level was positively correlated with testosterone and estradiol levels (p < 0.05). In multivariate regression analysis, waist circumference and triglycerides were independently correlated with SHBG (p < 0.05). However, neither free testosterone nor TNF-α level were significantly correlated with SHBG level.
Table 5. Correlations of SHBG levels with various metabolic parameters after adjustments for age and/or gender
All (n=279) Men (n=154) Women (n=125) SHBG# β β β Current smoking 0.08 Hypertension -0.16† -0.17* -016 Duration of diabetes 0.11 Menopause -0.17 BMI -0.19† -0.20† -0.17 Waist circumference -0.22‡ -0.19* -0.26† Systolic BP -0.08 Diastolic BP -0.01 Total cholesterol -0.03 Triglycerides# -0.26‡ -0.19* -0.34‡ HDL cholesterol 0.09 LDL cholesterol 0.10 AST# -0.05 ALT# -0.12* -0.06 -0.19* γGT# -0.16† -0.15* -0.16
Fasting blood glucose -0.07
Fasting insulin -0.12* -0.20† -0.11 HOMA-IR# -0.18† -0.18* -0.18* HbA1C 0.06 Serum creatinine 0.01 MetS -0.20‡ -0.15* -0.25† CRP# -0.14* -0.09 -0.20* TNF-α# -0.04 Testosterone 0.50‡ 0.43‡ 0.09 Free testosterone -0.04 Estradiol# 0.17† 0.09 0.19 rs6259 variant 0.10 0.09 0.12
β: multiple regression coefficient after adjustment for age and gender, #: Log transformed data before analysis, *: p < 0.05, †: p < 0.01, ‡: p < 0.001
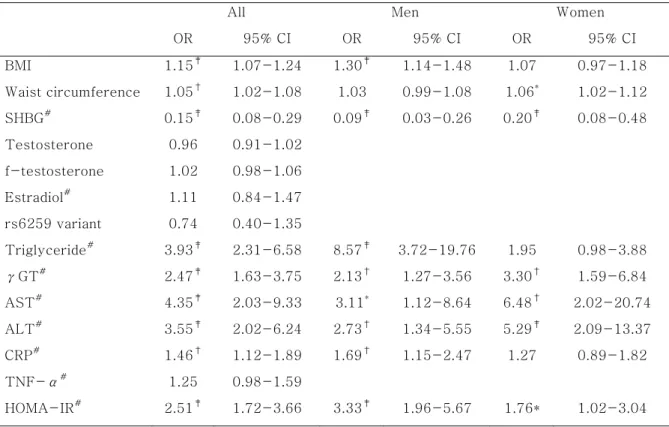
3.4. Correlations of the metabolic parameters with overt
NAFLD
In multiple logistic regression analysis after adjustment for age and gender, the odds ratio (OR) of serum SHBG levels predicting the presence of overt NAFLD was significantly decreased [OR (95% CI) = 0.15 (0.08 - 0.29), p < 0.001]. Also, ORs of waist circumference, BMI, HOMA-IR, CRP, triglycerides, aspartate aminotransferase (AST), ALT, and γGT predicting the presence of overt NAFLD were significantly increased (p < 0.05). However, the rs6259 variant, total and free testosterone, estradiol, and TNF-α levels were not associated with overt NAFLD (Table 6).
Table 6. Multiple logistic regression analysis of metabolic parameters predicting the presence of overt fatty liver after adjustment for age and/or gender
All Men Women
OR 95% CI OR 95% CI OR 95% CI BMI 1.15‡ 1.07-1.24 1.30‡ 1.14-1.48 1.07 0.97-1.18 Waist circumference 1.05† 1.02-1.08 1.03 0.99-1.08 1.06* 1.02-1.12 SHBG# 0.15‡ 0.08-0.29 0.09‡ 0.03-0.26 0.20‡ 0.08-0.48 Testosterone 0.96 0.91-1.02 f-testosterone 1.02 0.98-1.06 Estradiol# 1.11 0.84-1.47 rs6259 variant 0.74 0.40-1.35 Triglyceride# 3.93‡ 2.31-6.58 8.57‡ 3.72-19.76 1.95 0.98-3.88 γGT# 2.47‡ 1.63-3.75 2.13† 1.27-3.56 3.30† 1.59-6.84 AST# 4.35‡ 2.03-9.33 3.11* 1.12-8.64 6.48† 2.02-20.74 ALT# 3.55‡ 2.02-6.24 2.73† 1.34-5.55 5.29‡ 2.09-13.37 CRP# 1.46† 1.12-1.89 1.69† 1.15-2.47 1.27 0.89-1.82 TNF-α# 1.25 0.98-1.59 HOMA-IR# 2.51‡ 1.72-3.66 3.33‡ 1.96-5.67 1.76* 1.02-3.04
f-testosterone: free testosterone, #: Log transformed data before analysis, *:p < 0.05, †:
p < 0.01, ‡: p < 0.001
3.5. Basal characteristics of men and women according to the
tertile of SHBG levels
Men in the highest tertile of SHBG were older and had a higher total testosterone compared to those in the lowest tertile. They not only had a lower BMI, but also had a lower level of triglycerides and a lower likelihood of overt NAFLD compared to the men in the lowest tertile. Women in the highest tertile had a lower waist circumference with a lower level of triglycerides, but had a higher likelihood of overt NAFLD compared to the women in the lowest tertile.
Table 7. Characteristics of men and women according to the tertile of SHBG levels SHBG tertile p Men 1 2 3 Age (yrs) 51.9±8.4 55.8±7.5* 60.7±9.5‡ <0.001 BMI (kg/m2) 26.7±3.6 25.6±2.6 25.2±2.5* 0.04 Waist circumference (cm) 93.0±8.3 87.8±12.6† 90.6±7.5 0.03 Triglyceride (mg/dl) 169.0±87.0 154.8±90.0 129.8±114.5* 0.1 γGT (units/l) 50.4±39.8 39.3±38.8 34.5±27.8 0.07 ALT (units/l) 34.1±16.1 31.2±17.2 29.3±16.0 0.3 CRP (mg/l) 1.16±1.19 0.86±0.66 0.99±1.24 0.4 Testosterone (nmol/l) 9.2±2.9 13.6±4.5‡ 15.5±6.5‡ <0.001 Free testosterone (pmol/l) 18.6±6.3 23.3±10.9† 17.5±6.6 0.01
Estradiol (pmol/l) 76.7±42.4 83.6±42.7 89.4±54.9 0.4 MetS (%) 74.5 62.7 57.7 0.2 Overt NAFLD (%) 72.5 43.1 23.1 <0.001 Women 1 2 3 Age (yrs) 55.9±9.1 59.0±9.3 58.9±9.6 0.2 BMI (kg/m2) 26.4±3.0 27.2±4.1 24.9±4.5 0.03 Waist circumference (cm) 90.3±7.8 91.2±8.8 86.5±8.7* 0.03 Triglyceride (mg/dl) 175.6±110.0 142.4±78.9 127.3±72.0* 0.04 γGT (units/l) 30.5±27.1 25.8±31.4 27.6±23.1 0.7 ALT (units/l) 28.4±12.4 24.8±14.1 23.8±12.5 0.2 CRP (mg/l) 1.58±1.26 1.45±1.97 1.11±1.32 0.4 Testosterone (nmol/l) 1.1±0.4 1.1±0.5 1.5±2.2 0.2
Free testosterone (pmol/l) 0.98±0.82 0.67±0.46 0.73±0.80 0.1
Estradiol (pmol/l) 83.3±151.3 80.6±149.2 123.4±297.0 0.6
MetS (%) 80.5 78.6 64.3 0.2
Overt NAFLD (%) 65.9 28.6 23.8 <0.001
Data are means ± SD unless indicated otherwise. p value: the difference among three groups using χ2 test and ANOVA test. *: p value < 0.05. †: p value < 0.01. ‡: p value < 0.001 compared with the lowest tertile.
3.6. Odds ratio predicting the presence of overt fatty liver
according to the tertile of SHBG levels
The ORs predicting the presence of overt NAFLD after adjustment for age were significantly decreased with increasing levels of SHBG in both men and women. The ORs with increasing levels of SHBG in men and women remained significant even after further adjustments for BMI, waist circumference, hypertension, MetS, triglycerides, γGT, ALT, CRP, HOMA-IR, total testosterone and estradiol (Table 8).
Table 8. Odds ratios predicting the presence of overt fatty liver according to the tertile of SHBG levels Men OR (95% CI) Tertile 1 2 3 Model 1 1 0.28 (0.12-0.66) 0.11 (0.04-0.29) Model 2 1 0.33 (0.11-0.95) 0.20 (0.06-0.65) Model 3 1 0.24 (0.07-0.76) 0.12 (0.03-0.51) Women 1 2 3 Model 1 1 0.22 (0.09-0.57) 0.17 (0.07-0.45) Model 2 1 0.28 (0.10-0.79) 0.22 (0.07-0.67) Model 3 1 0.26 (0.09-0.75) 0.20 (0.06-0.65)
Model 1: adjustment for age,
Model 2: model 1 + further adjustments for BMI, waist circumference, hypertension, MetS, triglycerides, ALT, γGT, CRP, HOMA-IR,
Model 3: model 2 + further adjustments for estradiol and testosterone
3.7. Human SHBG mRNA and protein expressions in TNF-α
treated HepG2 cells
Real Time RT-PCR analysis showed that TNF-α treatment decreased the SHBG gene expression in HepG2 cells. The relative mRNA expressions of SHBG in TNF-αtreated HepG2 cells were lower compared to those in control HepG2 cells(control vs. 25 ng/ml treated vs. 50 ng/ml treated = 1: 0.77 ± 0.21: 0.61 ± 0.10, p < 0.01)(Fig. 3).
In parallel, the secretion of SHBG protein in TNF-α treated HepG2 cells was significantly lower compared to that by control HepG2 cells (control vs. 25 ng/ml treated vs. 50 ng/ml treated = 9.8 ± 0.5mol/l: 8.2 ± 0.3 nmol/l: 8.1 ± 0.5 nmol/l, p < 0.01)(Fig. 4).
Control
25ng/ml TNF-
α 50ng/ml TNF-α
0.00
0.25
0.50
0.75
1.00
Re
la
ti
v
e
SHBG m
RNA ex
pr
es
s
ion
* * Fig. 3. The relative mRNA expressions of SHBG in HepG2 cells. The mRNA expressions of SHBG in TNF-αtreated HepG2 cells were lower compared to those in control HepG2 cells. *: p value < 0.01 compared to the control.Control 25ng/ml TNF-α 50ng/ml TNF-α
0
1
2
3
4
5
6
7
8
9
10
11
S
H
B
G
co
n
cen
tr
ai
o
n
(
n
m
o
l/
l)
* *Fig. 4. Human SHBG concentrations in culture medium of HepG2 cells. Human SHBG production in TNF-αtreated HepG2 cells were significantly lower compared to those in control HepG2 cells. *: p value < 0.01 compared to the control.
4. Discussion
This study clearly indicate that low plasma SHBG level is significantly associated with NAFLD in type 2 diabetic patients independent of traditional risk factors. The risk of having an overt NAFLD in patients in the lowest tertile of SHBG level was greater in both men (8x) and women (5x) compared to that of patients in the highest tertile. Serum SHBG level gradually decreased with increasing the severity of fatty liver disease, and the likelihood of having overt NAFLD also gradually decreased in proportion to increasing SHBG tertile. Furthermore, the odds ratios of SHBG for the presence of overt NAFLD were equal to those of the traditional markers of fatty liver disease such as AST, ALT, and γGT. These findings suggest that SHBG level might be a useful supplementary marker for the assessment of the severity of fatty liver disease independent of traditional risk factors.
Previous studies have shown that low SHBG level was associated with insulin resistance12,13, MetS14-18, and type 2 diabetes19-21. Low SHBG level was associated with HOMA-IR and MetS in our study, and low SHBG level showed a close association with NAFLD in type 2 diabetic patients. These findings are consistent with those of a recent study, in that low SHBG level in both healthy women and women with polycystic ovary syndrome was significantly associated with hepatic steatosis independent of age, BMI, and waist circumference35. However, Graffigna et al. reported that SHBG level was significantly correlated with HOMA-IR but not with fatty liver disease36. The above positive findings
may be more reliable than those of Graffigna et al. because of the large sample size and the inclusion of healthy control subjects.
The causal link between circulating SHBG level and insulin resistance, MetS, NAFLD, and type 2 diabetes has not been fully elucidated. A recent study21 demonstrated that SHBG might play a causal role in the development of type 2 diabetes. Higher level of baseline SHBG was prospectively associated with a lower risk of type 2 diabetes. Furthermore, a variant allele of the SHBG gene (rs6259) with higher SHBG level had a lower risk of type 2 diabetes, while the other variant allele (rs6257) with lower SHBG level had a higher risk of type 2 diabetes. Several adipocytokines, such as adiponectin, leptin, resistin and TNF-α, are known to be profoundly involved in the pathogenesis of NAFLD. High TNF-α and low adiponectin levels have been reported to be associated with NAFLD37. Yasui et al. reported that adiponectin levels in aging populations were positively correlated with SHBG levels, with both adiponectin and SHBG being negatively correlated with HOMA-IR38. In our study, low SHBG levels were associated with NAFLD, but high TNF-α levels were not associated with SHBG or NAFLD. This discrepancy may be explained by the low measurement values and broad standard deviations of the plasma TNF-α levels.
Selva et al. demonstrated that monosaccharide-induced de novo lipogenesis reduced human SHBG gene expression and protein production in HepG2 cells via down-regulation of HNF-4α. Thyroid hormone increased SHBG production in HepG2 cells and transgenic mice by increasing HNF-4α gene expression26,27. Janne et al. suggested that HNF-4 controlled transcription from a TATA-less human SHBG gene promoter, and that HNF-4α might play a key role in
controlling human SHBG gene expression in the liver39. The HNF-4α, nuclear receptor super-family, mainly expressed in liver, plays a role in the expression control of the genes for the specialized functions of the liver, such as glucose and lipid metabolism. Based on these findings, we hypothesized that patients with NAFLD would have lower SHBG levels than those without NAFLD, because increased de novo lipogenesis in the liver via hyperglycemia might decrease hepatic SHBG production in part through increased cellular levels of palmitate and/or though down-regulation of HNF-4α. Our data clearly showed that SHBG level was decreased in proportion to the increasing severity of fatty liver disease, but we could not prove the HNF-4α down-regulation in NAFLD because of a limitation of liver biopsy. To prove whether SHBG plays a causal role in the pathogenesis of NAFLD or low SHBG level is a consequence of NAFLD, further in vivo studies and human prospective studies are warranted.
Mogilenko et al. showed that TNF-α treatment inhibited human HNF-4α expression in HepG2 Cells40. However, Zhou et al. demonstrated that TNF-α treatment did not affect the HNF-4α protein levels in HepG2 cells41. To prove whether TNF-α treatment inhibits the expression of the SHBG mRNA and protein, we performed in vitro study. In this experiment, TNF-α treatment inhibited the expression of the SHBG mRNA and protein in HepG2 cells. These findings suggest that TNF-α may play an essential role in the regulation of SHBG expression in the liver. Feldstein et al. demonstrated that palmiate treatment of HepG2 cells increased TNF-α expression and diet-induced hepatic steatosis was prevented in obese TNF receptor 1 (TNFR1) knockout mice42. Therefore, we deduce that low SHBG level may be associated with
NAFLD, from the evidence that TNF-α is not only profoundly involved in the pathogenesis of NAFLD, but also is increased in patients with NAFLD.
Onat et al. reported that SHBG had inverse correlations with waist circumference, triglycerides, fasting insulin, and CRP, but had positive correlations with age, HDL cholesterol, and total testosterone43. Yasui et al reported that SHBG was negatively correlated with triglycerides, but positively correlated with HDL cholesterol only in women after adjustment for age44. Above findings implied that SHBG was closely associated with the obesity and dyslipidemia that were identified as major risk factors for NAFLD. In our study, SHBG was negatively correlated with BMI, waist circumference, hypertension, MetS, fasting insulin, HOMA-IR, CRP, and triglycerides. While, it was positively correlated with total testosterone, and waist circumference and triglycerides were independently associated with SHBG. Miyaaki et al. reported that severe steatosis was significantly associated with male gender, younger age, and absence of type 2 diabetes, and that while severe fibrosis showed a close association with female gender, older age, type 2 diabetes, and hypertension45. In our study, patients with overt NAFLD were younger, and had the higher portion of men and a shorter duration of diabetes than those without NAFLD.
Two studies reported that SHBG polymorphisms (rs6259, rs6257, and rs1799941) were associated with circulating SHBG level and risk of type 2 diabetes21,34. They suggested that SHBG might play an important role in the development of type 2 diabetes. In the present study, we assayed three SHBG gene polymorphisms (rs6257, rs6259, and rs1799941) and found that only the
rs6259 locus had a minor-allele frequency of 21.8% in Koreans. However, the rs6259 variant was not associated with circulating SHBG level or NAFLD.
As in previous studies, the SHBG levels in women were higher than those in men. To minimize the effect of SHBG on gender, our study participants were stratified according to this variable. The meta-analysis data had a stronger inverse association of SHBG with the risk of type 2 diabetes in women due to the greater difference of mean SHBG level in women between type 2 diabetes and the controls compared to that in men46. However, our results showed a stronger inverse association of SHBG with overt NAFLD in men than in women. This discrepancy is partially explained by a greater likelihood of overt NAFLD in men as well as a similar difference of mean SHBG level between patients with overt NAFLD and the controls in men and women.
Our study had several strengths. First, we demonstrated the association between SHBG level and the severity of fatty liver disease measured via ultrasonography. SHBG levels decreased gradually according to the severity of NAFLD, so that the likelihood for overt NAFLD was gradually decreased in proportion to increasing tertile of SHBG. Second, we checked not only SHBG level, but also the levels of testosterone and estradiol. Previous studies reported that testosterone and estradiol were associated with SHBG level, MetS, and type 2 diabetes47-49. In the current study, however, not the other sex hormone, but SHBG alone was significantly associated with overt NAFLD. These results suggest that SHBG itself might be directly associated with NAFLD. Third, in order to limit the source of inter-personal error in the measurement of the
severity of fatty liver disease, the same specialist performed all of the abdominal ultrasonographies in the same clinic.
Several limitations exist in our study. First, because the present study is cross-sectional, we cannot prove a direct causal link between SHBG and the risk of NAFLD. Therefore, further prospective clinical studies are needed. Second, our results cannot be generalized to all Koreans because our small sample size is small. In addition, the all participants in this study had type 2 diabetes, and no healthy controls were utilized. Third, we did not perform liver biopsy for the assessment of the severity of fatty liver disease, even though liver biopsy is the gold standard. However, it should not be performed in the majority of patients that had asymptomatic or benign fatty liver disease. Therefore, ultrasonography and laboratory tests generally have been used in clinical settings. Finally, we did not measure thyroid hormone levels in all patients and so could not control for the confounding effect caused by hyperthyroidism, i.e., increased SHBG level50. To minimize this confounding factor, we excluded the patients with a known history of hyperthyroidism or current anti-thyroid drug use.
5. Conclusion
This study clearly indicates that low serum SHBG level in both men and women was closely associated with overt NAFLD in type 2 diabetic patients. Our findings suggest that serum SHBG level might be used as a supplementary marker for the assessment of the severity of NAFLD in type 2 diabetes patients, independent of the traditional risk factors.
REFERENCES
1. Meigs JB, Wilson PW, Fox CS, Vasan RS, Nathan DM, Sullivan LM, D'Agostino RB. Body mass index, metabolic syndrome, and risk of type 2 diabetes or cardiovascular disease. J Clin Endocrinol Metab 2006;91:2906-2912.
2. Malik S, Wong ND, Franklin S, Pio J, Fairchild C, Chen R. Cardiovascular disease in U.S. patients with metabolic syndrome, diabetes, and elevated C-reactive protein. Diabetes Care 2005;28:690-693.
3. Despres JP, Lemieux I, Bergeron J, Pibarot P, Mathieu P, Larose E, Rodes-Cabau J, Bertrand OF, Poirier P. Abdominal obesity and the metabolic syndrome: contribution to global cardiometabolic risk. Arterioscler Thromb Vasc Biol 2008;28:1039-1049.
4. Neuschwander-Tetri BA, Caldwell SH. Nonalcoholic steatohepatitis: summary of an AASLD Single Topic Conference. Hepatology 2003;37:1202-1219. 5. Tilg H, Kaser A. Treatment strategies in nonalcoholic fatty liver disease. Nat
Clin Pract Gastroenterol Hepatol 2005;2:148-155.
6. Gupte P, Amarapurkar D, Agal S, Baijal R, Kulshrestha P, Pramanik S, Patel N, Madan A, Amarapurkar A, Hafeezunnisa. Non-alcoholic steatohepatitis in type 2 diabetes mellitus. J Gastroenterol Hepatol 2004;19:854-858.
7. Leite NC, Salles GF, Araujo AL, Villela-Nogueira CA, Cardoso CR. Prevalence and associated factors of non-alcoholic fatty liver disease in patients with type-2 diabetes mellitus. Liver Int 2009;29:119-119.
8. Kotronen A, Yki-Jarvinen, H. Fatty liver: a novel component of the metabolic syndrome. Arterioscler Thromb Vasc Biol 2008;28:27-38.
9. Hamaguchi M, Kojima T, Itoh Y, Harano Y, Fujii K, Nakajima T, Kato T, Takeda N, Okuda J, Ida K, Kawahito Y, Yoshikawa T, Okanoue T. The severity of ultrasonographic findings in nonalcoholic fatty liver disease reflects the metabolic syndrome and visceral fat accumulation. Am J Gastroenterol 2007;102:2708-2715.
10. Shibata M, Kihara Y, Taguchi M, Tashiro M, Otsuki M. Nonalcoholic fatty liver disease is a risk factor for type 2 diabetes in middle-aged Japanese men. Diabetes Care 2007;30:2940-2944.
11. Brea A, Mosquera D, Martin E, Arizti A, Cordero JL, Ros E. Nonalcoholic fatty liver disease is associated with carotid atherosclerosis: a case-control study. Atheroscler Thromb Vasc Biol 2005;25:1045-1050.
12. Sorensen K, Aksglaede L, Munch-Andersen T, Aachmann-Andersen NJ, Petersen JH, Hilsted L, Helge JW, Juul A. Sex hormone-binding globulin levels predict insulin sensitivity, disposition index, and cardiovascular risk during puberty. Diabetes Care 2009;32:909-914.
13. Akin F, Bastemir M, Alkis E, Kaptanoglu B. SHBG levels correlate with insulin resistance in postmenopausal women. Eur J Intern Med 2009;20:162-167.
14. Agirbasli M, Agaoglu NB, Orak N, Caglioz H, Ocek T, Poci N, Salaj A, Maya S. Sex hormones and metabolic syndrome in children and adolescents. Metabolism 2009;58:1256-1262.
15. Chubb SA, Hyde Z, Almeida OP, Flicker L, Norman PE, Jamrozik K, Hankey GJ, Yeap BB. Lower sex hormone-binding globulin is more strongly associated with metabolic syndrome than lower total testosterone in older
men: the Health in Men Study. Eur J Endocrinol 2008;158:785-792.
16. Weinberg ME, Manson JE, Buring JE, Cook NR, Seely EW, Ridker PM, Rexrode KM. Low sex hormone-binding globulin is associated with the metabolic syndrome in postmenopausal women. Metabolism 2006;55:1473-1480.
17. Laaksonen DE, Niskanen L, Punnonen K, Nyyssonen K, Tuomainen TP, Salonen R, Rauramaa R, Salonen JT. Sex hormones, inflammation and the metabolic syndrome: a population-based study. Eur J Endocrinol 2003;149:601-608.
18. Hajamor S, Despres JP, Couillard C, Lemieux S, Tremblay A, Prud'homme D, Tchernof A. Relationship between sex hormone-binding globulin levels and features of the metabolic syndrome. Metabolism 2003;52:724-730.
19. Bonnet F, Balkau B, Malecot JM, Picard P, Lange C, Fumeron F, Aubert R, Raverot V, Dechaud H, Tichet J, Lecomte P, Pugeat M. Sex hormone-binding globulin predicts the incidence of hyperglycemia in women: interactions with adiponectin levels. Eur J Endocrinol 2009;161:81-85. 20. Kalyani RR, Franco M, Dobs AS, Ouyang P, Vaidya D, Bertoni A, Gapstur SM,
Golden SH. The association of endogenous sex hormones, adiposity, and insulin resistance with incident diabetes in postmenopausal women. J Clin Endocrinol Metab 2009;94:4127-4135.
21. Ding EL, Song Y, Manson JE, Hunter DJ, Lee CC, Rifai N, Buring JE, Gaziano JM, Liu S. Sex hormone-binding globulin and risk of type 2 diabetes in women and men. N Engl J Med 2009;361:1152-1163.
22. Sutton-Tyrrell K, Wildman RP, Matthews KA, Chae C, Lasley BL, Brockwell
S, Pasternak RC, Lloyd-Jones D, Sowers MF, Torrens JI. Sex-hormone-binding globulin and the free androgen index are related to cardiovascular risk factors in multiethnic premenopausal and perimenopausal women enrolled in the Study of Women Across the Nation (SWAN). Circulation 2005;111:1242-1249.
23. Reinecke H, Bogdanski J, Woltering A, Breithardt G, Assmann G, Kerber S, von Eckardstein A. Relation of serum levels of sex hormone binding globulin to coronary heart disease in postmenopausal women. Am J Cardiol 2002;90:364-368.
24. Ouyang P, Vaidya D, Dobs A, Golden SH, Szklo M, Heckbert SR, Kopp P, Gapstur SM. Sex hormone levels and subclinical atherosclerosis in postmenopausal women: the Multi-Ethnic Study of Atherosclerosis. Atherosclerosis 2009;204:255-261.
25. Kalme T, Seppala M, Qiao Q, Koistinen R, Nissinen A, Harrela M, Loukovaara M, Leinonen P, Tuomilehto J. Sex hormone-binding globulin and insulin-like growth factor-binding protein-1 as indicators of metabolic syndrome, cardiovascular risk, and mortality in elderly men. J Clin Endocrinol Metab 2005;90:1550-1556.
26. Selva DM, Hogeveen KN, Innis SM, Hammond GL. Monosaccharide-induced lipogenesis regulates the human hepatic sex hormone-binding globulin gene. J Clin Invest 2007;117:3979-3987.
27. Selva DM, Hammond GL. Thyroid hormones act indirectly to increase sex hormone-binding globulin production by liver via hepatocyte nuclear factor-4α. J Mol Endocrinol 2009;43:19-27.
28. Dunning AM, Dowsett M, Healey CS, et al. Polymorphisms associated with circulating sex hormone levels in postmenopausal women. J Natl Cancer Inst 2004;96:936-945.
29. Haiman CA, Riley SE, Freedman ML, Setiawan VW, Conti DV, Le Marchand L. Common genetic variation in the sex steroid hormone-binding globulin (SHBG) gene and circulating shbg levels among postmenopausal women: the Multiethnic Cohort. J Clin Endocrinol Metab 2005;90:2198-2204.
30. Zhao JL, Chen ZJ, Zhao YR, et al. Study on the (TAAAA)n repeat polymorphism in sex hormone-binding globulin gene and the SHBG serum levels in putative association with the glucose metabolic status of Chinese patients suffering from polycystic ovarian syndrome in Shandong province. Zhonghua Yi Xue Yi Chuan Xue Za Zhi 2005;22:644-647. (In Chinese.) 31. Eriksson AL, Lorentzon M, Mellström D, et al. SHBG gene promoter
polymorphisms in men are associated with serum sex hormone-binding globulin, androgen and androgen metabolite levels, and hip bone mineral density. J Clin Endocrinol Metab 2006;91:5029-5037.
32. Cui Y, Shu XO, Cai Q, et al. Association of breast cancer risk with a common functional polymorphism (Asp327Asn) in the sex hormone-binding globulin gene. Cancer Epidemiol Biomarkers Prev 2005;14:1096-1101.
33. Berndt SI, Chatterjee N, Huang WY, et al. Variant in sex hormone-binding globulin gene and the risk of prostate cancer. Cancer Epidemiol Biomarkers Prev 2007;16:165-168.
34. Perry JR, Weedon MN, Langenberg C, Jackson AU, et al. Genetic evidence that raised sex hormone binding globulin (SHBG) levels reduce the risk of
type 2 diabetes. Hum Mol Genet 2010;19:535-544.
35. Vassilatou E, Lafoyianni S, Vryonidou A, Ioannidis D, Kosma L, Katsoulis K, Papavassiliou E, Tzavara I. Increased androgen bioavailability is associated with non-alcoholic fatty liver disease in women with polycystic ovary syndrome. Hum Reprod 2010;25:212-220.
36. Graffigna MN, Belli SH, de Larranaga G, Fainboim H, Estepo C, Peres S, Garcia N, Levalle O. [Insulin-like growth factor-binding protein-1: a new biochemical marker of nonalcoholic fatty liver disease?] Acta Gastroenterol Latinoam 2009;39:30-37.
37. Watanabe S, Yaginuma R, Ikejima K, Miyazaki A. Liver diseases and metabolic syndrome. J Gastroenterol 2008;43:509-518.
38. Yasui T, Tomita J, Miyatani Y, Yamada M, Uemura H, Irahara M, Arai M, Kojimahara N, Okabe R, Ishii Y, Tashiro S, Sato H. Associations of adiponectin with sex hormone-binding globulin levels in aging male and female populations. Clin Chim Acta 2007;386:69-75.
39. Janne M, Hammond GL. Hepatocyte nuclear factor-4 controls transcription from a TATA-less human sex hormone-binding globulin gene promoter. J Biol Chem 1998;273:34105-34114.
40. Mogilenko DA, Dizhe EB, Shavva VS, Lapikov IA, Orlov SV, Perevozchikov AP. Role of the nuclear receptors HNF-4α, PPARα, and LXRs in the TNF α-mediated inhibition of human apolipoprotein A-I gene expression in HepG2 cells. Biochemistry 2009;48:11950-11960.
41. Zhou Z, Kang X, Jiang Y, Song Z, Feng W, McClain CJ, Kang YJ. Presevation of hepatocyte nuclear factor-4α is associated with zinc protection against
TNF-α hepatotoxicity in mice. Exp Biol Med 2007;232:622-628.
42. Feldstein AE, Werneburg NW, Canbay A, Guicciardi ME, Bronk SF, Rydzewski R, Burgart LJ, Gores GJ. Free fatty acids promote hepatic lipotoxicity by stimulating TNF-α expression via a lysosomal pathway. Hepatology 2004;40:185-194.
43. Onat A, Hergenc G, Karabulut A, Albayrak S, Can G, Kaya Z. Serum sex hormone-binding globulin, a determinant of cardiometabolic disorders independent of abdominal obesity and insulin resistance in elderly men and women. Metabolism 2007;56:1356-1362.
44. Yasui T, Uemura H, Irahara M, Arai M, Kojimahara N, Okabe R, Ishii Y, Tashiro S, Sato H. Associations of endogenous sex hormones and sex hormone-binding globulin with lipid profiles in aged Japanese men and women. Clinica Chimica Acta 2008;398:43-47.
45. Miyaaki H, Ichikawa T, Nakao K, Yatsuhashi H, Furukawa R, Ohba K, Omagari K, Kusumoto Y, Yanagi K, Inoue O, Kinoshita N, Ishibashi H, Yano M, Eguchi K. Clinicopathological study of nonalcoholic fatty liver disease in Japan: the risk factors for fibrosis. Liver Int 2008;28:519-524.
46. Ding E, Song Y, Malik VS, Liu S. Sex differences of endogenous sex hormones and risk of type 2 diabetes. JAMA 2006;295:1288-1299.
47. de Ronde W, van der Schouw YT, Muller M, Grobbee DE, Gooren LJ, Pols HA, de Jong FH. Associations of sex-hormone-binding globulin (SHBG) with non-SHBG-bound levels of testosterone and estradiol in independently living men. J Clin Endocrinol Metab 2005;90:157-162.
48. Muller M, Grobbee D, den Tonkelaar I, Lamberts S, van der Schouw Y.
Endogenous sex hormones and metabolic syndrome in aging men. J Clin Endocrinol Metab 2005;90:2618-2623.
49. Ding EL, Song Y, Manson JE, Rifai N, Buring JE, Liu S. Plasma sex steroid hormones and risk of developing type 2 diabetes in women: a prospective study. Diabetologia 2007;50:2076-2084.
50. Hampl R, Kancheva R, Hill M, Bickova M, Vondra K. Interpretation of sex hormone-binding globulin levels in thyroid disorders. Thyroid 2003;13:755-760.
국문 요약
제2형 당뇨병 환자에서 성호르몬 결합 글로불린(sex
hormone-binding globulin)과 비알콜성 지방간질환의 연관성
비알콜성 지방간질환은 대사증후군, 제2형 당뇨병, 심혈관질환의 위험을 예견한다 고 보고되어 왔으며 간에서 대사증후군의 표현형으로 간주되고 있다. 성호르몬 결합 글로불린 [sex hormone-binding globulin (SHBG)]의 낮은 혈중 수치가 인슐린저항 성, 대사증후군, 제2형 당뇨병 및 심혈관질환과 유의한 상관관계를 가진다고 보고되 었다. 또한, 일부의 SHBG 유전자 다형성이 SHBG의 혈중 수치, 인슐린저항성 및 제 2형 당뇨병과 연관성이 알려져 있다. 본 연구는 제2형 당뇨병 환자에서 혈중 SHBG 수치와 비알콜성 지방간질환의 연관성을 조사하고, SHBG 유전자 다형성이 혈중의 SHBG 수치 및 비알콜성 지방간질환과의 상관관계를 알아보고자 한다. 279명의 제2형 당뇨병 환자가 본 연구에 참여하였고, 평균 나이는 57세였으며 55.2%가 남성이었다. 임상적, 생화학적 대사 지표들을 측정하였다. 지방간의 정도는 간 초음파를 이용하여 측정하였다. 성호르몬 (SHBG, 남성호르몬, 그리고 여성호르몬) 혈중 수치와 SHBG의 유전자 다형성을 조사하였다. SHBG 혈중 수치는 남자, 대사증후군이 있는 환자, 현성 지방간을 가진 환자에서 유의하게 낮았다. 지방간 정도가 심할수록 SHBG 혈중 수치는 유의하게 감소하였다. rs6259의 유전자변이 빈도는 21.8%였으나, rs6257과 rs179941의 유전자변이 빈도 는 0%였다. rs6259 유전자변이 유무에 SHBG의 혈중 수치는 차이가 없었고 현성 지방간과 유의한 상관성을 보이지 못했다. 나이 및 성별을 보정한 뒤, 혈중 SHBG는 고혈압, 대사증후군, 체질량지수, 허리둘레, 중성지방, 간효소, HOMA-IR 및 CRP 수 치와 유의한 음의 상관관계를 보였으며 남성호르몬 및 여성호르몬과는 양의 상관관계 - 45 -
를 보였다. 나이를 보정한 뒤에 남녀 모두에서 현성 지방간 유무에 대한 odds ratio (OR)가 SHBG 수치가 증가함에 따라 유의하게 감소하였다. 체질량지수, 허리둘레, 고혈압, 대사증후군, 중성지방, 간효소, CRP, HOMA-IR 및 성호르몬 수치를 보정한 뒤에도 OR은 유의하게 감소하였다. 또한, 시험관내 확인 실험으로 TNF-α로 전 처 치한 HepG2 세포에서 SHBG의 mRNA 및 단백질 발현이 감소하였다. 결론으로 남녀 모두에서 낮은 혈중 SHBG 수치가 제2형 당뇨병 환자에서 현성 지 방간과 유의한 연관성을 보여주었다. 이 연구 결과는 혈중 SHBG 수치가 비알콜성 지방간질환의 중등도를 평가하는데 보조적인 표지자로 이용될 가능성을 시사한다. 핵심되는 말: 성호르몬 결합 글로불린, 비알콜성 지방간질환, 유전자 다형성, 제2형 당뇨병 - 46 -