ABSTRACT
Purpose: The microstructural characteristics of trabecular bone were identified using micro-computed tomography (micro-CT), in order to develop a potential strategy for implant surface improvement to facilitate osseointegration.
Methods: Alveolar bone specimens from the cadavers of 30 humans were scanned by high-resolution micro-CT and reconstructed. Volumes of interest chosen within the jaw were classified according to Hounsfield units into 4 bone quality categories. Several structural parameters were measured and statistically analyzed.
Results: Alveolar bone specimens with D1 bone quality had significantly higher values for all structural parameters than the other bone quality categories, except for trabecular thickness (Tb.Th). The percentage of bone volume, trabecular separation (Tb.Sp), and trabecular number (Tb.N) varied significantly among bone quality categories. Tb.Sp varied markedly across the bone quality categories (D1: 0.59±0.22 mm, D4: 1.20±0.48 mm), whereas Tb.Th had similar values (D1: 0.30±0.08 mm, D4: 0.22±0.05 mm).
Conclusions: Bone quality depended on Tb.Sp and number—that is, endosteal space architecture—rather than bone surface and Tb.Th. Regardless of bone quality, Tb.Th showed little variation. These factors should be taken into account when developing individualized implant surface topographies.
Keywords: Cadaver; Dental implants; X-ray microtomography
INTRODUCTION
The term “bone quality” is commonly used in implant treatment planning, and is one of the most critical predictors of successful osseointegration, which leads to the long-term success of an implant treatment. Many studies have confirmed a direct correlation between bone quality and implant success rate [1,2]. Bone quality is not simply synonymous with bone mineral density; it also encompasses other factors, including bone mass, structural properties such as macro- and micro-level architecture, and matrix properties such as modulus of elasticity and mineral density [3]. In other words, bone quality is not only a
Research Article
Received: Nov 22, 2016 Accepted: Jan 24, 2017 *Correspondence: Jeong-Ho Yun
Department of Periodontology, Chonbuk National University School of Dentistry, 567 Baekje-daero, Deokjin-gu, Jeonju 54896, Korea.
E-mail: grayheron@hanmail.net Tel: +82-63-250-2289 Fax: +82-63-250-2289
Copyright © 2017. Korean Academy of Periodontology
This is an Open Access article distributed under the terms of the Creative Commons Attribution Non-Commercial License (https:// creativecommons.org/licenses/by-nc/4.0). ORCID Ji-Hyun Lee http://orcid.org/0000-0002-8937-4011 Hee-Jin Kim http://orcid.org/0000-0002-1139-6261 Jeong-Ho Yun http://orcid.org/0000-0003-3929-4467 Funding
This work was supported by the Technology Innovation Program (10049237) funded by the Ministry of Trade, Industry & Energy (MOTIE, Korea).
Author Contributions
Conceptualization: Ji-Hyun Lee, Jeong-Ho Yun; Data curation: Ji-Hyun Lee, Hee-Jin Kim, Jeong-Ho Yun; Formal analysis: Ji-Hyun Lee, Jeong-Ho Yun; Funding acquisition: Jeong-Ho
Ji-Hyun Lee1, Hee-Jin Kim2, Jeong-Ho Yun1,3,*
1 Department of Periodontology, Chonbuk National University School of Dentistry, Jeonju, Korea 2 Division in Anatomy and Developmental Biology, Department of Oral Biology, BK21 PLUS Project, Human
Identification Research Center, Yonsei University College of Dentistry, Seoul, Korea
3 Research Institute of Clinical Medicine of Chonbuk National University-Biomedical Research Institute of Chonbuk National University Hospital, Jeonju, Korea
Three-dimensional microstructure of
human alveolar trabecular bone: a
micro-computed tomography study
Yun; Investigation: Ji-Hyun Lee, Hee-Jin Kim, Jeong-Ho Yun; Methodology: Hee-Jin Kim, Jeong-Ho Yun; Writing - original draft: Ji-Hyun Lee; Writing - review & editing: Ji-Hyun Lee, Hee-Jin Kim, Jeong-Ho Yun.
Conflict of Interest
No potential conflict of interest relevant to this article was reported.
matter of mineral content, but also of structure. Among the constituents of alveolar bone, cortical bone is considered very important because of its stiffness, which affects primary stability. However, cancellous bone has the capacity to bear a functional load and is part of the bone-to-implant interface. The evaluation of trabecular bone micro-architecture could potentially allow predictions of the outcomes of implant treatment and further improvements in implant surface topography.
Due to the importance of bone quality in the attainment and maintenance of osseointegration, many attempts have been made to establish a system to assess bone quality and predict the prognosis of procedures [4-6]. The clinical assessment of bone quality is performed during implant fixture installation surgery and relies on cutting resistance while drilling and placing fixtures. However, this cannot be considered an objective measurement, and can only be performed intraoperatively. Histologic and histomorphometric analyses are gold standards in bone quality assessment [7], but have limited clinical applications due to cost and time, as well as innate errors caused by shrinkage and distortion of the specimen that can occur during tissue processing [8]. Another gold standard in bone quality assessment is micro-computed tomography (micro-CT), especially for the evaluation of bone morphology and micro-architecture [9,10]. Micro-CT can be used to access bone quality in 3 dimensions [11], allowing objective and quantitative evaluations of the structure of trabecular bone.
A number of studies have examined trabecular bone quality using micro-CT [3,12,13]. These studies have demonstrated the value of micro-CT in bone architecture evaluation and revealed substantial variation in architecture according to anatomical location and among patients. However, guidelines regarding how to utilize the information obtained from micro-CT studies in clinical applications have yet to be suggested. The present study was designed to evaluate trabecular bone quality, to categorize the bone quality according to an existing bone quality classification scheme, and to investigate the characteristics of trabecular bone architecture according to bone quality.
A high degree of porosity in the implant surface topography has been known to prompt osseointegration [14], but insufficient information has been obtained regarding the most favorable porosity for osseointegration. Therefore, we hypothesized that a trabecular structure of the implant surface similar to that of an individual patient's trabecular bone would enhance osseointegration. The structural parameter values obtained on micro-CT scans can be utilized to devise a potential strategy for implant surface improvement to facilitate osseointegration. The present study aimed to investigate the structural characteristics of trabecular bone using micro-CT, in order to take an initial step in the process of proving this hypothesis correct.
MATERIALS AND METHODS
Study design and specimen selection
Twenty hemimaxillae from 10 fixed Korean cadavers (8 males, 2 females; age range, 67–96 years; average age, 75.7 years) were used in this study. Forty hemimandibles from another 20 Korean cadavers (with no information available regarding the donors' age, gender, or medical history) were also included in this study. The cadavers were fixed in 10% neutralized buffered formalin. The study protocol was approved by the ethics committee of Yonsei Medical Center, Korea.
Three-dimensional analysis using micro-CT
Specimens were scanned and reconstructed into 3-dimensional (3D) structures using a micro-CT system (Skyscan 1076, Skyscan, Antwerp, Belgium). The exposure conditions were 100 kV, 100 µA, 1.0-mm-thick aluminum filtration, and a pixel size of 35 µm. The data were digitized by a frame grabber and transmitted to a computer for processing with tomographic reconstruction software (N-recon, Skyscan). Projection image data were reconstructed to create 3D images and analyzed using coupled software (CT-Analyzer, Skyscan).
The reconstructed images from a micro-CT scan were grayscale images in which the pixel intensity ranged from 0 (black) to 255 (white). The grayscale images were then converted into Hounsfield units (HU) as described by LeBrun et al. [15]. HU, a standard unit of measurement for CT imaging systems to describe the radiodensity of a material, were calculated as follows:
where GS is the grayscale value of the tested specimen, the water sample, or the air.
Deionized water was included with each scan as a reference material to normalize the data to the HU scale and to maintain consistency throughout all scans.
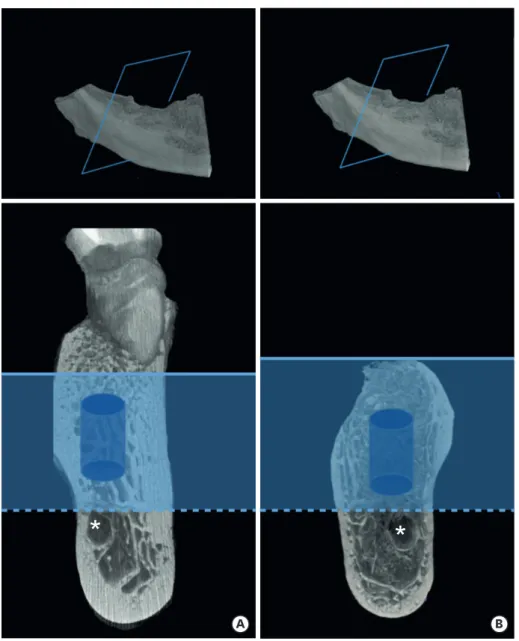
The anatomical locations examined were classified as follows: maxillary anterior region (XA), maxillary posterior region (XP), mandibular anterior region (NA), and mandibular posterior region (NP). A volume of interest (VOI) with a cylindrical shape was measured in all regions. All VOIs were located apical to the lateral incisor or the first molar of either the maxilla or mandible and bounded within cancellous bone below the maxillary sinus floor and above the upper border of the mandibular canal. In specimens without remaining teeth, the VOI was drawn under cortical bone (Figure 1). Specimens for which it was not possible to determine VOIs due to severe alveolar bone resorption were excluded.
Each VOI was processed and classified according to its HU value into 1 of 4 categories of bone quality. When the HU value was between 1,200 and 1,900, the VOI was classified into the D1 category, while HU values of 700–1,200 corresponded to the D2 category, 350–700 to the D3 category, and <350 to the D4 category [16].
Selection of structural parameters and statistical analyses
Various parameters were measured and calculated for each VOI as described in Table 1. The mean value and standard deviation of each parameter were calculated according to the bone quality category (D1, D2, D3, and D4). Data were checked for normality using the Shapiro-Wilk test [17,18] and the visual inspection of histograms, normal Q-Q plots, and box plots. When the data satisfied equality of variance and normality, 1-way analysis of variance was employed to evaluate whether there were significant differences according to bone density, using SPSS 12.0 (SPSS Inc., Chicago, IL, USA). To adjust for multiple comparisons, the Bonferroni post hoc test was used. Significance was determined at a P-value of 0.05. If the data did not pass the normality test, non-parametric tests, such as the Kruskal-Wallis and Mann-Whitney tests, were used. Correlation analyses were also performed to determine interrelations among parameters.
HU = −1,000 × GS − GSwater GSair− GSwater
A
*
*
B
Figure 1. VOI selection. (A) When the tooth (lateral incisor or first molar) remains in the maxilla or mandible, its VOI is located below the maxillary sinus (not shown) or above the mandibular canal (*) and apical to its root apex (solid line). (B) When no tooth remains in the jaw, the VOI is drawn under the coronal cortical bone (solid line). The VOI (blue cylinder) is then bounded within the trabecular bone.
VOI, volume of interest Table 1. Structural parameters
Parameters Unit Description
BV mm3 TV of trabeculae within the VOI
BV/TV % Proportion of the VOI occupied by trabeculae
BS mm2 Surface of trabeculae
BS/BV mm-1 Ratio of trabecular surface to volume
Basis of estimates of thickness
BS/TV mm-1 Ratio of trabecular surface area to total volume
Tb.Th mm Average of the local thickness
Tb.Sp mm Thickness of the spaces
Tb.N mm-1 Density of the trabeculae within the VOI
BV, bone volume; TV, total volume; VOI, volume of interest; BV/TV, bone volume density; BS, bone surface; BS/ BV, bone-specific surface; BS/TV, bone surface density; Tb.Th, trabecular thickness; Tb.Sp, trabecular separation; Tb.N, trabecular number.
RESULTS
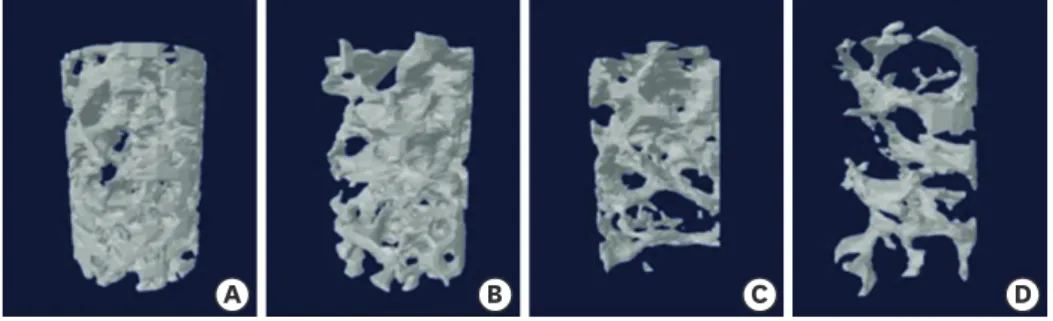
A total of 116 specimens were evaluated as part of the analysis of the microstructural characteristics of trabecular bone in human cadavers. When cancellous bone density was classified according to HU, 28 of the 116 specimens had bone quality of D1, while 29, 36, and 23 specimens had D2, D3, and D4 bone quality, respectively. Representative images of the 4 bone quality categories are presented in Figure 2. A total of 20, 19, 37, and 40 VOIs were drawn in the XA, XP, NA, and NP regions, respectively. In the NA region, VOIs measuring 2.98 mm in diameter and 4.97 mm in height were collected. In the other 3 regions, the VOI was 3.55 mm in diameter and 4.97 mm in height. The numbers and sizes of the selected VOIs are presented in Table 2.
Microstructural data according to bone quality category
Images obtained through 3D reconstruction of micro-CT scanning data showed distinct differences in the microarchitecture of the trabecular bone cores (Figure 2). Microstructural data for the D1, D2, D3, and D4 bone quality categories are listed in Table 3. Bone volume density (BV/TV), which is defined as the ratio of the trabecular bone volume to the total volume of the specimen core, decreased from the D1 to D4 bone quality categories and showed statistically significant differences in this parameter among all bone quality categories, despite the wide variation throughout the bone quality categories. Bone surface also tended to decrease from D1 to D4, and the same pattern was observed for bone surface density (BS/TV), which was obtained by dividing bone surface by total volume. However, bone-specific surface (BS/BV) showed an inverse relation to BS/TV, which can be attributed to the greater volume in the D1 bone quality category and the smaller volume in the D4 bone quality category. Trabecular thickness (Tb.Th), trabecular separation (Tb.Sp), and trabecular number (Tb.N) provide quantitative information about trabecular microarchitecture. Tb.N was calculated by averaging the number of trabeculae in a given 1 mm diameter sphere, and
A B C D
Figure 2. Three-dimensional images of representative cancellous bone cores. Cancellous bone density is classified into 4 categories based on HU. Thirty of the 116 specimens were classified as having D1 bone quality (A), while 8, 21, and 57 specimens had D2 (B), D3 (C), and D4 (D) bone quality, respectively.
HU, Hounsfield units.
Table 2. Number and size of selected VOIs
Region No. VOI (mm) TV (mm3) TS (mm2)
XA 20 Ø 3.55×h 4.974 48.31 77.80
XP 19 Ø 3.55×h 4.974 48.31 77.80
NA 37 Ø 2.98×h 4.974 33.34 62.57
NP 40 Ø 3.55×h 4.974 48.31 77.80
VOI, volume of interest in a cylindrical shape, the size of which is a diameter (Ø) and a height (h); TV, total volume; TS, total surface; XA, maxillary anterior region; XP, maxillary posterior region; NA, mandibular anterior region; NP, mandibular posterior region.
differed significantly among the 4 bone quality categories. In contrast, Tb.Th was similar among the 4 bone quality categories. An inverse relationship was found between Th.N and Tb.Sp, because D1 bone had the least separation, whereas D4 bone had the most separation. Tb.Sp also differed significantly among all bone quality categories.
Correlations among structural parameters
The correlations among structural parameters are shown in Table 4. Statistically significant correlations were found among all structural parameters. BV/TV was strongly correlated with all other parameters. However, Tb.Th had a relatively weak correlation with Tb.Sp (r=−0.450), Tb.N (r=0.493), and BS/TV (r=0.469). BS/TV was also weakly correlated with BS/ BV. BS/BV showed a relatively weak correlation with Tb.Sp (r=0.689) and Tb.N (r=−0.633), but a strong correlation with Tb.Th (r=−0.851), whereas BS/TV was strongly correlated with Tb.Sp (r=−0.828) and Tb.N (r=0.985), but relatively weakly correlated with Tb.Th (r=0.469).
DISCUSSION
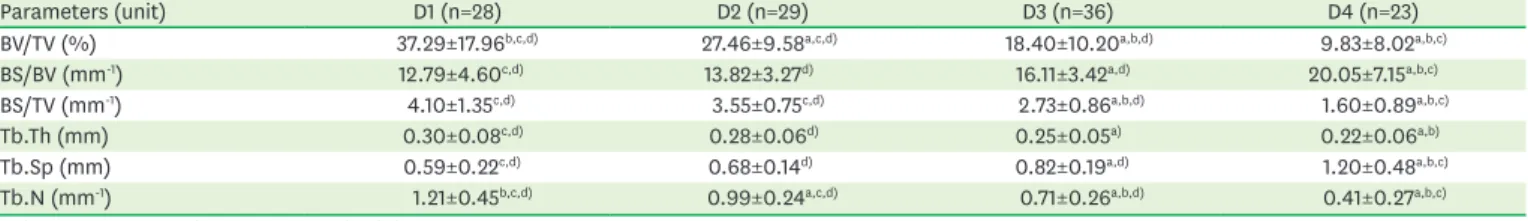
Successful osseointegration stems from sound construction and maintenance of the bone-to-implant interface [19]. Cortical bone has been emphasized in fixture installation because it allows primary implant stability to be achieved, but it is trabecular bone that plays a crucial role in determining the fate of osseointegration and the formation of a strong Table 3. Measurement of structural parameters according to bone density
Parameters (unit) D1 (n=28) D2 (n=29) D3 (n=36) D4 (n=23)
BV/TV (%) 37.29±17.96b,c,d) 27.46±9.58a,c,d) 18.40±10.20a,b,d) 9.83±8.02a,b,c)
BS/BV (mm-1) 12.79±4.60c,d) 13.82±3.27d) 16.11±3.42a,d) 20.05±7.15a,b,c)
BS/TV (mm-1) 4.10±1.35c,d) 3.55±0.75c,d) 2.73±0.86a,b,d) 1.60±0.89a,b,c)
Tb.Th (mm) 0.30±0.08c,d) 0.28±0.06d) 0.25±0.05a) 0.22±0.06a,b)
Tb.Sp (mm) 0.59±0.22c,d) 0.68±0.14d) 0.82±0.19a,d) 1.20±0.48a,b,c)
Tb.N (mm-1) 1.21±0.45b,c,d) 0.99±0.24a,c,d) 0.71±0.26a,b,d) 0.41±0.27a,b,c)
Values are presented as mean±standard deviation.
n, number of volumes of interest; BV/TV, bone volume density; BS/BV, bone-specific surface; BS/TV, bone surface density; Tb.Th, trabecular thickness; Tb.Sp, trabecular separation; Tb.N, trabecular number.
a)Statistically significant difference compared to D1 (P<0.05); b)Statistically significant difference compared to D2 (P<0.05); c)Statistically significant difference
compared to D3 (P<0.05); d)Statistically significant difference compared to D4 (P<0.05).
Table 4. Correlations among structural parameters
Parameters HU BV/TV BS/BV BS/TV Tb.Th Tb.Sp Tb.N HU Pearson correlation 1.000 0.616a) −0.496a) 0.596a) 0.446a) −0.558a) 0.610a) P value 0.000 0.000 0.000 0.000 0.000 0.000 BV/TV Pearson correlation 1.000 −0.754a) 0.878a) 0.769a) −0.716a) 0.913a) P value 0.000 0.000 0.000 0.000 0.000 BS/BV Pearson correlation 1.000 −0.618a) −0.851a) 0.689a) −0.633a) P value 0.000 0.000 0.000 0.000 BS/TV Pearson correlation 1.000 0.469a) −0.828a) 0.985a) P value 0.000 0.000 0.000 Tb.Th Pearson correlation 1.000 −0.450a) 0.493a) P value 0.000 0.000 Tb.Sp Pearson correlation 1.000 −0.793a) P value 0.000 Tb.N Pearson correlation 1.000 P value
HU, Hounsfield units; BV/TV, bone volume density; BS/BV, bone-specific surface; BS/TV, bone surface density; Tb.Th, trabecular thickness; Tb.Sp, trabecular separation; Tb.N, trabecular number.
bone-to-implant interface, because the bone-to-implant interface is mainly formed through trabecular bone within alveolar bone. Therefore, trabecular bone architecture should be investigated at the microstructural level to obtain objective and detailed qualitative and quantitative information regarding alveolar bone quality.
Many studies have investigated trabecular microstructure, but only a few have been conducted on human alveolar bone because high-resolution tomography in the form of micro-CT is not routinely applied in practice. Fanuscu and Chang [3] reported material properties specific to the maxillae and mandibles and their anatomical locations, but the specimens they evaluated were harvested from a single cadaver only, and therefore did not reflect the variation present in human alveolar bone architecture. Kim et al. [20] performed a comprehensive study of specific jaw bone sites using a large sample. They presented 3D microstructural data according to the anatomical location in the jaw, but did not provide guidelines for how to use this data clinically. The current study was designed to analyze human cadaveric trabecular bone using 3D morphometric data obtained from micro-CT scans, and to correlate this with bone density measurements in HU, with the goal of developing guidelines for how microstructural data can be applied in clinical implantology. To date, bone classification schemes have only allowed rough, subjective, preoperative assessments. Norton and Gamble [21] conducted an extensive analysis of computerized tomography scans and demonstrated that an objective scale of bone density based on the Hounsfield scale can be established, and that there was a strong correlation between bone density values and subjective quality scores. Based on this finding, the postmortem specimens in the present study were classified according to Hounsfield values, and their microstructural parameters were analyzed and compared. There was general agreement between bone density based on the Hounsfield scale and bone mass indices of micro-CT (BV/TV and Tb.N), even though values from these analyses did not precisely correspond with bone quality. In other words, bone mass based on BV/TV and Tb.N was significantly higher in the D1 bone quality category than in the other 3 bone quality categories. The opposite tendency was noted for BS/ BV, which reflected the complexity of the structure. To be specific, D4 bone had the highest BS/BV value, whereas D1 bone had the lowest BS/BV value. BS/BV showed a close correlation (r=0.689) with the Tb.Sp value, which was highest in D4 bone and lowest in D1 bone. These findings clearly indicate that the microarchitecture of D1 bone was more favorable for implant placement and the achievement of excellent osseointegration than D2–D4 bone, regardless of the presence of cortical bone. The only parameter that did not show a significant difference among bone quality categories was Tb.Th, although it tended to decrease in value from D1 through D4 bone. The Tb.Th values corresponded to those reported in previous studies [3,20]. Since the stiffness of trabecular bone is known to be proportional to both BV and Tb.Th [11,22], the mechanical competence of D1 bone is more dependent on bone volume than Tb.Th. Osseointegration occurs through 2 mechanisms: contact osteogenesis and distance osteogenesis. One of the factors prompting osteogenesis on the implant surface is the implant surface topography [23]. The implant surface serves as a template for the regeneration of mature bone [22], thereby creating a strong bone-to-implant interface that can withstand mechanical loads. The diameter of a bone substitute pore system should be close to the diameter of the framework of trabecular bone [24]. In the context of implant surface development, an understanding of trabecular bone microstructure in human alveolar bone is necessary to further advance implant design, particularly implant surface topography. To design macro-features of the implant surface that reflect the microstructure of the
surrounding trabecular bone, data regarding Tb.Th and Tb.Sp, which provide information about the shape and geography of the implant surface, should be considered.
D1 bone had a Tb.Sp value of 0.59±0.22 mm (Table 3), which is close to the known pore size of bone substitute or implant materials that favor bone regeneration [25,26]. Taniguchi et al. [26] implanted 3 porous titanium implants with different pore sizes (300, 600, and 900 µm) and constant porosity into rabbit tibia. The implant with a pore size of 600 µm demonstrated significantly greater fixation at 2 weeks than the other implants, implying that its pore size was optimal for promoting osseointegration. BS/BV was the greatest in the D4 bone quality category (20.05±7.15 mm-1), but in reality, a longer healing time is usually required in D4 bone
to achieve osseointegration sufficient to withstand occlusal loading. Assuming the presence of the same structure with a different pore size, the average curvature of the pore becomes higher in inverse proportion to pore size [27]. With respect to curvature, the large Tb.Sp in D4 bone indicates an unfavorable curvature pattern for bone tissue amplification. Based on this result, we propose that implant surface macrostructure matching the cancellous bone struts of D1 bone quality may provide a negative template for cancellous bone replacement of the same quality, which would enhance the regeneration of structurally equivalent trabecular bone of D1 bone quality onto the implant surface, even in poor-quality alveolar bone. Some potential problems should be acknowledged. To guarantee sufficient thickness of the porous structure on the dental implant fixture, the diameter of the core material needs to be reduced, which could compromise its mechanical properties. Another concern is that an open porous design could jeopardize treatment, including the removal of biofilm and detoxification of the implant surface when it is exposed to the oral cavity or is involved in peri-implantitis. The present study examined postmortem human jawbones extensively to obtain structural information about trabecular bone from micro-CT scans and to reconstruct and characterize bone quality. Measurable quantitative differences were present in structural parameters according to bone quality, despite the high degree of variation within bone quality categories, and all parameters showed statistically significant correlations with each other. This large-scale investigation provides general information regarding the trabecular microarchitecture of human alveolar bone, which should facilitate improvements in clinical implantology; specifically, the construction of implant surfaces as negative frameworks for trabecular bone growth. Future studies should evaluate the hypothesis proposed here in an in vivo model and address the acknowledged potential problems.
REFERENCES
1. Jemt T, Lekholm U. Oral implant treatment in posterior partially edentulous jaws: a 5-year follow-up report. Int J Oral Maxillofac Implants 1993;8:635-40.
PUBMED
2. Drago CJ. Rates of osseointegration of dental implants with regard to anatomical location. J Prosthodont 1992;1:29-31.
PUBMED | CROSSREF
3. Fanuscu MI, Chang TL. Three-dimensional morphometric analysis of human cadaver bone: microstructural data from maxilla and mandible. Clin Oral Implants Res 2004;15:213-8.
PUBMED | CROSSREF
4. Brånemark PI, Zarb GA, Albrektsson T. Tissue-integrated prostheses: osseointegration in clinical dentistry. Chicago (IL): Quintessence; 1985.
5. Jensen O. Site classification for the osseointegrated implant. J Prosthet Dent 1989;61:228-34.
6. Misch CE. Contemporary implant dentistry. St. Louis (MO): Mosby; 1993.
7. Kim YJ, Henkin J. Micro-computed tomography assessment of human alveolar bone: bone density and three-dimensional micro-architecture. Clin Implant Dent Relat Res 2015;17:307-13.
PUBMED | CROSSREF
8. Park YS, Kim S, Oh SH, Park HJ, Lee S, Kim TI, et al. Comparison of alveolar ridge preservation methods using three-dimensional micro-computed tomographic analysis and two-dimensional histometric evaluation. Imaging Sci Dent 2014;44:143-8.
PUBMED | CROSSREF
9. Burghardt AJ, Link TM, Majumdar S. High-resolution computed tomography for clinical imaging of bone microarchitecture. Clin Orthop Relat Res 2011;469:2179-93.
PUBMED | CROSSREF
10. Ibrahim N, Parsa A, Hassan B, van der Stelt P, Wismeijer D. Diagnostic imaging of trabecular bone microstructure for oral implants: a literature review. Dentomaxillofac Radiol 2013;42:20120075.
PUBMED | CROSSREF
11. Ulrich D, van Rietbergen B, Laib A, Rüegsegger P. The ability of three-dimensional structural indices to reflect mechanical aspects of trabecular bone. Bone 1999;25:55-60.
PUBMED | CROSSREF
12. Moon HS, Won YY, Kim KD, Ruprecht A, Kim HJ, Kook HK, et al. The three-dimensional microstructure of the trabecular bone in the mandible. Surg Radiol Anat 2004;26:466-73.
PUBMED | CROSSREF
13. Sugisaki M, Agematsu H, Matsunaga S, Saka H, Sakiyama K, Ide Y. Three-dimensional analysis of the internal structure of the mandibular condyle in dentulous and edentulous jaws using micro-CT. Cranio 2009;27:78-87.
PUBMED | CROSSREF
14. Xue W, Krishna BV, Bandyopadhyay A, Bose S. Processing and biocompatibility evaluation of laser processed porous titanium. Acta Biomater 2007;3:1007-18.
PUBMED | CROSSREF
15. LeBrun A, Joglekar T, Bieberich C, Ma R, Zhu L. Identification of infusion strategy for achieving repeatable nanoparticle distribution and quantification of thermal dosage using micro-CT Hounsfield unit in magnetic nanoparticle hyperthermia. Int J Hyperthermia 2016;32:132-43.
PUBMED | CROSSREF
16. Todisco M, Trisi P. Bone mineral density and bone histomorphometry are statistically related. Int J Oral Maxillofac Implants 2005;20:898-904.
PUBMED
17. Razali NM, Wah YB. Power comparisons of shapiro-wilk, kolmogorov-smirnov, lilliefors and anderson-darling tests. J Stat Model Anal 2011;2:21-33.
18. Shapiro SS, Wilk MB. An analysis of variance test for normality (complete samples). Biometrika 1965;52:591-611.
CROSSREF
19. Puleo DA, Nanci A. Understanding and controlling the bone-implant interface. Biomaterials 1999;20:2311-21.
PUBMED | CROSSREF
20. Kim JE, Shin JM, Oh SO, Yi WJ, Heo MS, Lee SS, et al. The three-dimensional microstructure of trabecular bone: analysis of site-specific variation in the human jaw bone. Imaging Sci Dent 2013;43:227-33.
PUBMED | CROSSREF
21. Norton MR, Gamble C. Bone classification: an objective scale of bone density using the computerized tomography scan. Clin Oral Implants Res 2001;12:79-84.
PUBMED | CROSSREF
22. Borden M, Attawia M, Khan Y, Laurencin CT. Tissue engineered microsphere-based matrices for bone repair: design and evaluation. Biomaterials 2002;23:551-9.
PUBMED | CROSSREF
23. Le Guéhennec L, Soueidan A, Layrolle P, Amouriq Y. Surface treatments of titanium dental implants for rapid osseointegration. Dent Mater 2007;23:844-54.
PUBMED | CROSSREF
24. Jiang Y, Zhao J, Augat P, Ouyang X, Lu Y, Majumdar S, et al. Trabecular bone mineral and calculated structure of human bone specimens scanned by peripheral quantitative computed tomography: relation to biomechanical properties. J Bone Miner Res 1998;13:1783-90.
25. Pallesen L, Schou S, Aaboe M, Hjørting-Hansen E, Nattestad A, Melsen F. Influence of particle size of autogenous bone grafts on the early stages of bone regeneration: a histologic and stereologic study in rabbit calvarium. Int J Oral Maxillofac Implants 2002;17:498-506.
PUBMED
26. Taniguchi N, Fujibayashi S, Takemoto M, Sasaki K, Otsuki B, Nakamura T, et al. Effect of pore size on bone ingrowth into porous titanium implants fabricated by additive manufacturing: an in vivo
experiment. Mater Sci Eng C Mater Biol Appl 2016;59:690-701.
PUBMED | CROSSREF
27. Zadpoor AA. Bone tissue regeneration: the role of scaffold geometry. Biomater Sci 2015;3:231-45.