주간 건강과 질병•제14권 제8호(2021. 2. 18.) www.kdca.go.kr
429 만성질환 통계
1. 영양소 섭취기준에 대한 섭취비율, 2019
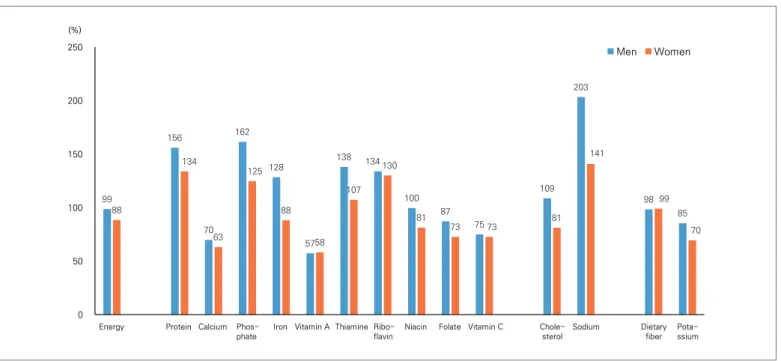
◈ 영양소별 영양소 섭취기준에 대한 섭취비율(만 1세 이상)을 살펴보면, 2019년 기준으로 에너지는 필요추정량 대비 남자 99%, 여자가 88% 섭취하는 것으로 나타났으며, 단백질은 남자가 156%, 여자가 134%로 권장섭취량보다 더 많이 섭취하는 것으로 나타났음. 남자의 나트륨 섭취비율은 203%로 목표섭취량의 2배 이상 섭취하고 있었음. 반면 비타민A, 칼슘, 비타민C는 다른 영양소에 비해 권장섭취량 대비 비율이 낮아 부족하게 섭취하고 있는 것으로 나타남(그림 1). * 영양소 섭취기준에 대한 섭취비율: 영양소 섭취기준에 대한 개인별 영양소 섭취량 백분율의 평균값, 만 1세 이상(나트륨 9세 이상, 콜레스테롤 19세 이상) † 영양소 섭취기준: 2015 한국인 영양소 섭취기준(보건복지부, 2015); 에너지, 필요추정량; 단백질 등, 권장섭취량; 나트륨, 콜레스테롤, 목표섭취량; 식이섬유, 칼륨, 충분섭취량 99 156 70 162 128 57 138 134 100 87 75 109 203 98 85 88 134 63 125 88 58 107 130 81 73 73 81 141 99 70 0 50 100 150 200 250 에너지 단백질 칼슘 인 철 비타민A 티아민 리보플라빈 나이아신 엽산 비타민C 콜레스테롤 나트륨 식이섬유 칼륨 남자 여자 그림 1. 영양소별 영양소 섭취기준에 대한 섭취비율, 2019주간 건강과 질병•제14권 제8호(2021. 2. 18.) www.kdca.go.kr
430
2. 하루 과일, 채소 500g 이상 섭취자 분율 추이, 1998∼2019
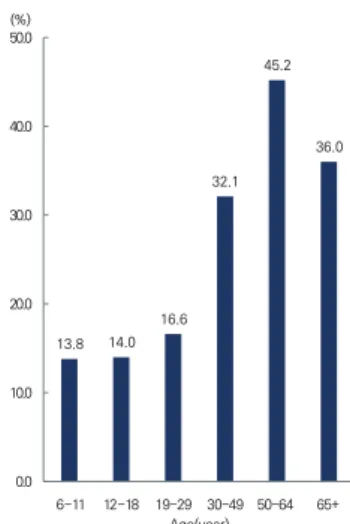
◈ 만 6세 이상에서 하루 과일, 채소 500g 이상 섭취자 분율(연령표준화)은 1998년 39.9%에서 2019년 28.1%로 11.8%p 감소하였음(그림 2). 2019년 기준 남자가 31.1%로 여자(25.1%)보다 높았으며, 연령별로는 50∼64세(45.2%)에서 가장 높았음. 반면 6~29세는 20% 미만으로 낮은 경향임(그림 3). 39.9 42.1 30.0 35.7 35.0 35.4 37.8 36.5 35.8 35.6 38.2 38.6 33.1 31.4 26.2 28.1 41.5 42.2 33.7 38.4 36.9 38.2 40.9 39.8 39.0 37.2 39.9 41.2 36.7 34.4 29.7 31.1 38.6 42.0 26.3 33.4 33.1 32.6 34.8 33.3 32.634.3 36.6 35.9 29.6 28.2 22.7 25.1 0 5 10 15 20 25 30 35 40 45 50 1998 2001 2005 2007 2008 2009 2010 2011 2012 2013 2014 2015 2016 2017 2018 2019 전체 남자 여자 (%) 조사연도 그림 2. 하루 과일, 채소 500g 이상 섭취자 분율 추이, 1998∼2019 13.8 14.0 16.6 32.1 45.2 36.0 0 10 20 30 40 50 6-11 12-18 19-29 30-49 50-64 65+ (%) 연령(세) 그림 3. 연령별 하루 과일, 채소 500g 이상 섭취자 분율, 2019 * 하루 과일, 채소 500g 이상 섭취자 분율: 1일 과일 및 채소 섭취량이 500g 이상인 분율, 만 6세이상 † 그림2의 연도별 지표값은 2005년 추계인구로 연령표준화 출처 : 2019년 국민건강통계, http://knhanes.kdca.go.kr/ 작성부서 : 질병관리청 만성질환관리국 건강영양조사분석과주간 건강과 질병•제14권 제8호(2021. 2. 18.)
www.kdca.go.kr
431 Noncommunicable Disease (NCD) Statistics
1. The Ratio of Nutrient Intake to Dietary Reference Intakes (DRI) by Nutrient,
2019
◈ As of 2019, according to the ratio of nutrient intake to Dietary Reference Intakes (DRI) by nutrients (age 1 and over), men consumed
99% of the estimated energy requirement and women consumed 88%. The ratios of protein were found to be 156% more consumed by men and 134% by women than the recommended nutrient intake. Men consumed 203% of the sodium intake goal, which was more than twice the intake goal. While, the ratio of intake the Dietary Reference Intakes (DRI) of Vitamin A, calcium, and Vitamin C were lower then that of other nutrients and they were consuming insufficiently (Figure 1).
* The ratio of nutrient intake to Dietary Reference Intakes (DRI) by nutrient: Average value of the percentage of nutrient intake per person for the standard of nutrient intake (aged 1 and over), sodium (aged 9 and over), cholesterol (aged 19 year and over)
† Dietary Reference Intakes: Dietary Reference Intakes for Koreans 2015 (Ministry of Health and Welfare, 2015); energy, estimated energy requirement; protein et al, recommended nutrient intake; sodium, cholesterol, intake goal; dietary fiber, potassium, adequate intake
99 156 70 162 128 57 138 134 100 87 75 109 203 98 85 88 134 63 125 88 58 107 130 81 73 73 81 141 99 70 0 50 100 150 200 250
Energy Protein Calcium
Phos-phate Iron Vitamin A Thiamine Ribo-flavin Niacin Folate Vitamin C Chole-sterol Sodium Dietaryfiber Pota-ssium
Men Women
(%)
주간 건강과 질병•제14권 제8호(2021. 2. 18.)
www.kdca.go.kr
432
2. Trends in intake of beverages, 1998-2019
◈ The proportion of consuming more than 500g of vegetables and fruits per day (age standardization) among those aged 6 and over
decreased by 11.8%p from 39.9% in 1998 to 28.1% in 2019 (Figure 2). As of 2019, in terms of the proportion of consuming more than 500g of vegetables and fruits per day, men (31.1%) was higher than women (25.1%) and the highest proportions were found among those aged 50-64 (45.2%). While, The proportion of consuming more than 500g of vegetables and fruits per day (age standardization) among those aged 6-29 years was less then 20% (Figure 3).
* Daily intake of more than 500g of vegetables and fruits: daily intake of fruits and vegetables was 500g or more among those aged 6 and over
† The mean in Figure 2 was calculated using the direct standardization method based on a 2005 population projection.
Source: Korea Health Statistics 2019, Korea National Health and Nutrition Examination Survey, http://knhanes.cdc.go.kr/ Reported by: Division of Health and Nutrition Survey and Analysis, Korea Disease Control and Prevention Agency
39.9 42.1 30.0 35.7 35.0 35.437.836.5 35.8 35.6 38.2 38.6 33.1 31.4 26.2 28.1 41.5 42.2 33.7 38.4 36.9 38.2 40.9 39.8 39.0 37.2 39.9 41.2 36.7 34.4 29.7 31.1 38.6 42.0 26.3 33.4 33.1 32.6 34.8 33.3 32.634.3 36.6 35.9 29.6 28.2 22.7 25.1 0 5 10 15 20 25 30 35 40 45 50 1998 2001 2005 2007 2008 2009 2010 2011 2012 2013 2014 2015 2016 2017 2018 2019
Total Men Women
(%)
Survey year
Figure 2. Trends in the proportion of consuming more than 500g of vegetables and fruits per day, 1998-2019
13.8 14.0 16.6 32.1 45.2 36.0 0.0 10.0 20.0 30.0 40.0 50.0 6-11 12-18 19-29 30-49 50-64 65+ (%) Age(year)
Figure 3. Proportion of consuming more than 500g of vegetables and fruits per day, 2019