1481
ⓒ The Korean Society of Food Science and Technology
Effect of
Salicornia herbacea
Polysaccharides on the Activation of
Immune Cells
in vitro
and
in vivo
Deok Seon Ryu1, Seon Hee Kim2, and Dong Seok Lee1,2*
1Department of Smart Foods and Drugs, Inje University, Gimhae, Gyeongnam 621-749, Korea 2Department of Biomedical Laboratory Science, Inje University, Gimhae, Gyeongnam 621-749, Korea
Abstract The immunomodulating effect of Salicornia herbacea polysaccharides on BALB/c mice splenocytes was
investigated. Crude (CS) and fine polysaccharide (PS) extracts with potential biological activity were prepared from S. herbacea. For in vitro experiments, splenocytes and separated T cells were treated with CS and PS (0.5, 1, 2, and 4 mg/mL). For in vivo experiments, the CS and PS were orally administered to BALB/c mice every day for 2 weeks. For basic data analysis, physiological parameters were recorded. Cell proliferation of splenocytes and T cells was used as an index for immunomodulating activity. The proliferation of splenocytes and separated T cells was 3.2 and 3.5 times higher than the control, respectively. Moreover, when splenocytes were treated with mitogen, the highest proliferation rate was observed in splenocytes cultured with PS. Interestingly, the stimulative activity of PS was more strongly exerted through CD4+ T cells than
through CD8+ T cells.
Keywords:Salicornia herbacea, polysaccharide, splenocyte, immunomodulating activity
Introduction
Levels of obesity and the prevalence of adult diseases such as cardiac disorders in the Korean population are rising due to Westernized eating habits, environmental pollution, lack of exercise, and increased stress. In response to this situation, there is increasing interest in research on maritime plants in the search for novel agents for health promotion and the development of functional foods (1). As the role of maritime plants in anti-cancer activity, immunomodulation, decreasing blood sugar level, and controlling weight is becoming widely known, these plants are attracting attention as possible sources of physiologically active materials (2,3). Polysaccharides such as schizophyllan and lentinan have been used for the cancer prevention and chemotheraphy. Especially, lentinan is being considered as a stimulator of cell mediated immunity (4,5). This report focuses on the immunomodulating activity of one of the more widely studied plants, Saliconia herbacea. S. herbacea is an annual plant belonging to the Chenopdiceae family that grows in the saltfields of the south and west coasts of Korea and is called hamcho in Korean. These plants not only have a high salt content, but also contain plenty of natural minerals, 50% linolenic acid, and 40% essential amino acids in comparison to their total fatty acid or amino acid content. In addition, their high dietary fiber content (50-70%) makes them effective at preventing constipation. S. herbacea has been used in the Orient in folk remedies to cure cancer, empyema, arthritis, high blood pressure, lumbago, obesity, hemorrhoids, diabetes, thyroiditis, asthma, bronchitis, and liver disorders (2,6-9); however, systematic research on its activity is insufficient at this time. Because of its diverse medicinal properties, S.
herbacea is expected to yield valuable therapeutic agents, but much scientific research will be required due to the lack of fundamental data regarding its physiological activity.
This study aims to clarify the effect of crude S. herbacea extract and S. herbacea polysaccharides on immune cell activation to validate their use as functional foods. Materials and Methods
Materials Saliconia herbacea was harvested in the south and west reclaimed land along the shore in Korea and provided by Dasarang Ltd. (Sinan, Korea). S. herbacea were dried and sliced, and the polysaccharides were extracted by boiling in water for 3 hr under high pressure. Crude polysaccharides of S. herbacea (CS) were collected by filtration through filter paper (Whatman®; Whatman
International Ltd., Maidstone, England). Fine polysaccharides of S. herbacea (PS) were purified using the protocol described by Klarzynski et al. (10) with slight modification. The PS was fractionated by filtration using Sephadex G-50 column (200×15 mm) at a flow rate of 3.5 mL/min. The average
molecular mass of PS was measured by gel filtration chromatography with phenol/sulfuric acid monitoring. The CS and PS were freeze-dried using a freeze dryer (Clean-Vac 24T; Biotron, Bucheon, Korea) to obtain powder and stored at −4oC.
Animal care and treatment Experiments were performed in specific pathogen free female BALB/c mice (Hyochang Science Co., Ltd., Daegu, Korea) and used at 7-8 weeks of age. Animals were maintained under constant temperature (25oC) and a 12 hr light-dark cycle and were provided with
food and water ad libitum. Animal experiments were performed in accordance with the Inje University Laboratory Animal Ethics Commission guidelines for the care and use of laboratory animals. The animals were divided randomly into 4 groups (n=6 for each) according to the following
*Corresponding author: Tel: +82-55-320-3262; Fax: +82-55-334-3426 E-mail: [email protected]
Received July 29, 2009; Revised September 19, 2009; Accepted September 28, 2009
experimental regimen. Group 1 was the normal control group. Group 2 and 3 were given CS and PS, respectively. The CS and PS were dissolved in distilled water (DW). All CS and PS were orally administered in an injection volume of 200 mg/kg body weight (BW). The concentration of the CS and PS was determined according to the guideline based on the LD50 and acute oral toxicity test of the
Environmental Protection Agency (EPA). Oral administration was continued once a day throughout the experimental period (2 weeks).
Effects of CS and PS on the mice orally administered
The body weight of animals was recorded every day. After the experimental period, the animals were fasted overnight and sacrificed by cervical dislocation under ether anesthesia. The liver, kidney, thymus, and spleen were excised and the weight of each organ was immediately recorded. Blood samples were then collected in 0.5% ethylene diamine tetraacetic acid (EDTA) as anticoagulant and used for measurement of white blood cell (WBC), red blood cell (RBC), and platelet (PLT) count and estimation of hemoglobin (HGB), hematocrit (HCT), mean corpuscular volume (MCV), mean corpuscular hemoglobin (MCH), and mean corpuscular hemoglobin concentration (MCHC). Hematological values were determined using a Coulter cell counter system (XE-2100; Sysmex Co., Hyogo, Japan). Blood was also collected without anticoagulant and the separated serum was used to assay aspartate transaminase (AST) and alanine transaminase (ALT). All serum samples were stored at −80oC until analysis and biochemical values
were determined using an automated analyzer (ADVIA-2400; Siemens Co., New York, NY, USA). Spleens were dissected under sterile conditions and homogenized in 5 mL RPMI 1640 medium supplemented with 10%(v/v) fetal bovine serum, 5,000 units/mL penicillin, and 5,000
µg/mL streptomycin mixture (Invitrogen Co., New York,
NY, USA). The homogenate was centrifuged at 300×g at
room temperature for 5 min to remove debris. Erythrocytes were lysed by addition of lysis buffer (BD Biosciences, Calsbard, CA, USA) and the tube was gently shaken for 10 sec and recentrifuged. The supernatant was discarded and RPMI 1640 was added to the pellet. Splenocytes were counted and resuspended in RPMI 1640 at 5×10⁵ cells/mL
for proliferation assays. Splenocyte suspensions (100µL/
well) were added to flat bottom 96-well plates and stimulated with concanavalin A (Con A) at 5µg/mL or
lipopolysaccharide (LPS) at 15µg/mL. Control cells were
cultured without addition of mitogen. Splenocyte cultures were incubated for 24 or 48 hr at 37oC in a 5% CO
2
humidified atmosphere (11). To measure cell proliferation, 20µL CellTiter 96® Aqueous One Solution reagent
(Promega Co., Madison, WI, USA) was added to each well, and the cells were incubated for a further 4 hr at 37°C (12). The absorbance of each well at 490 nm was read by a fluorescence multi-detection reader (Synergy HT; BioTek Instruments, Inc., Winooski, VT, USA).
Cell culture and in vitro treatment with CS and PS
Splenocytes (5×10⁵ cells/mL) were obtained from the
spleen of 7-8 weeks old female BALB/c mice as described above. T cells were harvested on nylon wool columns (Polysciences, Inc., Götingen, Germany). All cells were
cultured in RPMI 1640 medium. Cells were treated with 0.5, 1, 2, and 4 mg/mL CS and PS and incubated for 24 or 48 hr at 37oC in a 5% CO
2 humidified atmosphere. All
experiments, including cultivation of cells, were performed in triplicate. Proliferation of splenocytes and T cells was measured using the MTS assay as directed by the CellTiter 96® Aqueous One Solution Reagent (Promega). Phenotypic
analysis of splenic lymphocytes (CD4+, CD8+) was performed
using a FACSCalibur (Flow Cytometry System; BD Biosciences). For immunofluorescence staining, in vitro
stimulated splenocytes (2×10⁷ cells/mL) were incubated
for 30 min on ice with phycoerythrin (PE) or fluorescein isothiocyanate (FITC)-conjugated anti-mouse CD4, CD8 monoclonal antibody (BD Biosciences). After washing with cold phosphate-buffered saline (PBS: 137 mmol HEPES/NaOH, 140 mmol Na2HPO4, pH 7.4), cells were
immediately analyzed with a FACSCalibur flow cytometry using Cell Quest software. Dead cells were excluded using the viability marker propidium iodide (PI). A minimum of 10,000 events were assessed using log amplified fluorescence signals and linear amplified side and forward scatter signals.
Statistical analysis All experiments were performed in triplicate. Data are expressed as mean±standard error (SE). Statistical comparisons of results were made using analysis of variance (ANOVA). Significant differences (p<0.05)
between the means of control and CS or PS treated cells were analyzed by Student’s t-test.
Results and Discussion
Extraction and purification of CS and PS from S.
herbacea Crude polysaccharides (CS) were extracted
from S. herbacea and were approximately 10% of the
whole mass. Fine polysaccharides (PS) were serially purified from CS by gel filtration chromatography (Fig. 1). The average molecular weights of PS were determined to be between 250 and 3,300 Da. Although composition analysis of the polysaccharides has not been conducted yet, it has been reported that S. herbacea contained approximately
46% polysaccharides and the average molar ratio of galactose, glucose, and mannose was 5:1.5:1 (13).
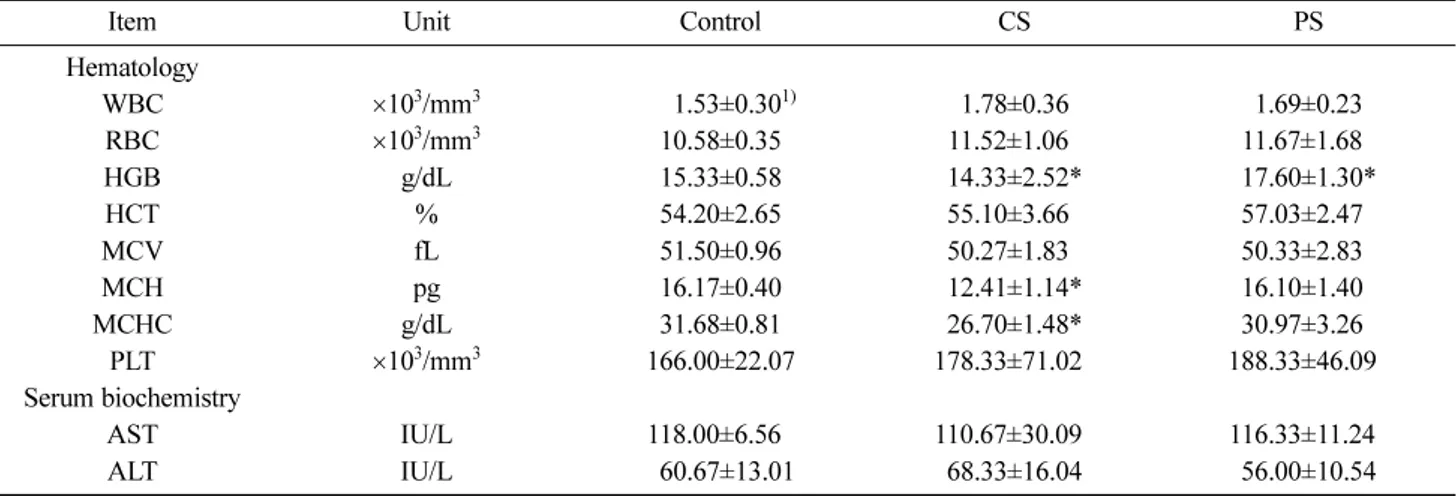
Effect of oral administration of CS and PS on physiological parameters of mice Analysis of hematological and biochemical parameters provides an index that indicates functional changes of the hematopoietic system and the whole body and helps to determine the presence of infection and disease. Hematological parameters of BALB/ c mice following treatment with S. herbacea extracts are
shown in Table 1. The most significant fluctuations were observed in HGB, MCH, and MCHC. The RBC count was higher in animals treated with CS (11.52) or PS (11.67) than in control animals (10.58). The RBC indices, MCV, MCH, and MCHC showed similar values, indicating an increment in RBC size together with number (14). However, the WBC counts were lower than those of other studies (15). The WBC values of any one organism show variations depending on the time and location of blood collection, and can depend on the kind of analyzer (16). The PLT values shown are lower than those of other
studies (15). PLT counts can drop suddenly due to coagulation of blood and can vary depending on the analyzer. The PLT counts of PS animals (188.33) were higher than those of control (166.00) and CS (178.33) animals. As shown in Table 3, the spleen index of CS and PS animals was inversely proportional to the PLT values of the blood (1.057 and 0.972, respectively). These results suggest that hypertrophy of the spleen causes the PLT value in the spleen to increase and proportionally decrease the PLT value in the blood. In serum biochemical analysis, the AST value reflects liver disease along with hepatic cell damage and necrosis and the ALT value reflects hypertrophy and other conditions of the liver. The ALT value was higher in animals treated with CS (68.33) and lower in animals treated with PS (56.00) than that of control animals (60.67) (Table 1). However, the differences in AST and ALT values between the control and experiment groups were not significant and the mean AST and ALT values were within normal ranges. These results suggest that animals treated with PS have a lower rate of hepatotoxicity. Also, the biochemical findings demonstrate that PS does not influence hepatotoxicity in any way. The changes in weight of animals during the experimental period are shown in Table 2. Although the change in weight was not significantly different between the control
and experiment group, the weight of the experimental group tended to increase during the experimental period. In a previous study, when the amount of extract administered increased, weight rate revealed a downward trend (17). We observed the opposite result; however, the change in weight recorded in our study may be due to dietary conditions and the period of development. The weight of internal organs of controls and each experimental group are shown in Table 2. A slight, but not significant, difference was observed between experimental and control groups. The spleen weight index converts the weight of the spleen into a standardized measure and is expressed as the ratio of spleen weight to body weight. In graft versus host
Fig. 1. Gel filtration chromatography of fine polysaccharides of S. herbacea (PS).
Table 1. Hematological and serum biochemical parameters of the mice orally administered with crude (CS) and fine (PS) polysaccharides of S. herbacea
Item Unit Control CS PS
Hematology WBC ×103/mm3 1)01.53±0.301) 1.78±0.36 1.69±0.23 RBC ×103/mm3 10.58±0.35 11.52±1.060 11.67±1.680 HGB g/dL 15.33±0.58 14.33±2.52* 17.60±1.30* HCT % 54.20±2.65 55.10±3.660 57.03±2.470 MCV fL 51.50±0.96 50.27±1.830 50.33±2.830 MCH pg 16.17±0.40 12.41±1.14* 16.10±1.400 MCHC g/dL 31.68±0.81 26.70±1.48* 30.97±3.260 PLT ×103/mm3 166.00±22.07 178.33±71.020 188.33±46.090 Serum biochemistry AST IU/L 118.00±6.560 110.67±30.090 116.33±11.240 ALT IU/L 060.67±13.01 68.33±16.04 56.00±10.54
1)Values are mean±SE (n=6); *Significantly different from control at p<0.05.
Table 2. Change of body weight and organ weight on the mice orally administered with crude (CS) and fine (PS) polysaccharides of S. herbacea Control CS PS Body weight Initial 1)18.20±1.321) 18.70±1.29 18.3±1.29 Final 20.13±1.35 22.97±0.85 23.5±1.12 Organ weight Spleen 0.077±0.006 0.097±0.021 0.095±0.021 Thymus 0.040±0.010 0.037±0.006 0.035±0.007 Liver 0.947±0.051 0.973±0.095 0.980±0.071 Kidney 0.300±0.010 0.300±0.010 0.310±0.010
1)Values are mean±SE (n=6).
Table 3. Spleen index of the mice orally administrated with crude (CS) and fine (PS) polysaccharides of S. herbacea
Group
(200 mg kg/BW) Spleen-weight index1) Spleen index2) Control 1)0.423±0.0323)
CS 0.440±0.095 1.057±0.315
PS 0.404±0.090 0.972±0.127
1)Spleen weight (g)/body weight (g)×100.
2)Mean of weight index) in test group/mean of
(spleen-weight index) in control group.
reactions, the abnormal enlargement of the spleen indicates positive reactions, which is defined as a spleen index greater than 1.3. Moreover, the presence of abnormalities is determined by comparing the spleen weight index of a population with the control group index (18-20). The spleen weight index and the spleen index of the control and experimental groups are shown in Table 3.
Assessment of splenocyte proliferation The effect of food intake on living bodies can be investigated by analysis of internal organs or blood (21). Splenocytes are part of the peripheral lymphatic system and are involved in the initiation of immune reactions against antigens that originate in the blood. The size and number of cells can be used as a direct index and are therefore regarded as the typical immune index (22). In our in vivo experiment, the
animals were divided into 2 groups; the experimental group that received CS or PS, and a control group. After
measuring splenocyte proliferation, the mitogen Con A (5
µg/mL) or LPS (15µg/mL) was added to each culture
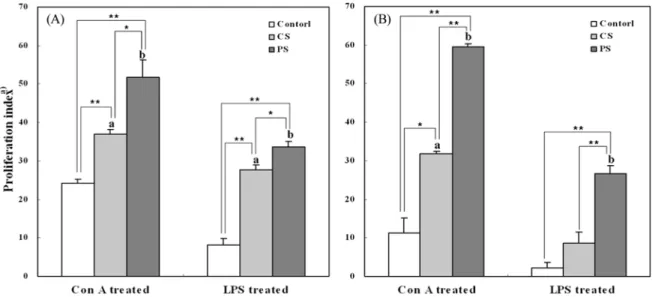
well, and an equivalent volume of DW was added to the control group. The proliferation of splenocytes isolated from treated and control mice is shown in Fig. 2. LPS specifically stimulates proliferation of B cells, whereas Con A stimulates proliferation of T cells. The significantly high proliferation was observed in splenocytes cultured with Con A for 48 hr. Proliferation of splenocytes treated with PS (59.5±0.81) was significantly higher than that of splenocytes treated with CS (31.79±0.62). These results suggest that administration of S. herbacea polysaccharide
strengthens cell-mediated immunity. The spleen, which provides the major protective immune response against antigens originating in the blood, is also the major lymphatic organ where specialization of lymphocytes occurs (23). Thus, proliferation of lymphocytes in the spleen plays a vital role in the immune system. We measured the in vitro
Fig. 2. Effects of crude (CS) and fine (PS) polysaccharides of S. herbacea on the proliferation of splenocytes of mice orally administered. A 100 µL of the splenocytes (5×10⁵ cells/mL) was cultured with mitogen for 24 (A) and 48 hr (B). Significance was determined using the Student’s t-test. *p<0.05 in control vs. PS of Con A and LPS treated, *p<0.05, **p<0.01. a)Proliferation (%)=(mean of O.D. in test wells/mean of O.D. in control wells-1)×100.
Fig. 3. Effects of (CS) and fine (PS) polysaccharides of S. herbacea on the proliferation of mice splenocytes and T cells. (A)
Splenocytes were obtained from the spleen of BALB/c mice. (B) T cells were harvested onto nylon wool column. A 100µL of the
splenocytes and T cells (5×10⁵ cells/mL) was cultured with CS and PS. Significance was determined using the Student’s t-test in CS vs. PS (*p<0.05, **p<0.01). a)Proliferation (%)=(mean of O.D. in test wells/mean of O.D. in control wells-1)×100.
proliferation of splenocytes cultured with CS and PS (Fig. 3A). Proliferation was significantly higher in PS treated cells (320.62±4.81) than in CS treated cells (205.01±3.18), and increased with extract concentration in a dose-dependent manner up to a concentration of 4 mg/mL for 24 hr. Our results confirmed that polysaccharide from the S. herbacea
extracts stimulated splenocyte proliferation, which must reflect proliferation of T cells. Therefore, T cells were separated from the splenocytes, and the effect of PS extract on their proliferation was examined. As shown in Fig. 3B, PS treatment markedly induced proliferation of T cells in a dose dependent manner. Proliferation was significantly higher in PS treated cells (350.39±4.44) than in CS treated cells (176.76±7.96) at 4 mg/mL treatment for 24 hr. The adaptive immune responses consist of humoral immunity, which is a B cell response, and cell mediated immunity, which is a T cell response. Our results suggest that S.
herbacea polysaccharide stimulated splenocytes and T
cells, and induced cell proliferation, confirming that the polysaccharide exerts its effect on cell mediated immunity.
Flow cytometric analysis To further study the effects of PS on T cells, we performed phenotypic analysis of CD4+
and CD8+ populations of splenic lymphocytes (24,25).
Naive lymphocytes, which are cells that have not previously been stimulated by antigen, are called small lymphocytes by morphologists. In response to stimulation, resting small lymphocytes become larger, and are called large lymphocytes, or lymphoblasts. Two-color fluorescence analysis revealed that the increase in CD4+ cell stimulation was due to
increased formation of CD4+ lymphoblasts (Table 4).
When forward scatter (FSC), a measure for cell shape alterations was investigated, the average FSC value of CD4+ cells which function as helper T cells within the
entire lymphocyte population was higher in the PS treated cells (335.38) than in the CS treated cells (300.31) and control cells (286.55). The FSC value increased in a dose dependent manner up to a concentration of 4 mg/mL for 24 hr, and the rate of increase of the PS treated cells (15.43%) was markedly higher than that of the CS treated cells (3.17%). In contrast, the average FSC value of CD8+ cells,
which function as cytotoxic T cells, in PS treated cells, CS treated cells, and control cells was 283.73, 276.59, and
262.84, respectively, showing only a limited increase after PS (7.95%) and CS (5.23%) treatment. These results suggest that the PS caused CD4+ cells of the lymphocyte population
to become lymphoblasts. This stimulating effect on CD4+
cells is expected to lead to an increased number of immune cells. The CD4/CD8 ratio of lymphocytes cultured with CS and PS (Table 4) was analyzed. The CD4/CD8 ratio was the highest in PS treated cells (1.823) compared with CS treated cells (1.593) and control cells (1.269) at 4 mg/mL treatment for 24 hr. Further flow cytometric analysis using the positive control of cells stimulated with Con A and LPS confirmed that the S. herbacea extracts effectively
activated only cell mediated immunity. The average FSC value of CS and PS treated lymphocytes was 491.82±2.34 in Con A treated cells and 305.96±4.97 in LPS treated cells (data not shown). In conclusion, polysaccharide induced proliferation of immune cells, splenocytes reflects stimulation of cell mediated immunity related to T cells. This study could be a useful foundation for the development of novel immunomodulating agents from S. herbacea.
Acknowledgments
This work was supported by the 2008 Inje university research grant and the 2nd Stage BK21 Project of Korea
Research Foundation.
References
1. Park S. Effects of glycine betaine and related osmolytes on growth of osmotically stresses Yersinia enterocolitica. Agric. Chem.
Biotechnol. 38: 218-223 (1995)
2. Im SA, Kim GW, Lee CK. Immunomodulatory activity of
Salicornia herbacea L. components. Nat. Prod. Sci. 9: 273-277
(2003)
3. Shimizu K. Effects of salt treatments on the production and chemical composition of salt wort (Salicornia herbacea L.). Jpn. J.
Trop. Agr. 44: 61-67 (2000)
4. Hamuro J, Chihara G. Lentinan: A T-cell-oriented immuno-potentiator. pp. 409-436. In: Immune Modulating Agents and Their Mechanism. Fenichel RL, Chirigos MA (eds). Marcer Dekker, New York, NY, USA (1984)
5. Kraus J, Franz G. β(1-3) Glucan: Anti-tumor activity and
immunostimulation. pp. 31-44. In: Fungal Cell Wall and Immune Response. Latge JP, Boucias D (eds). Springer-Verlag. Berlin,
Table 4. Flow cytometry analysis on the CD4+ and CD8+ lymphoblast formation and the CD4/CD8 ratio stimulative effects of
mouse splenocytes treated with crude (CS) and fine (PS) polysaccharides of S. herbacea for 24 hr
Total cells counted: 10,000 Conc.
(mg/mL) CD4
+ T cell CD8+ T cell
CD4/CD8 Ratio2) FSC mean %Increase1) FSC mean %Increase1)
Control - 286.55±3.183) 0 262.84±3.43 0 1.269±0.07 Con A 0.005 357.30±12.07* 22.35 379.56±4.72* 44.41 1.994±0.14* LPS 0.015 283.67±16.79 -0.91 265.61±4.52 1.05 1.584±0.18* CS 0.5 297.08±7.47* 3.33 255.12±4.29 -2.94 1.353±0.25 4 296.59±9.16 3.17 276.59±5.17* 5.23 1.593±0.17* PS 0.5 300.31±7.39* 4.35 266.62±4.10 1.44 1.602±0.12* 4 335.38±5.70* 15.43 283.73±5.60* 7.95 1.823±0.19*
1)% Increase=[(mean of FSC in test group-mean of FSC in control group)/mean of FSC in control group]×100. 2)CD4/CD8 ratio was calculated from the percentage of CD4+ and CD8+ T cells.
Germany (1991)
6. Han SK, Kim MS, Pyo BS. Antioxidative effect of glasswort (Salicornia herbacea L.) on the lipid oxidation of pork. Korean J. Food Sci. Anim. Resour. 23: 46-49 (2003)
7. Shin KS, Boo HO, Jeon MW. Chemical components of native plant,
Salicornia herbacea L. Korean J. Plant Res. 15: 216-220 (2002) 8. Kim SH, Ryu DS, Lee DS. Anti-diabetic activity of polysaccharide
from Salicornia herbacea. Korean J. Microbiol. Biotechnol. 36: 43-48 (2008)
9. Ryu DS. Kim SH, Lee DS. Immunomodulating activity of
Salicornia herbacea Extract. Korean J. Microbiol. Biotechnol. 36: 135-141 (2008)
10. Klarzynski O, Plesse B, Joubert JM, Yvin JC, Kopp M, Kloareg B, Fritig B. Linear β-1,3-glucans are elicitors of defense responses in
tobacco. Plant Physiol. 124: 1027-1037 (2000)
11. Chung HK, Bae EK, Je HJ, Hwang JS, Park HD, Kim JE, Jung HJ, Choi HU, Lee DS, Youn HJ. An oligosaccharide fraction from Korean mugwort herb suppresses death of the mouse thymocytes in culture by down-regulating the Fas death receptor gene. Biotechnol. Lett. 25: 1549-1553 (2003)
12. Manish IP, Rodney T, Qihan D. A pitfall of the 3-(4,5- dimethylthiazol-2-yl)-5(3-carboxymethonyphenol)-2-(4-sulfophenyl)-2H-tetrazolium (MTS) assay due to evaporation in wells on the edge of a 96 well plate. Biotechnol. Lett. 27: 805-808 (2005) 13. Im SA, Kim KJ, Lee CK. Immunomodulatory activity of
polysaccharides isolated from Salicornia herbacea. Int. Immuno-pharmacol. 6: 1451-1458 (2006)
14. Tsai PP, Pachowsky U, Stelzer HD. Impact of environmental enrichment in mice. Lab. Animal 36: 411-419 (2002)
15. Wolford ST, Schroer RA, Gohs FX. Reference range data base for
serum chemistry and hematology values in laboratory animals. J. Toxicol. Env. Health 18: 161-188 (1986)
16. Meeks RG. Clinical Biochemical and Hematological Reference Values in Normal Experimental Animals and Normal Human. Masson, NY, USA. pp. 37-74 (1981)
17. Jo YC, Ahn JH, Chon SM. Studies on pharmacological effects of glasswort (Salicornia herbacea L.). Korean J. Medicinal Corp. Sci. 10: 93-99 (2002)
18. Collins FM, Congdon CC, Monrison NE. Growth of Mycobacterium bovis (BCG) in T lymphocyte-depleted mice. Infect. Immun. 11: 57-64 (1975)
19. Kuby J. Immunology. WH Freeman & Co., New York, NY, USA. pp. 327-509 (1997)
20. Zalys RI, Zagon S, Bonneau RH. In vivo effect of chronic treatment with (MET5)-enkephalin on hematological values and natural killer cell activity in athymic mice. Life Sci. 66: 829-834 (2000) 21. Hiroichi NN, Takeshi O, Takeshi I. The effect of methanolic extract
from Corydalistuber on cytokine production and allergic reactions in experimental animal. J. Trad. Med. 16: 51-58 (1999)
22. Abbas AK, Lichtman AH. Cellular and Molecular Immunology. Saunders, PA, USA. pp. 127-216 (2003)
23. Cyster JG. Chemokines and cell migration in secondary lymphoid organs. Science 286: 2098-2102 (1999)
24. Kradin RL, Divertie MB, Colvin RB, Ramirez J, Ryu J, Carpenter HA, Bhan AK. Usual interstitial pnemonitis is a T-cell alveolitis. Clin. Immunol. Immunop. 40: 224-235 (1986)
25. Lee JS, Lee IS, Chung KS, Kim YH, Han YH, Lee MH. Flow cytometrical investigation on antitumor activity of mycelial culture of insect-born fungus Paecilomyces japonica DGUM 32001. J. Pharm. Soc. Korea 45: 64-71 (2001)