EEG Analysis during complex diagnostic tasks in Nuclear Power Plants
- Simulator-based Experimental Study -
Jun Su Ha and Poong Hyun Seong
Department of Nuclear and Quantum Engineering, KAIST 373-1, Guseong-Dong, Yuseong-Gu, Daejeon, South Korea, 305-701
1. Introduction
In literature, there are a lot of studies based on EEG signals during cognitive activities of human-beings but most of them dealt with simple cognitive activities such as transforming letters into Morse code, subtraction, reading, semantic memory search, visual search, memorizing a set of words and so on [1-3]. In this work, EEG signals were analyzed during complex diagnostic tasks in NPP simulator-based environment. Investigated are the theta, alpha, beta, and gamma band EEG powers during the diagnostic tasks.
The experimental design and procedure are represented in section 2 and the results are shown in section 3. Finally some considerations are discussed and the direction for the further work is proposed in section 4.
2. Experiments
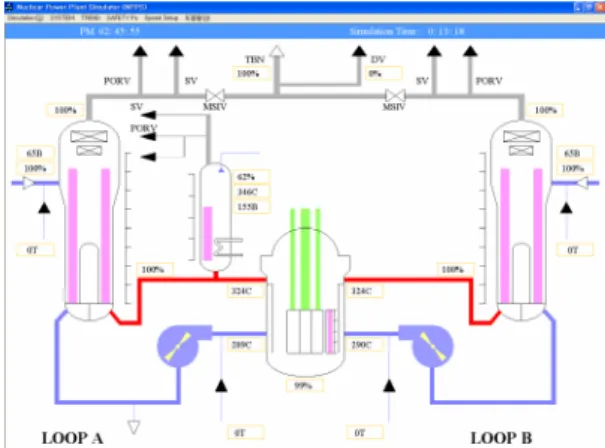
The experiments are conducted within a simulation-based environment. FISA-2 simulator for the PWR type NPP is utilized in this work. The main GUI of FISA-2 simulator for the diagnostic tasks is given in Figure 1. With this simulator six tasks from 8 diagnostic tasks are randomly given to subjects. The 8 diagnostic tasks are as follows:
z LOCA: loss of coolant accident
z SGTR(A): loop-A Steam Generator Tube Rupture z SLB(A): loop-A Steam Line Break
z FLB(A): loop-A Feed Line Break z Pressurizer Heater failure z RCP(Reactor Coolant Pump) trip
z MSIV(Main Steam Isolation Valve) “Close” z Pressurizer Spray failure
WEEG-32TM (LAXTHA Inc.) [4] was utilized for the
measurement of EEG signal. The EEG signals are acquired with 256Hz sampling frequency and 12-bit AD conversion. 8 scalp areas such as Fp1, Fp2, F3, F4, T7, T8, P3, and P4 are selected for the EEG signal measurement on the basis of the modified combinatorial nomenclature method. The information on subjects participating the experiments is described in Table 1.
Figure 1. GUI for diagnostic tasks in FISA-2 simulator
Subject Experience in Nuclear Engineering Age Sex A Ph.D student (Nuclear Engineering) 28 Male B Master student (Nuclear Engineering) 25 Male C Post Doc. (Nuclear Engineering) 30 Male
Table 1. Subjects Information
Total experiment time is 40(s). For the first 10(s) subjects monitor the normal operating condition and then at 10(s) the events occur. For the following 30(s) the subjects perform the relevant diagnostic tasks. Total experiment time 40(s) is subdivided by 1(s) into 40 intervals.
Theta, alpha, beta, and gamma band powers were extracted from the acquired EEG signals during the intervals by fast-fourier transform. The values of 4 EEG band are averaged over the first 10(s) and over the following 30(s), respectively. The first 10(s) refers to the normal operation monitoring situation and the following 30(s) refers to the diagnosing situation.
3 subjects participated in the experiments. 6 diagnostic tasks out of the 8 tasks were randomly selected and given to each of subjects. As a result, 18 experiments were performed.
3. Results
Absolute (Abs.) band power and relative (Rel.) band power are calculated for the 4 EEG bands. The “relative band power” means the relative power of a specific band to the total 4 bands power. The averaged EEG bands powers during the normal operating monitoring situation
Transactions of the Korean Nuclear Society Autumn Meeting Busan, Korea, October 27-28, 2005
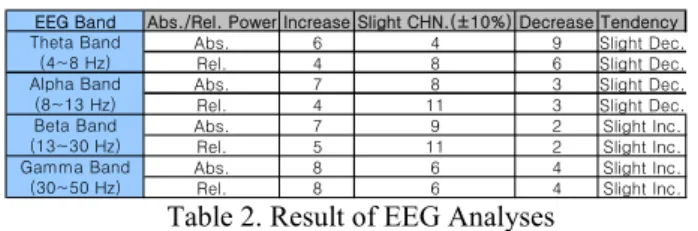
(the first 10(s)) were compared with those during complex diagnostic tasks (the following 30(s)). Cases in which absolute and relative EEG power increased or decrease during the complex diagnostic tasks were identified as shown in Table 2. Regarding uncertainties concerning the EEG signal measurement, and the various calculations such as noise filtering, fast-fourier transform, averaging, and summing, the cases in which there is observed slight increase (Inc.) or decrease (Dec.) less than 10% are considered as “slight change (CHN)” or “not considerable”.
EEG Band Abs./Rel. Power Increase Slight CHN.(±10%) Decrease Tendency
Abs. 6 4 9 Slight Dec.
Rel. 4 8 6 Slight Dec.
Abs. 7 8 3 Slight Dec.
Rel. 4 11 3 Slight Dec.
Abs. 7 9 2 Slight Inc.
Rel. 5 11 2 Slight Inc.
Abs. 8 6 4 Slight Inc.
Rel. 8 6 4 Slight Inc.
Theta Band (4~8 Hz) Alpha Band (8~13 Hz) Beta Band (13~30 Hz) Gamma Band (30~50 Hz)
Table 2. Result of EEG Analyses
The results of the theta band power and the alpha band power in Table 2 show that there were observed more cases in which the power was decreased during the complex diagnostic tasks, where as, the results of the beta band power and gamma band power show that more cases in which the power was increased were observed.
4. Discussions and Further Study
The results of the present experimental study are thought to be almost similar to the existing EEG studies concerning the simple cognitive activities. Especially, Fitzgibbon et al. showed that cognitive tasks such as story reading, subtraction task, expectancy, and learning increase the gamma EEG power [1], which is consistent with the tendency inferred from the results of this study. However we can not make clear conclusion that complex diagnostic tasks increase or decrease the 4 EEG bands power over the long-term diagnostic period, because much variation was observed during the experiments. Consequently, concentration needs to be focused on the EEG power at moments (or much narrower interval than the 30(s), the total diagnosis time) when a subject acquires significant for critical information for the complex diagnostic tasks.
ACKNOWLEDGEMENT
This work is supported by “The Development of the HFE V&V System for the Advanced Digitalized MCR MMIS” project.
REFERENCES
[1] S.P. Fitzgibbon, K.J. Popec, L. Mackenzie, C.R. Clark, and J.O. Willoughby, 2004, “Cognitive tasks augment gamma EEG power”, Clinical Neurophysiology, Vol. 115, pp.1804-1807.
[2] W. Lang et al., 1988, “Event-related EEG-spectra in a concept formation task”, Human Neurobiology, Vol. 6 ,pp. 295-301.
[3] A. Mecklinger et al., 1992, “Event related potentials and EEG components in a semantic memory search task”, Psychophysiology, Vol. 29, pp.104-119.