Wnt/β-catenin signaling promotes midbrain
specification of neural precursor cells derived
from human embryonic stem cells
Ji Young Kim
Department of Medical Science
The Graduate School, Yonsei University
Wnt/β-catenin signaling promotes midbrain
specification of neural precursor cells derived
from human embryonic stem cells
Ji Young Kim
Department of Medical Science
The Graduate School, Yonsei University
Wnt/β-catenin signaling promotes midbrain
specification of neural precursor cells derived
from human embryonic stem cells
Directed by Professor Dong-Wook Kim
The Doctoral dissertation
submitted to the Departmernt of Medical Science,
the Graduate School of Yonsei University
in partial fulfillment of the requirements for the degree of
Doctor of Philosophy
Ji Young Kim
This certifies that the Doctoral
Dissertation
of Ji Young Kim is approved.
Thesis Supervisor : Dong-Wook Kim
Thesis Committee Member #1: Ki-Chul Hwang
Thesis Committee Member #2: Dong-Youn Hwang
Thesis Committee Member #3: Sang-Hun Lee
Thesis Committee Member #4 : Chul Hoon Kim
The Graduate School
Yonsei University
ACKNOWLEGEMENT
I am really grateful to my thesis advisor, Prof. Dong-Wook Kim for
his continuous support, encouragement and precise guidance throughout my
graduate study. Also, I appreciate Prof. Ki-Chul Hwang, Prof. Dong-Youn
Hwang, Prof. Sang-Hun Lee and Prof. Chul Hoon Kim for serving as members
of my thesis committee.
I would like to acknowledge Dr. Dae-Sung Kim, Dr. Han Soo Kim, Dr.
Jiho Jang, Dr. Hyun Sub Hwang and Dr. Chul-Yong Park for helpful research
advices. I would also like to thank to my colleagues, Boyoung, Jae Souk,
Jeong-Eun, Dongjin, Jiwon, Jeong Ah, Hyun-Ju, Hyunji and Dr. Hoon Chul
Kang for their familiar companionship.
For Yong Joon, Moonchul, Hyuna, Mihwa and Young Eun, I am going
to always remember our precious memories. I am never going to forget the
time I spent with you guys. For Jae-Sun and Youjin, I thank you for being
always there for me. I appreciate Prof. Yong Seok Jeong, who has led and
encouraged me to become a scientist I am now.
Finally, I thank my family. My academic career would have not been
possible without you. I love you and thank you from the bottom of my heart.
TABLE OF CONTENTS
ABSTRACT ··· 1
I. INTRODUCTION ··· 3
II. MATERIALS AND METHODS ··· 6
1. Human ES cell culture ··· 6
2. Differentiation and enrichment of neural precursor cells ··· 6
3. Dopaminergic neuron differentiation ··· 6
4. Cell viability assay ··· 7
5. Semiquantitative reverse transcription- and quantitative reverse
transcription-polymerase chain reaction ··· 7
6. Lentiviral production and shRNA transduction ··· 8
7. Immunocytochemistry ··· 9
8. Immunoblotting ···10
9. Analysis of dopamine release ··· 11
10. Electrophysiological recording ···12
11. Statistics ···12
III. RESULTS ···13
1. Screening of signaling molecules to induce midbrain characteristics in
the differentiation of neural precursor cells derived from human
embryonic stem cells ···13
2. GSK-3 inhibition increases midbrain markers in neural precursor cells
···16
3. The Wnt/β-catenin signaling pathway can regulate expression of En1
···19
4. Involvement of another signaling pathway in other than Wnt/β-catenin
which is induced by GSK-3 inhibition increasing of En1 expression
···21
5. Generation of midbrain dopaminergic neuron ···24
6. Functional analysis of dopaminergic neuron ···26
IV. DISCUSSION ···33
V. CONCLUSION ···38
REFERENCES ···39
LIST OF FIGURES
Figure 1. Screening of signal molecules in NPCs derived from
human ES cells (H9)
··· 14
Figure 2. Inhibition of GSK-3 increases midbrain characteristics
··· 17
Figure 3. Wnt/β-catenin signaling pathway can modulate
expression of En1
··· 20
Figure 4. FGF8 involves in midbrain characteristics formation
··· 22
Figure 5. Generation of dopaminergic neuron
··· 25
Figure 6. The comparison between no-treat control group and
BIO-treated group of NPCs after DA differentiation by
immunostaining
··· 27
Figure 7. Functional characteristics of the DA neurons derived
from BIO-treated NPCs
··· 31
Wnt/β-catenin signaling promotes midbrain specification of neural
precursor cells derived from human embryonic stem cells
Ji Young Kim
Department of Medical Science
The Graduate School, Yonsei University
(Directed by Professor Dong-Wook Kim)
Effective differentiation of midbrain dopaminergic (mDA) neurons
derived from human embryonic stem (ES) cells is crucial for cell
replacement therapy to treat Parkinson’s disease (PD). Therefore, in order to
differentiate human ES cells into bona fide mDA neurons in vitro,
mechanisms which control development of mDA neurons needs to be fully
understood.
In this study, I show the involvement of Wnt/β-catenin signaling in
the anterior-posterior patterning during human ES cell-derived DA neuron
development and the activation of Wnt signaling by small molecule glycogen
synthase kinase-3 (GSK-3) inhibitor to obtain the midbrain specific
characteristics. I introduced the small molecule GSK-3 inhibitor,
6-bromoindirubin-3'-oxime (BIO) to neural precursor cells (NPCs) derived
from human ES cells by the simultaneous inhibition of BMP and
Activin/Nodal signals. Once presented to NPCs, BIO exclusively promoted
the expression of midbrain marker engrailed 1 (En1) while reducing the
expression of forebrain marker brain factor 1 (Bf1) and hindbrain marker
gastrulation brain homeo box 2 (Gbx2). Other known specific GSK-3
inhibitors such as 1-Azakenpaullone and lithium chloride (LiCl) also showed
compatible results to BIO. However, NPCs treated with Wnt antagonist
Dickkopf homolog 1 (DKK-1) and Frizzled-5 (Frz-5) revealed the
significantly reduced expression of En1. Beta-catenin specific shRNA
transduction also decreased β-catenin and En1 protein expression.
Furthermore, a combined treatment of NPCs with BIO and fibroblast growth
factor 8 (FGF8), a potent factor that promotes midbrain specification of
NPCs, increased the level of En1 expression additively compared with
BIO-only group while the decreased expression was found when SU5402, a FGF
receptor inhibitor, was added to the combined treatment. This suggests that
the endogenous FGF signal effects in En1 expression along with Wnt signal.
Followed by midbrain specification using GSK-3 inhibitors, NPCs
then differentiated into mDA neurons by a serial treatment of Sonic
Hedgehog (SHH), FGF8, and ascorbic acid. Among the differentiated
TH-positive neurons, an increased number of cells coexpressed En1 while having
a significantly low number of TH-positive cells coexpressed GABA. These
results show that the activation of the canonical Wnt signaling pathway of
NPCs increases the number of midbrain specific neurons within TH-positive
neurons.
Key words : human embryonic stem cells, Wnt/β-catenin signal, GSK-3
inhibitor, anterior-posterior patterning, neural precursor cells, midbrain
dopaminergic neuron
Wnt/β-catenin signaling promotes midbrain specification of neural
precursor cells derived from human embryonic stem cells
Ji Young Kim
Department of Medical Science
The Graduate School, Yonsei University
(Directed by Professor Dong-Wook Kim)
I. INTRODUCTION
Midbrain dopaminergic (mDA) neurons modulate a broad range of processes in the brain, including movement, cognition and reward. Thus, degeneration or dysfunction of mDA neurons in the human brain leads to severe neurological and psychiatric disorders, such as Parkinson’s disease (PD)1. Effective differentiation of mDA neurons derived from human embryonic stem (ES) cells is crucial for cell replacement therapy and the study of PD. A successful application of cell replacement therapy in PD requires a great deal of understanding mechanisms which control development of mDA neurons while maintaining reliable differentiation characteristics.
During vertebrate development, neural induction, anteroposterior (AP) patterning and dorsoventral (DV) patterning are sequential events. Neural inducers and modifiers establish a crude AP pattern before and during gastrulation. The neural plate is patterned along the anterior-posterior axis into four regions, which then continues to develop into forebrain, midbrain, hindbrain, and spinal cord. Such patterning is determined by well-defined and locally restricted gene expressions and by actions of both short and long-range signaling activities2. The development of mid- and hindbrain, for example, is controlled by the activity of isthmic organizer
that is located at the boundary between the prospective mid- and hindbrain, the so-called mid-hindbrain boundary (MHB).
The Wnt family of secreted proteins regulates neuronal precursor proliferation, fate decisions and differentiation in the developing brain3,4. Also, it is known to be involved in midbrain morphogenesis which is regulated through Wnt signaling pathway. Deletion of the Wnt1 gene results in a loss of the mid-hindbrain junction and the consequent loss of dopamine (DA) neurons5-7. Wnts have been categorized as a part of either a canonical or a noncanonical family. The canonical pathway of Wnt signaling acts through stabilization of β-catenin. In the absence of Wnt, on the other hand, β-catenin is continuously phosphorylated by a destruction protein complex, which consists of glycogen synthase kinase-3 (GSK-3), axin, adenomatous polyposis coli and casein kinase I, thereby targeting β-catenin for ubiquitination and degradation in the proteasome. Upon binding of Wnt to Frizzled receptors, GSK-3 is inhibited resulting stabilization of the β-catenin protein which then enters into the nucleus and initiates transcription of target genes8,9. Wnt1 is the prototypical canonical Wnt along with Wnt2, Wnt3a, Wnt7a/b and Wnt8a/b10. Several studies support the central role of canonical pathway in the patterning of MHB mimics the Wnt1 mutant phenotype11,12. Noncanonical Wnts can signal through the activation of the c-Jun N-terminal kinase/planar cell polarity pathway, through the activation of small GTPases or through the increase of intracellular calcium levels13. The canonical subfamily includes Wnt5a, Wnt4, Wnt6 and Wnt1110.
Small molecules targeting endogenous signaling pathways of neural precursor cells (NPCs) can directly regulate differentiation of NPCs. They do not require genetic manipulations, thus reducing the risk for oncogenic transformation can target intracellular sub-branches of pathway downstream of membrane receptor. Small molecules are also capable of strict control in signaling pathway and continuous experimental control. These properties render small molecules an important tool for controlling and directing stem cell differentiation. Recently, several pharmacological GSK-3β inhibitors have been developed14,15,17 mimicking Wnt/β-catenin signaling in different cell systems such as adipogenesis16
embryonic stem cell maintenance18.
Human ES cells, due to their capacity of pluripotency and self-renewal, may serve as a valuable experimental tool for human developmental biology and provide an unlimited source for cell replacement therapy. A previous study investigated enrichment of neuroectoderm cells induced by blocking Activin/Nodal and BMP signal. By introducing small molecules, Dorsomorphine (DM) and SB431542 (SB) at embryoid body (EB) stage, differentiation propensities of different embryonic stem cell lines were subdued and differentiated efficiently into dopaminergic neurons19. In this study, I focused on the formation of midbrain characteristics within differentiating cells during the AP patterning in the brain development. Here, I examined whether pharmacological inhibition of GSK-3 in NPCs derived from human ES cells could modulate the generation of midbrain characteristics.
II. MATERIALS AND METHODS
1. Human ES cell culture
Human ES cell line, H9 (p37-49, WiCell Inc., Madison, Wisconsin, USA) was routinely cultured in Knockout-Serum Replacement (KSR) medium containing Dulbecco’s modified Eagle’s medium (DMEM)/F12 (Invitrogen, Carlsbad, CA, USA) supplemented with 20% KSR (Invitrogen), 1X nonessential amino acid (Invitrogen), 0.1 mM beta-mercaptoethanol (Sigma, St. Louis, MO, USA), and 4 ng/ml of basic fibroblast growth factor (bFGF) (Invitrogen) on the layer of mitomycin-C (Sigma) treated STO feeder cells (ATCC, Manassas, VA, USA). Human ES cell colonies were transferred onto the fresh feeder cells weekly by mechanical passaging.
2. Differentiation and enrichment of neural precursor cells
For differentiation, human ES cell colonies were detached by treatment of 2 mg/ml of type IV collagenase (Invitrogen) for 1hr, then transferred to Petri dish in EB medium (ES medium without bFGF) containing 5 μM of Dorsomorphin (Calbiochem, San Diego, CA, USA) and SB431542 (Sigma). During the EB formation, growth medium changed everyday. After 3 days of EB differentiation, to induce rosette-type NPCs, EBs were attached on Matrigel (BD scientific, Bedford, MA, USA)-coated culture dish in N2 media consisting of DMEM/F12, 1X N2 supplement (Invitrogen) and 20 ng/ml of bFGF for 5 days. During the induction process, media was changed every other day. Then, rosettes were isolated by mechanical isolation using Pasteur glass pipette and plated rosette pieces pull down with pipetting. For NPCs expanding, neural precursors cultured on the Matrigel-coated culture dish with N2 media consisting DMEM/F12 containing 1X N2 supplement with or without BIO (Calbiochem) or other signaling molecules for 6-8 days. During expansion process, media was changed every other day.
3. Dopaminergic neuron differentiation
detached using rubber policeman and by mild pipetting and replated on Matrigel-coated plates. Cells cultured in N2 media supplemented with 200 ng/ml of recombinant human Sonic Hedgehog (SHH) (R&D Systems, Minneapolis, MN, USA) and 100 ng/ml FGF8 (PeproTech, Rocky Hill, NJ, USA) for 8 days. For dopaminergic maturation, regionalized precursors were culture in the N2 media with 20 ng/ml of GDNF (R&D Systems), 20 ng/ml of BDNF (PeproTech), 2 ng/ml of TGF-β3 (PeproTech), 200 μM of ascorbic acid (Sigma) and 5 μM of Forskolin (Sigma).
4. Cell viability assay
Cytotoxicity assay was performed using EZ-Cytox Cell viability assay kit (DAEILLAB SERVICE co., Ltd, Seoul, South Korea). H9 derived NPCs seeded 1 x 10⁴ cells/well in 100 μl N2 medium on 96-well plate and incubated for 24 hours at 37 °C in a humidified 5 % CO2 incubator. Next day, various concentration of BIO added at each well and incubated 24 or 48 hours. Then 10 μl of assay reagent was added at each well and incubated appropriate time (30 minutes – 6 hours). The absorbance was estimated at 450 nm on the Model 680 Microplate Reader (Bio-Rad Laboratories, Hercules, CA, USA).
5. Semiquantitative reverse and quntitative reverse transcription-polymerase chain reaction
Total RNA was extracted using an Easy-Spin® total RNA purification kit (iNtRON Biotechnology, Seoul, Korea) according to the manufacturer’s instructions. One microgram of RNA was reverse transcribed to cDNA with iScript cDNA Synthesis Kit (Bio-Rad). Quantitative RT-PCR was performed using SYBR® Premix Ex TaqTM (TAKARA BIO Inc., Otsu, Japan) on the CFX96 Real-Time System (Bio-Rad) under the following conditions; 1 minute at 95 °C; 40 cycles of 20 seconds at 95 °C, 20 seconds at 60 °C, 20 seconds at 72 °C; and 1 minute extension at 72 °C. Beta-actin transcript was used as an endogenous reference to calculate Ct values and relative expression level (value of 2-ΔΔCt) of target genes according to Bio-Rad’s instruction. All treated samples are represented as the
expression level of the gene relative to their corresponding untreated control (control value equals to one). For semiquantitative RT-PCR, PCR reactions were carried out with 2X EmeraldAmp® GT PCR Master Mix (TAKARA BIO Inc.) and 10 pM of each primer. Samples were amplified in a GeneAmp PCR System 2700 (Applied Biosystems, Carlsbad, CA, USA) under the following conditions: denaturing step at 95 °C for 30 seconds, annealing step at 60 °C for 30 seconds, and amplification step at 72 °C for 30 seconds for 20–35 cycles. cDNA templates were normalized based on the GAPDH-specific signal. The primer sequences follows: Bf1-F 5’- AGA GCA GCA CAT CCA TGA G -3’, 5’- TTG AGT TAC AAC GGC ACC AC -3’; Bf1-R 5’- AAA ACT TGG CAA AGA GGG TCT -3’, 5’- GCG AGT TCT GAG TCA ACA CG -3’; En1-F 5’- GCC CGT GGT CAA AAC TGA -3’; En1-R 5’- TTC TTCTTC AGC TTC CTG GTG -3’; Gbx2-F 5’- CCA AAG AGG GCT CGC TGC TC -3’, 5’- GGA GGA CGG CAA AGG CTT C -3’; Gbx2-R 5’- TCG TCT TCC ACC TTT GAC TCG TC -3’, 5’- TCT TCC ACC TTT GAC TCG TCT TTC -3’; Six3-F 5’- CTC CTC CCC CAC TCC TTC -3’; Six3-R 5’- GGG TAT CCT GAT TTC GGT TTG -3’; Pax2-F 5’- GCA CAC AGA CAT ACC CAG TTG -3’; Pax2-R 5’- AGG GTG GAG GTG GGG TAG -3’; HoxA2-F 5’- CAA GAA AAC CGC ACT TCT GC -3’, HoxA2-R 5’- CGA TTT CCA GGG ATT CTT TG -3’; beta-actin-F 5’- GCT CTT TTC CAG CCT TCC TT -3’; beta-actin-R 5’- CTT CTG CAT CCT GTC AGC AA -3’; Wnt1-F 5’- GCG TCT GAT ACG CCA AAA TC -3’; Wnt1-R 5’- GGA TTC GAT GGA ACC TTC TG -3’; Wnt3a-F 5’- TGT TGG GCC ACA GTA TTC CT -3’; Wnt3a-R 5’- ATG AGC GTG TCA CTG CAA AG -3’; Wnt5b-F 5’- GTG CAG AGA CCC GAG ATG TT -3’; Wnt5b-R 5’- CAG GCT ACG TCT GCC ATC TT -3’; Wnt7a-F 5’- AGT ACA ACG AGG CCG TTC AC -3’; Wnt7a-R 5’- GCA CGT GTT GCA CTT GAC AT -3’; FGF2-F 5’- TCG AAC CGC TGT GTC TCC TAC G -3’; FGF2-R 5’- GCC TCC AAG TAG CAG CCA AAG AAA 3’; FGF5F 5’ CCC TCG GGG CGC CGG ACC GGC A -3’; FGF5-R 5’- AAG TTC TGG CTG CTC CGA CTG CTT --3’; FGF8-F 5’- TGC AGA ATG CCA AGT ACG AG -3’; FGF8-R 5’- TTG AGT TTT GGG TGC CCT AC -3’; GAPDH-F 5’- ACC ACA GTC CAT GCC ATC AC -3’; GAPDH-R 5’- TCC ACC ACC CTG TTG CTG TA -3’
6. Lentiviral production and shRNA transduction
Two shRNA fragments were obtained from Addgene (Plasmid 18803: pLKO.1 puro shRNA beta-catenin, Plasmid 19761: pLKO.1.sh.beta-catenin.1248, Cambridge, MA, USA). Vectors were produced by transient transfection in 293T cells. The day before transfection, plate 293T cells in a 10 cm tissue culture plate so that they would be 90–95 % confluent on the day of transfection. On the day of transfection, remove the culture medium from the 293T cells and replace with 5 ml of growth medium (without antibiotics). For each transfection sample, 3 μg of the virus construct were mixed with 3 μg of the VSV-G envelope plasmid (pLP/VSVG, Invitrogen) and 6 μg of the packaging plasmid (pLP1 and pLP2, Invitrogen). The solution was adjusted to 240 μl with Opti-MEM®
(Invitrogen) and mixed with 12 μl of 1 mg/ml polyethyleneimine (PEI, Sigma). The mixture of DNA and solution incubate for 10 minutes at room temperature. Add the mixture dropwise to each plate of cells. Mix gently by rocking the plate back and forth. Incubate the cells overnight at 37 °C in a humidified 5 % CO2 incubator. The next day, remove the medium containing the DNA and PEI solution and replace with 10 ml complete culture medium without antibiotics. Incubate at 37 °C in a humidified 5 % CO2 incubator. Harvest virus-containing supernatant 48–72 hours posttransfection into a 15 ml cornical tube, centrifuge briefly (500 x g for 10 min) and filter through a 0.45 μm filter. Next, clarified supernatant transfer to a sterile container and combine 1 volume of Lenti-X Concentrator (Clontech, Mountain View, CA, USA) with 3 volumes of clarified supernatant and mix by gentle inversion. The mixed supernatants incubate at 4 °C for 30 minutes to overnight. The samples centrifuge at 1,500 x g for 45 minutes at 4 °C. After centrifugation, carefully remove supernatant. At last, gently resuspend the pellet in proper volume using N2 media. Viral supernatants into cryovials in single use volume aliquot and store viral stocks at – 80 °C.
7. Immunocytochemistry
(PBS) for 30 minutes, washed with PBS, and perforated with PBS containing 0.1 % Triton X-100 for 10 minutes. Then samples were incubated with blocking buffer [PBS containing 2 % bovine serum albumin (BSA)] for 1 hour. Cells were incubated at 4 °C with primary antibodies diluted in PBS containing 2 % BSA for overnignt. The following primary antibodies were used: rabbit anti-Nestin (1:1000, Millipore, Billerica, MA, USA), mouse anti-β-catenin (1:1000, Santa-Cruz Biotechnology, Santa-Cruz, CA, USA), mouse anti-En1 (1:50, DSHB, Iowa, IA, USA), mouse anti-Tuj1 (1:1000, Covance, Richmond, CA, USA), rabbit anti-TH (1:500, Millipore), sheep TH (1:300, Pel-Freez, Rogers, AR, USA), rabbit anti-GABA (1:2500, Sigma), rabbit anti-Nurr1 (1:400, Millipore), rabbit anti-Girk2 (1:400, Alomone, Jerusalem, Israel), rabbit anti-Calbindin (1:1000, Millipore), rabbit anti-AADC (1:500, Millipore), sheep anti-DβH (1:250, Millipore), rabbit anti-VMAT2 (1:100, Abcam, Cambridge, UK), mouse anti-Synaptophysin (1:1000, Millipore). The samples washed 3 times for 5 minutes with PBS and then incubated fluorescent-labeled secondary antibodies [Alexa Fluor 488 (green) or Alexa fluor 594 (red)-labeled donkey/goat IgG (1:1000; Molecular Probes, Invitrogen) in PBS with 2 % BSA for 30 minutes at room temperature. The coverslips were rinsed for 3 times for 5 minutes each in PBS and mounted onto slides using VECTASHIELD Hardset mounting medium with DAPI (Vector laboratories, Buringame, CA, USA). Images were obtained under a fluorescence microscope DP71, FSX100 (Olympus, Tokyo, Japan) and LSM700 confocal microscope (Carl Zeiss, Jena, Germany).
8. Immunoblotting
Cells were washed once with PBS and lysed in a lysis buffer or RIPA buffer (Sigma) containing protease inhibitor cocktail (Roche Applied Science, Mannheim, Germany). Protein concentration was determined using the Bradford protein solution (BioRad) in a Model 680 Microplate Reader (BioRad). Proteins were separated in a 10 % SDS-polyacrylamide gel and transferred to PVDF membrane (Millipore). After blocking the membrane with Tris-buffered saline-tween 20 (TBS-T, 0.1% saline-tween 20) containing 5 % non-fat dried milk for 1 hr at room temperature, membrane was washed briefly with TBS-T, and incubated with
primary antibodies: mouse β-catenin (Santa-Cruz Biotechnology), mouse anti-En1 (Abcam) and mouse anti-β-actin (Sigma) for 1 hr at room temperature or for overnight at 4 °C. The membrane was washed three times with TBS-T for 10 minutes, and then incubated for 30 minutes at room temperature with horseradish peroxidase (HRP)-conjugated secondary antibodies. After washing, the bands were detected by enhanced chemiluminescence (ECL) substrate solution (Pierce, Rockford, IL, USA).
9. Analysis of dopamine release
HPLC analyses of dopamine were performed after 24 hours of conditioning at day 14. The proteins from 1 ml of media from 3 cm culture plate were precipitated by adding perchloric acid (PCA) and EDTA at final concentrations of 0.33 M and 0.17 mM, respectively. After aspiration of the residual media, the cells were treated with 0.2 ml of 50 mM KCl in N2 medium for 30 minutes at 37 °C. Then the media were collected, and the proteins were precipitated by the addition of PCA and EDTA as described above. The mixture was centrifuged at 4 °C for 10 minutes at 14,000 x g, and the supernatant was used for HPLC analysis. Cells were allowed a 1-day recovery in fresh medium after which time they were washed, scraped, collected, and sonicated in a chilled (4 °C) 0.24 ml solution of 0.33 M PCA and 0.17 mM EDTA. After centrifugation at 14,000 x g for 10 minutes, intracellular fraction (supernatant) and cell pellet were separated for intracellular DA and protein analysis, respectively. Samples were applied to reverse-phase HPLC using a OptimaPak C18-51002546 (250mmX4.6mm 5um) and HP Agilent 1100 HPLC (Agilent, Santa Clara, CA, USA). The flow rate of the mobile phase [eluent A, 50 mM KH2PO4 (pH 3.1); eluent B, Acetonitril: 50 mM KH2PO4 (pH 3.1) (10:90)] was 1 ml/minute. The potentials of the guard cell and the first and the second electrodes in the analytical cell were set at 330, 0, and 310 mV, respectively. Dopamine was identified by retention time and quantified based on peak height using the EZChrom Chromatography Data System.
Differentiated human ES cells were examined using the whole-cell recording configuration of the conventional ‘dialyzed’ whole-cell patch-clamp technique. Differentiated cells were obtained by seeding H9 NPCs onto 12-mm round coverslips and culturing for 14 days. Patch electrodes were fabricated from a borosilicate glass capillary (Sutter Instrument Company, San Rafael, CA, USA) by using a vertical micropipette puller (Narishige, Tokyo, Japan). The patch electrodes were fire-polished on a microforge (Narishige) and made to resistances of 1–3 MΩ when filled with the internal solution described below. The cell membrane capacitance and series resistance were compensated (typically > 80%) electronically using a patch-clamp amplifier (Axopatch-200A; Axon Instruments/Molecular Devices Corp., Union City, CA, USA). Current protocol generation and data acquisition were performed using pClamp 8.0 software on an IBM computer equipped with an analogue-to-digital converter (Digidata 1322A; Axon Instruments/Molecular Devices Corp.). Voltage traces were filtered at 2 kHz by using the four-pole bessel filter in the clamp amplifier and stored on the computer hard drive for later analysis. All experiments were performed at room temperature (21 °C – 24 °C). For recording of membrane potential in current clamp mode, the patch pipette solution contained (in mM): KCl 134, MgCl2 1.2, MgATP 1, Na2GTP 0.1, EGTA 10, glucose 14, and HEPES 10.5 (pH adjusted to 7.2 with KOH). The bath solution contained (in mM): NaCl 126, KCl 5, CaCl2 2, MgCl2 1.2, glucose 14, and HEPES 10.5 (pH adjusted to 7.4 with NaOH).
11. Statistics
Values were expressed as means S.E.M. Student’s t-test and ANOVA test using the SPSS software version 12.0 used to determine statistical significance.
III. RESULTS
1. Screening of signaling molecules to induce midbrain characteristics in the differentiation of neural precursor cells derived from human embryonic stem cells.
In order to investigate whether extrinsic signals can modulate regional characters, I expanded NPCs derived from human ES cells by the simultaneous inhibition of BMP and Activin/Nodal signals and treated several signaling molecules during neurulation on Matrigel-coated plates for 6-8 days (Fig. 1A). At this period, NPCs can form anterior-posterior regional characters. First, I analyzed the effect of retinoic acid (RA) in AP patterning by quantitative RT-PCR. RA was not efficient in increasing midbrain characteristics (Fig. 1B). According to the previous studies, it was reported that the treatment of RA upregulate hindbrain markers in early stage of development20-22. Therefore, in this experiment, RA likely increased forebrain markers because of the late treatment in NPCs after neural induction; it formed forebrain charactristics by default mechanism. FGF20 is a known neurotrophic factor expressed in the substantia nigra compacta par23 as well as has an ability to increase mDA neurons from human ES cells24. However, the treatment of FGF20 did not increase midbrain marker En1 in this experiment (Fig. 1C). This might be the difference of experimental conditions, e.g., using PA6 feeder cells, different treatment time points and in vivo conditions. Next, FGF2 and FGF8 were treated to observe a possible increase of midbrain markers in NPCs as previously reported25-27. The treatment of FGF2 did not show a significant difference in all regional markers. Whereupon, the treatment of FGF8 increased En1 expression when compare with the control, but also greatly increased Gbx2, a hindbrain marker. The increase of Gbx2 expression did not coincide with purpose of this experiment. Lastly, Wnt was tested at the neural precursor stage of midbrain specifications. Wnt1 has been reported that it can regulate AP patterning and predominantly enhances mDA progenitor proliferation29. For the efficient induction of Wnt signal pathway, I used the small molecule GSK-3 inhibitor, 6-
Figure 1. Screening of signal molecules in NPCs derived from human ES cells (H9) (A) Overall schematic procedures of the experiment. After neural induction and the early neuroectoderm, neural precursors maintained for 6-8 days with or without signaling molecules. (B) RA which treated with concentration of 1, 5, 10 and 50 nM did not increase midbrain marker En1 in NPCs. (C) Treatment of FGF20 with concentration of 0.1, 1 and 10 ng/ml, also did not increase En1 expression in NPCs. (D) Treatment of FGF2 was not effective in increasing En1 and other regional markers, on the other hand FGF8 increased midbrain marker En1, but it accompanied with upregulation of hindbrain marker Gbx2. (E) Small molecule GSK-3 inhibitor, BIO, augmented the expression of En1 at 1 or 2 μM. However, only 1 μM BIO-treat group was meaningful. (* P<0.05)
bromoindirubin-3'-oxime (BIO). BIO activates canonical Wnt/β-catenin signal pathway 17,18.
After the treatment of BIO during the neural precursor stage, quantitative RT-PCR indicated that BIO specifically up-regulated En1 expression when compare to the control while down-regulation or no-change of forebrain and hindbrain markers. Once presented to NPCs, BIO exclusively promoted the expression of midbrain marker engrailed 1 (En1) while decreasing the expression of forebrain marker brain factor 1 (Bf1) and hindbrain marker, gastrulation brain homeobox 2 (Gbx2). Therefore, I focused on the enrichment of midbrain characteristics during AP patterning through the treatment of GSK-3 inhibitor BIO and performed sequential experiments.
2. GSK-3 inhibition increase midbrain marker in neural precursor cells.
The GSK-3 inhibitor IX, BIO (Fig. 2A) is a cell-permeable bis-indolo (indirubin) compound that acts as a highly potent, selective, reversible, and ATP-competitive inhibitor of GSK-3α/β (IC50 = 5 nM). This pharmacological inhibitor is known to inactive GSK-3 function with a higher specific activity than LiCl, thus facilitating efficient Wnt pathway activation. Inhibition of GSK by BIO has been shown to result in the activation of Wnt-signaling pathway and sustained pluripotency in human and murine ES cells 17,18.
In order to decide an optimal concentration of BIO treatment, various concentrations of BIO were tested (Fig. 2B). Real-time RT-PCR result shows that the addition of BIO to neural precursor cultures increased En1 expression in a dose-dependent manner, with maximal effects at 1 μM. Gene expression could not be detected in of RNA level because of excessive cell death at the concentration over 2 μM. Figure 2C shows the increased viability of NPCs at lower concentrations (0.1, 0.2 and 0.5 μM) of BIO by cell viability assay. Cytotoxicity turned up at 1 μM, and higher concentrations of BIO treatment showed severe cell death. From this, 1μM of BIO was the most ideal with respect to the observed expression of En1 simultaneous with less cytotoxicity. Therefore, I set 1 μM of BIO in concrete for the
Figure 2. Inhibition of GSK-3 increases midbrain characteristics (A) The structure of BIO (B, C) Dose-response and cytotoxicity experiments in H9 NPCs revealed that 1 μM BIO was the optimal dose to increase En1 expression. (D, E) Treatment of BIO 1 μM increased midbrain markers En1 and Pax2 while decreasing forebrain and hindbrain markers. (F) Another small molecule GSK-3β inhibitor, 1-AKP increased En1 significantly. (G) LiCl also up-regulated En1 expression. (H) Immunocytochemical analysis against En1+/Nestein+ showed an induction in the number of midbrain characteristics (En1+) after treatment 1 μM BIO. (* P<0.05, ** P<0.001, scale bar, 50 μm)
following experiments.
BIO can also increase expression of Pax2, another midbrain marker which is expressed during neural development, without increasing forebrain (Six3) or hindbrain (HoxA2) markers (Fig. 2D). In order to investigate whether only BIO could increase En1 expression, I treated H9 NPCs with other GSK-3 inhibitors, 1-Azakenpaullone (1-AKP) and lithium chloride (LiCl) (Fig. 2E and 2F). Small molecule 1-AKP is analogue form of Kenpaullone (GSK-3β selective inhibitor), ATP-competitive inhibitor of GSK-3β and LiCl are widely using GSK-3β inhibitor. Similarly to BIO, 1-AKP and LiCl treatment showed that up-regulated En1 expression without increasing of Bf1 of Gbx2.
These results suggested that selective inhibition of GSK-3 can modulate the AP patterning, resulting in increased midbrain marker expression specifically accompanied by diminishing of forebrain and hindbrain markers.
3. The Wnt/β-catenin signaling pathway can regulate expression of En1.
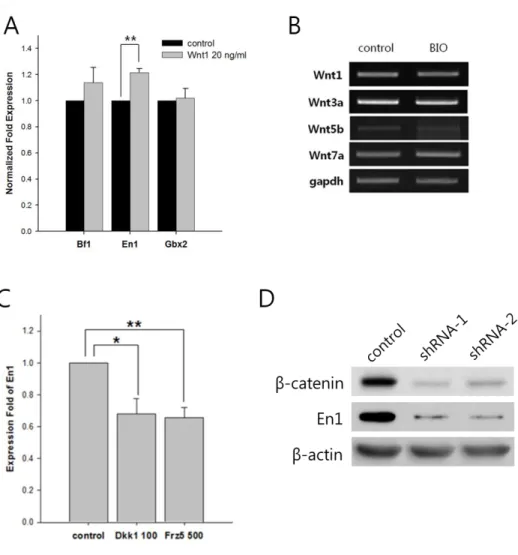
To determine whether the increase of midbrain marker through GSK-3 inhibition was due to activation of Wnt/β-catenin signaling pathway, I verified En1 expression by treatment of Wnt agonist and antagonist in H9 NPCs. Wnt1 is known to be an important regulator in the AP patterning during the CNS development5,6,30. In addition of Wnt1, agonist Wnt signal, slightly increased En1 (about 1.2 fold) as well as Bf1 compared with the control at the same concentration of Wnt1 (Fig. 3A). But, En1 expression fold was meaningful statistically only when 20 ng/ml of Wnt1 was treated. At this period, various endogenous Wnts expressed in both the control and BIO treated H9 NPCs. There were various endogenous Wnt molecules in the control and BIO treated groups during the neural precursor stage which determined by RT-PCR (Fig. 3B). In addition to, Wnt antagonist, Dickkopf homolog 1 (DKK-1) and Frizzled-5 (Frz-5) treatment shows that expression of En1 had significantly decreased comparison to the control (Fig. 3C). In company with the effects of small molecule GSK-3 inhibitor, I confirmed whether genetic modulation can influence expression of midbrain marker En1. Up until now, we observed the increase of En1
Figure 3. Wnt/β-catenin signaling pathway can modulate expression of En1 (A) Treatment with 20 ng/ml Wnt1 increased En1 expression after 7 days in NPCs, as assessed by quantitative RT-PCR. (B) Several endogenous Wnts expressed in H9 NPCs with or without BIO. (C) Treatment with 100 ng/ml DKK-1 and 500 ng/ml Frz-5 decreased En1 expression in NPCs, as assessed by qRT-PCR. (D) Infection of lentivirus containing β-catenin specific shRNA for 72 hrs decreased both β-catenin and En1 protein levels, as assessed by immunoblotting. β-actin was used as a loading control. (* P<0.05, ** P<0.001)
expression through the treatment of small molecule, GSK-3 inhibitor. However, it was necessary to observe the similar reduced expression of En1 throughgene as well.
To confirm whether β-catenin-specific short hairpin RNAs (shRNAs) could reduce En1 expression in NPCs derived from human ES cell, I performed immunoblotting after 72 hours infection of two different lentiviruses containing β-catenin shRNA. Suppression of β-β-catenin expression in NPCs by β-β-catenin specific shRNAs markedly reduced the mounts of active β-catenin and En1 (Fig. 3D). These finding collectively suggest that the induction of Wnt/β-catenin signaling pathway by GSK-3 inhibition could increase expression of midbrain characteristic cells during AP patterning.
4. Involvement of another signaling pathway besides Wnt/β-catenin which is induced by GSK-3 inhibition in En1 expression
In order to determine whether an additional signaling pathway plays a role in the increase of En1 expression other than Wnt/β-catenin signal, a combined treatment of BIO, FGF8, a potent factor that promotes midbrain specification of NPCs, and SU5402 (SU), a FGF receptor inhibitor, was added. Before FGFs signal blocker treatment, some kinds of endogenous FGFs expression were confirmed in H9 NPCs by semi-quantitative RT-PCR (Fig. 4A). Quantitative RT-PCR revealed that either BIO or FGF8 treated group showed increased expression of En1 while BIO combined with SU group showed decreased expression of En1 when compared with BIO-only group. SU-only group showed reduced En1 expression than no treat control group (Fig. 4B). Thus, with the combined treatments of FGF8 and SU, I was able to determine the endogenous FGF signal effects in En1 expression along with Wnt signal. In order to investigate the mechanism of midbrain patterning even further, I analyzed the level of β-catenin protein in NPCs treated with BIO and either FGF8 or SU. Immunoblotting showed the increased level of β-catenin protein
Figure 4. FGF8 involves in midbrain characteristics formation (A) Several endogenous FGFs expressed in neural precursors with or without BIO. (B) Treatment of BIO with either 100 ng/ml FGF8 or 2.5 μM SU5402. BIO and FGF8 treatment showed higher increase of En1 expression rather than the treatment of BIO only, BIO and SU5402 treatment decreased En1 expression when compared with BIO only treatrment or no-treat control. (C) Western blot analysis showed expression of β-catenin and En1 protein in NPCs after combination treatment of BIO and either FGF8 or SU5402. The level of β-catenin in BIO treated groups were not significant different. (D) The nuclear localization of β-catenin by immunostaining with anti-β-catenin and DAPI. NPCs cultured with BIO, except the control group, showed nuclear accumulation of β-catenin. Cells were counterstained with DAPI. (* P<0.05, ** P<0.001, scale bar, 10 μm)
in all BIO treated groups in contrast to no treated control, but there were no difference between BIO, BIO+FGF8 and BIO+SU. En1 expression pattern was coincident with real-time RT-PCR result (Fig. 4C), indicating that an increase of β-catenin stabilization upon treatments of BIO could affect the level of En1 expression not only Wnt/β-catenin signal but FGF8 signal could be concerned with in a separate way. Furthermore, I investigated the localization of β-catenin when BIO combined with either FGF8 or SU were treated in NPCs. NPCs treated BIO combined with FGF8 or SU were observed an enhanced localization of β-catenin in the nucleus when compared with the control group (Fig. 4D). Taken together, the activation of Wnt/β-catenin signaling pathway by BIO can promote cellular accumulation and nuclear localization of β-catenin that eventually can increase En1 expression. Also FGF8 signal can affect in expression of En1, it may act separately with Wnt/β-catenin signaling pathway.
5. Generation of midbrain dopaminergic neuron
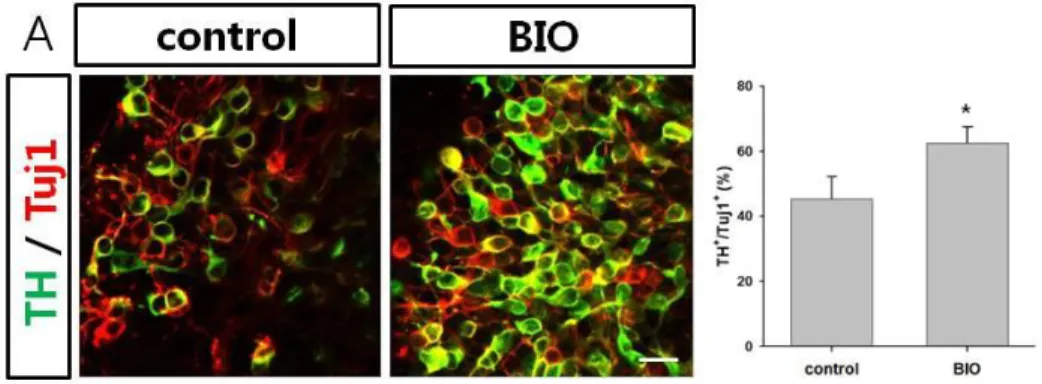
After formation of midbrain characteristics during H9 NPCs, cells were differentiated into midbrain dopaminergic neurons using SHH and FGF8 and terminally differentiated with GDNF, BDNF, TGF-3β, forskolin and ascorbic acid. To confirm the mature dopaminergic neurons that maintain midbrain characteristics, they were confirmed by immunocytochemistry using various protein markers. At 2 weeks after differentiation, approximately 63 % of the total differentiated neurons were positive for TH in BIO treated group in contrast of control group (about 45 %, Fig. 5A). Actually, the amount of Tuj1+ cells were greatly different between the two groups, there was mass of Tuj1+ cells in BIO treated cells but a few Tuj1+ cells in control cells. Eventually, the treatment of BIO increased effect of proliferation, survival and neurogenesis as well as TH+ neuron formation.
In the biosynthesis of monoamines, TH hydroxylates tyrosine to levodopa, which is subsequently decarboxylated by aromatic amino acid decarboxylase (AADC; marker for both catecholaminergic and serotonergic neurons) to become DA. Dopamine β-hydroxylase (DβH) transforms DA to norepinephrine respectively.
Figure 5. Generation of dopaminergic neuron (A) Immunocytochemistry of TH+/Tuj1+ neurons after maturation into DA neuron from NPCs with or without BIO treatment derived from H9 human ES cells. (B) Majority of TH+ cells was positively stained with AADC, but some AADC+ cells were negative for TH. (C) Maturated TH+ neurons did not coexpress DβH in the BIO-treated group during NPCs at 3 weeks of differentiation. (scale bar, 20 μm)
Immunostaining showed that most TH+ neurons were AADC+, although some AADC+ cells were negative for TH (Fig. 5B) and a few TH+ cells expressed DβH (Fig. 5C). These suggest that the TH-expressing neurons possess both enzymes that are necessary for DA synthesis and that these neurons are DA neurons rather than noradrenergic neurons.
In addition to expression of the TH+ neurons, immunocytochemical analysis showed that many of TH+ cells in BIO treated group coexpressed the midbrain marker En1 in the nuclei (approximately 24 %) in contrast of control group (approximately 0.4 %) (Fig. 6A). Meanwhile, DA neurons in the forebrain, especially those in the olfactory bulb, often coexpress GABA. Double immunostaining of TH and GABA indicated that most of the DA neurons in the BIO treatment group were negative for GABA (about 3.4 % of TH+ cells), while GABA+ neurons were found in the control group (about 41 % of TH+ cells) (Fig. 6B). Thus, DA neurons generated in the BIO treatment group are likely midbrain DA neurons. In other midbrain dopaminergic marker expression, majority of Nurr1 was co-immunostained with TH positive neurons in BIO treatment group. There were small amount of Nurr1 coexpressed with TH+ cells of control group (Fig. 6C). Since destroyed midbrain DA neurons are found in the substantia nigra (A9 region) in PD, Differentiation of A9 specific mDA neurons is necessary. Many of Girk2, a marker of A9 specific mDA neurons, expressed in TH+ neurons in the BIO treatment group in compare with control group (Fig. 6D). In contrast, some midbrain DA neurons in the ventral tegmental area (A10 region), contain calbindin. Immunocytochemistry shows a few calbindin+/TH+ neurons co-stained in BIO-treat group less than control group (Fig. 6E). These collectively suggest that BIO treatment in NPCs can increase midbrain characteristics of DA neurons, specifically A9 rather than A10.
6. Functional analysis of dopaminergic neuron
Figure 6. The comparison between no-treat control group and BIO-treated group of NPCs after DA differentiation by immunostaining (A) Coexpression of TH (red) and En1 (green) was observed in BIO-treated group. (B) Few GABA (green) was coexpressed with TH+ cells in BIO-treated group in contrast to the control group. (C) Majority of Nurr1 (green) was coexpressed with TH+ cells in BIO treatment group. BIO-treated TH+ neurons expressed Girk2 (D, Green) but expressed a few calbindin (E, Green). (* P<0.05, ** P<0.001, scale bar, 20 μm)
activity, the differentiated cells were co-immunostained with TH and synaptophysin. Synaptophysin, a membrane glycoprotein of synaptic vesicles that exists in neurons, has been widely used as a marker to synapse formation27. As shown in Figure 7A-C, the TH+ neurons expressed synaptophysin, which indicates that the neurons have the potential to form synapses.
An important physiological aspect of in vitro differentiated DA neurons is their ability to produce and release DA in response to membrane depolarization. To examine functionality, human ES cell-derived DA neurons were analyzed for the production and release of DA. The 24 hour-conditioned media was prepared on differentiation day 14 and cells were treated with 50 mM KCl for 1 hour. After a day recovery in fresh medium, cells were harvested and intracellular DA levels were measured as described. From these samples, released DA levels were assayed by using reverse-phase HPLC. Figure 7D shows that DA released into conditional media and in response to membrane depolarization were three fold higher. These results indicate that the differentiated neurons which were treated with BIO at the stage of NPCs retained the functional properties of DA neurons.
Followed by reverse-phase HPLC, the electrophysiological properties of differentiated neurons were investigated. Recordings in the current-clamp configuration allowed us to determine the active membrane characteristics of these neurons. The neurons exhibited voltage-dependent membrane currents (Fig. 7E). Prolonged depolarizing current injections also demonstrated the capability of the cell to fire fast action potentials and action potential series (Fig. 7F). Depolarizing voltage steps elicited both large outward potassium currents and fast inward sodium currents (Fig. 7G). Altogether, these results indicate that the differentiated cells have the characteristics of neurons.
Figure 7. Functional characteristics of the DA neurons derived from BIO-treated NPCs (A-C) TH+ (red) cells coexpress synaptophysin (Green). (scale bar, 20 μm) (D) Analysis of dopamine release. HPLC analyses of DA levels in 24 hr-conditioned media (spon), 50 mM KCl-challenged media (KCl, 1 hr) and intracellular DA (lysate) obtained with sonication after differentiation. (E-G) Electrophysiological properties of neurons differentiated from BIO treatment NPCs. (E) Voltage-dependent membrane currents. Depolarizing voltage steps (top traces) elicited outward K+ currents and fast inward Na+ currents. (F) Action potentials evoked by depolarizing current steps. (G) Current-clamp recordings during prolonged depolarizing current injections. Top traces represent current injections, whereas bottom traces indicate voltage recordings. Depolarizing current injections elicited fast action potentials. (* P<0.05)
IV. DISCUSSION
Selective loss of mDA neurons in the substantia nigra is associated with PD1. ES cells are optimal cell sources for successful cell replacement therapy for PD because of their unique characteristics. There has been a lot of studies to generate mDA neurons from stem cells31,32, but an optimal differentiation of stem cells to genuine mDA neurons requires further understanding of the molecular mechanisms underlying mDA neuronal development. Toward this goal, numerous laboratories investigated mDA neuron development, resulting in identification of important signaling molecules like SHH and Wnt1 and several key transcription factors (e.g., FoxA2, Lmx1a, Lmx1b, Msx1, Ngn2, Nurr1, and Pitx3)33,34. However, molecular interactions or networks between these extrinsic factors and intrinsic transcription factors are not well understood. Until now, vertebrate’s regionalization studies passed off in vivo mostly. In this study, I tried to generate midbrain characterized cells during AP pattering in vitro using NPCs derived from human ES cells according to the developmental event by signaling pathway modulation.
Previously, it was reported that some kinds of FGFs, retinoic acid, and Wnt1 could change cell fate along the A-P axis35-37. Caudalization of the neural tube in response to FGF2 or FGF4 has been previously demonstrated in the chick and frog. FGF2 caudalizes the neural tube indirectly by modifying the paraxial mesoderm or they reported changes only in early regional markers. The FGF2/4 activity is one of multiple participating signals that later acting signals determine the fate of mature neurons, and that FGF4 can directly act on neural tissue or may influence the axial mesoderm25. FGF8 is a morphogen involved in the patterning of isthmus and has used with SHH, ventralizing molecule, for DA neuron generation. There is a report that reveals the treatment of FGF8 during early neural precursor stage could midbrain patterning in vitro27. Also, FGF8 could activate Gbx2 and characterize hindbrain fate28. In the same manner, my result showed that the treatment of FGF8 could considerably increased Gbx2, hindbrain marker, in company with En1, midbrain marker. Although FGF8 could increase expression of
midbrain marker, it is not necessary increasing hindbrain marker. Hence, it seems not to be suitable for generation of midbrain character. Meanwhile, there are the reports that FGF20 increases the yield of DA neurons from human ES cells grown on PA6 feeder cells24 and RA has a role in patterning both the anteroposterior and dorsoventral axes in the embryonic vertebrate central nervous system 38.
The Wnt1-regulated molecular network revealed previous studies explain the functional role of Wnt1 in mDA phenotype specification39,40 apart from its well-established role in NPCs4. Wnt signaling has been known as a pivotal molecule in midbrain morphogenesis. Wnt1 mutant mice present an abnormal posterior midbrain, isthmus and rostral hindbrain, unveiling the essential role of Wnt signaling in MHB formation5,6. In addition, Wnt1 directly regulates the expression of Otx2, a factor midbrain involved in midbrain morphogenesis, in a Wnt1-Lmx1a autoregulatory loop during embryonic development48. Here, I showed that Wnt/β-catenin signaling can modulate AP patterning using GSK-3 inhibitor during neural precursor stage derived from human ES cells. GSK-3 inhibitors treatment significantly increased midbrain markers in NPCs (Fig. 2).
In addition, to confirm whether Wnt/β-catenin signaling pathway regulate expression of En1, I examined the effect of Wnt signal agonists or antagonists. The test of agonist, Wnt1 had increased En1 expression in company with Bf1, but not Gbx2, hindbrain marker at specific concentration compared with control group (Fig. 3A). Treatment of antagonists, DKK-1 and Frz-5, decreased of En1 expression significantly (Fig. 3C). This suggests that blocking Wnt/β-catenin signal can down-regulate of En1 expression. Furthermore, blockage of genetic transcription through localization of β-catenin using shRNA to the β-catenin revealed that it had related expression of En1 (Fig. 3D). Such results were obtained due to external Wnt molecules also being able to influence signaling cascade. However, there was no significant effect like GSK-3 inhibitor treatment which indicates that direct inhibition of downstream signal molecule by small molecules shows much better effect to regulate signaling cascade.
There are reports that Wnt signal regulate to midbrain characteristics by not its own action in AP patterning, several signal molecules have mutual relation40.
In figure 3C, treatment of DKK-1 or Frz-5 did not completely shutdown of En1 gene expression. Such results indicate that there is another signaling pathway along with Wnt signal induction by GSK-3 inhibition. FGF8 is known to an essential patterning molecule for the midbrain, hindbrain, and rostral forebrain35. In the mid/hindbrain, FGF8 appears to have several distinct functions. First, it is necessary for the induction of early regulatory genes, which pattern the mid/hindbrain region (i.e., En2). Second, it is required for the sustained expression of regulatory genes, which establish the isthmus (i.e., Pax2, Wnt1, En1). Third, it is essential for the induction of mature classes of neurons (DA and 5-HT)25.
In the test of endogenous FGFs signal by semiquantitative RT-PCR analysis, various FGF genes were expressed in NPCs derived from H9 human ES cells. Meanwhile, FGF gene expressions in BIO treated NPCs shows the increase of FGF8 unlike the rest of FGF gene family. This phenomenon is coincident with previous knockout mouse study which reveals that Wnt1 signaling pathway targets En1 expression and regulates FGF8 expression in midbrain development41. According to the previous study, the engrailed genes, En1 and En2 are both expressed across the boundary, yet their expression domains are not fully equivalent. En1 and En2 have been shown to be the targets of the Wnt1 signaling pathway in the midbrain and to regulate the expression of FGF8. Wnt1 and FGF8 are normally expressed in adjacent rings of cells just anterior and posterior to the mid-hindbrain junction, respectively42,43. With respect to the necessary mutual activation of FGF8 and Wnt1, FGF8 and Wnt1 require each other for their stable maintenance but are not sufficient to induce each other’s expression, as the respective update rules contain at least one additional factor. Thus, FGF8 maintains but does not induce Wnt141. Regulatory network in addition to the necessary mutual inhibition of Otx2 and Gbx2, these two transcription factors have antagonistic effects on FGF8 and Wnt1 expression44,45.
Further, these midbrain characterized NPCs by GSK-3 inhibition could successfully differentiate into mDA neurons. The number of TH+/Tuj1+ neuron was different between the control and BIO-treated group (Fig. 5A). Neurogenesis of control group was very poor, there was a few cell colony, while BIO-treated group
was closely packed neuronal cells mostly Tuj1+. This finding indicates that Wnt signal induction by GSK-3 inhibition can enhance of survival, proliferation and neurogenesis of NPCs. It is coincident with other studies46,47. Various mDA neuron markers were confirmed by immunocytochemistry and barely expressed of forebrain (GABA, Fig. 6B), ventral tegmentum (A10, calbindin, Fig. 6E) and norepinephrin (DβH) (Fig. 5C). And immunostaining showed that a number of Nurr1 was expressed in mature mDA neurons (Fig. 6C). Pitx3 and Nurr1 are the direct downstream targets of the Wnt1-Lmx1a autoregulatory loop links a key signaling pathway of mDA differentiation to the major molecular regulators of terminal differentiation/survival of mDA neurons48. Also, an important physiological criterion of a functional DA neuron is the ability to release synthesized DA in response to membrane depolarization (Fig. 7D).
Engrailed proteins are homeodomain transcription factors that highly conserved throughout the animal kingdom. En1 and En2 appear at E8 and E8.5 in the anterior mouse neuroectoderm as patches, which subsequently fuse to mark a band of cells that will later give rise to the border region between midbrain and hindbrain49-51. The engrailed double-mutant mice showed a deletion of the midbrain and anterior hindbrain49,52, meaning both the ability of engrailed to act as a signaling molecule and suggesting a biochemical equivalence between En1 and En2. En proteins have shown to be targets of the Wnt1 signaling pathway in the midbrain48 and to regulate the expression of FGF854. Similarly to Engrailed proteins, Pax5 is also expressed across the boundary55. In Drosophila and chick embryo, interactions between engrailed and Wnt/wg signaling pathways have been described whereby engrailed expression is dependent on Wnt/wg signaling56-58. Inactivation of the
Wnt1 gene leads to the deletion of the mid-hindbrain area with concomitant loss of
En15,6. Furthermore, the expression of En1 under the Wnt1 promoter rescues the most of the Wnt1 phenotype, suggesting that En1 is a downstream target of En17. In conclusion, both Wnt1 and En1 cooperate in the patterning of the MHB region during early development.
Recently, it has been shown that the homeobox genes Otx2 and Gbx2 are key players in positioning the mid-hindbrain organizer (MHO)55,59. Ectopic
expression of Otx2 under control of the En1 promoter, using a knock-in approach, caused a caudal shift of the genetic network maintaining and mediating MHO patterning activity. The position of the MHO is determined by the juxtaposition and interaction of the homeodomain transcription factors Otx2 and Gbx255,59. In a mouse model, in which Otx2 is expressed under the control of the endogenous En1 promoter, Otx2 expression is extended caudally across the MHB into rhombomere 1. Gene inactivation experiments have shown that the homeodomain proteins En1, En2, and the paired domain factor Pax2, which are expressed across the MHB are necessary for development of the mid-/hindbrain region60,61. Likewise, FGF8, its receptor FGFR-1, and Wnt1 are essential for the development of the entire mid-/hindbrain region5,6,30.
Over the last two decades, studies show the central roles which En1 and Wnt signaling might play in the regional determination of AP patterning. Canonical Wnt signaling pathway overlaps with En1 in time and space and regulates the genesis of midbrain characteristics during the early CNS development as a key player. Therefore, a more detailed analysis of the Wnt/β-catenin signaling in the midbrain characterization is needed. The ability to efficiently generate midbrain characteristics using small molecule GSK-3 inhibitor will be a good research tool for the mDA differentiation study by extension, therapeutic approach.
V. CONCLUSION
In this study, we investigated the involvement of Wnt/β-catenin signaling in the anterior-posterior patterning during human ES cell-derived DA neuron development and the activation of Wnt signaling by small molecule glycogen synthase kinase-3 (GSK-3) inhibitor to obtain the midbrain specific characteristics. Also, we have shown that Wnt/β-catenin signal can increase expression of En1 by direct interaction with each other, and involvement of FGF8 signal. Although previous studies revealed the relationship between Wnt1 and En1, the role which En1 played during the brain development was poorly understood. However, using human ES cell-derived NPCs, we have revealed Wnt/β-catenin signal controls the increase of En1 expression during AP patterning as well as the involvement of FGF8 signals to the increase of the expression. Based on my study, I conclude that the small molecule GSK-3 ihibitor can modulate Wnt signaling pathway and destine regional characters in AP patterning of the brain development.
REFERENCES
1. Lang AE, Lozano AM. Parkinson’s Disease: Second of Two Part. New Engl J Med 1998;339:1130-43
2. Echemarria D, Vieira C, Gimeno L, Martinez S. Neuroepithelial secondary organizersand cell fate specification in the developing brain. Brain Res Rev. 2004;43:179-91
3. Dorsky RI, Moon RT, Raible EW. Control of neural crest cell fate by the Wnt signaling pathway. Nature 1998;396:370-3
4. Megason SG, McMahon AP. A mitogen gradient of dorsal midline Wnts organizes growth in the CNS. Development 2002;129:2087-98
5. McMahon AP, Bradley A. The Wnt-1 (int-1) proto-oncogene is required for development of a large region of the mouse brain. Cell 1990;62:1073-85
6. Thomas KR, Capecchi MR. Targeted disruption of the murine int-1 proto-oncogene resulting in severe abnormalities in midbrain and cerebellar development. Nature 1990; 346:846-50
7. Danielian PS, McMahon AP. Engrailed-1 as a target of the Wnt-1 signalling pathway in vertebrate midbrain development pathway. Nature 1996;396:370-73 8. Huelsken J, Behrens J. The Wnt signaling pathway. Cell Sci. 2002;115:3977-78 9. Logan CY, Nusse R. The Wnt signaling pathway in development and disease. Annu Rev Cell Dev Biol. 2004;20:781-810
vertebrate development. Trends Genet. 1997;13:157-62
11. Chenn A, Walsh CA. Increased neuronal production, enlarged forebrains and cytoarchitectural distortions in beta-catenin overexpressing transgenic mice. Cereb Cortex 2003;13:599-606
12. Cilov D, Sinjushina N, Saarimaki-Vire J, Taketo MM, Partanen J. Beta-catenin regulates intercellular signaling networks and cell-type specific trasnctiption in the developing mouse midbrain-rhombomere 1 region. PLoS One 2010;5:e10881 13. Veeman MT, Axelrod JD, Moon RT. A second canon. Functions and mechanisms of beta-catenin-independent Wnt signaling. Dev Cell 2003;5:367-77 14. Cohen P, Frame S. The renaissance of GSK3. Nat Rev Mol Cell Biol. 2001;2:769-76
15. Bain J, Mclauchlan H, Elliott M, Cohen P. The specificities of protein kinase inhibitors: an update. Biochem J. 2002; 371:199-204
16. Bennette CN, Ross SE, Longo KA, Bajnok L, Hemati N, Johnson KW, et al. Regulation of Wnt signaling During adipogenesis. J Biol Chem. 2002;277:30998-1004
17. Meijer L, Skaltsounis A-L, Magiatis P, Polychronopoulos P, Knockaert M, Leost M, et al., GSK-3-selective inhibitors derived from tyrian purple indirutins. Chem Biol. 2003;10:1255-66
18. Sato N, Meijer L, Skaltsounis L, Greengard P, Brivanlou AH. Maintenance of pluripotency in human and mouse embryonic stem cells through activation of Wnt signaling by a pharmacological GSK-3 specific inhibitor. Nat Med. 2004;10:55-63
19. Kim D-S, Lee JS, Leem JW, Huh YJ, Kim JY, Kim H-S, et al. Robust enhancement of neural differentiation from human ES and iPS cells regardless of their innate difference in differentiation propensity. Stem Cell Rev and Rep. 2010;6:270-81
20. Papalopulu N, Kintner C. A posteriorising factor, retinoic acid, reveals that anteroposterior patterning controls the timing of neuronal differentiation in Xenopus neuroectoderm. Development 1996;122: 3409–18
21. Blumberg B, Bolado J Jr, Moreno TA, Kintner C, Evans RM, Papalopulu N. An essential role for retinoid signalling in anteroposterior neural patterning. Development 1997;124:373–79
22. Maden M. Retinoid signaling in the development of the central nervous system. Nat Rev Neurosci. 2002;3:843-53
23. Ohmachi S, Watanabe Y, Mikami T, Kusu N, Ibi T, Akaike A, et al. FGF-20, a Novel Neurotrophic Factor, Preferentially Expressed in the Substantia Nigra Pars Compacta of Rat Brain. Biochem Biophys Res Commun. 2000;277:355–60
24. Correia AS, Anisimov SV, Roybon L, Li JY, Brundin P. Fibroblast frowth factor -20 increase the yield of midbrain dopaminergic neurons derived from human embryonic stem cells. Front Neuroanat. 2007; 1:1-9
25. Ye W, Shimamura K, Rubenstein JLR, Hynes MA, Rosenthal A. FGF and Shh signals control dopaminergic and serotonergic cell fate in the anterior neural plate. Cell 1998;93:755-66.
26. Kimura J, Sato-Maeda M, Noji S, Ide H. Synergistic effects of FGF and non-ridge ectoderm on gene expression involved in the formation of the anteroposterior axis of the chick limb bud in cell culture. Dev Growth Differ. 2000;42:219-27.
27. Yan Y, Yang D, Zarnowska ED, Du Z, Werbel B, Valliere C, et al. Directed differentiation of dopaminergic neuronal subtypes from human embryonic stem cells. Stem Cells 2005;23:781–90.
28. Liu A, Losos K, Joyner AL. FGF8 can activate Gbx2 and transform regions of the rostral mouse brain into a hindbrain fate. Development 1999;126:4827-38 29. Castelo-Branco G, Wagner J, Rodrigue FJ, Kele J, Sousa K, Rawal N, et al. Differential regulation of midbrain dopaminergic neuron development by Wnt-1, Wnt-3a, and Wnt-5a. Proc Natl Acad Sci. USA 2003;100:12747-52
30. McMahon AP, Joyner AL, Bradley A, McMahon JA. The midbrain-hindbrain phenotype of Wnt-1-/Wnt-1-mice results from stepwise deletion of engrailed-expressing cells by 9.5 days postcoitum. Cell 1992;69:581-95
31. Chung S, Sonntag KC, Andersson T, Bjorklund LM, Park JJ, Kim DW, et al. Genetic engineering of mouse embryonic stem cells by Nurr1 enhances differentiation and maturation into dopaminergic neurons. Eur J Neurosci. 2002;16:1829–38.
32. Kawasaki H, Mizuseki K, Nishikawa S, Kaneko S, Kuwana Y, Nakanishi S, et al. Induction of midbrain dopaminergic neurons from ES cells by stromal cell-derived inducing activity. Neuron 2000;28:31–40.
33. Ang SL. Transcriptional control of midbrain dopaminergic neuron development. Development 2006;133:3499-506
34. Smidt MP, Asbreuk CH, Cox JJ, Chen H, Johnson RL, Burbach JP. A second independent pathway for development of mesencephalic dopaminergic neurons requires Lmx1b. Nat Neurosci. 2000;3:337-41
35. Crossley PH, Martines S, Martin GR. Midbrain development induced by FGF8 in the chick embryo. Nature 1996;380:66-8
36. Lumsden A, Krumlauf R. Patterning the vertebrate neuraxis. Science 1996;274:1109-14
37. Shimamura K, Hartigan DJ, Martinez S, Puelles L, Rubenstein JLR. Longitudinal organization of the anterior neural plate and neural tube. Development 1995;121:3923-33
38. Castelo-Brancko G, Rawal N, Arenas E. GSK-3β inhibition/β-catenin stabilization in ventral midbrain precursors increases differentiation into dopamine neurons. J Cell Sci. 2004;117:5731-7
39. Prakash N, Brodsi C, Naserke T, Puelles E, Gogoi R, Hall A, et al. A Wnt1-regulated genetic network controls the identity and fate of midbrain-dopaminergic progenitors in vivo. Dvelopment 2006;133:89-98
40. Wittmann DM, Blöchl F, Trümbach D, Wurst W, Prakash N, Theis FJ. Spatial analysis of expression patterns predicts genetic interactions at the mid-hindbrain boundary. PLoS Comput Biol. 2009;5:e1000569.
41. Parr BA, Shea MJ, Vassileva G, McMahon AP. Mouse Wnt genes exhibit discrete domains of expression in the early embryonic CNS and limb buds. Development 1993;119:247-61.
42. Crossley PH, Martin GR. The mouse Fgf8 gene encodes a family of polypeptides and is expressed in regions that direct outgrowth and patterning in the developing embryo. Development 1995;11:439-51