Masseter muscle changes following orthognathic surgery
A long-term three-dimensional computed tomography follow-up
Da-Hye Lee
a; Hyung-Seog Yu
bABSTRACT
Objective: To evaluate the long-term changes of masseter muscle morphology in skeletal Class III
patients with facial asymmetry following two-jaw orthognathic surgery (Le Fort I osteotomy +
intraoral vertical ramus osteotomy).
Materials and Methods: Using computed tomography (CT), a longitudinal study was conducted on 17 skeletal Class III patients with facial asymmetry. Measurements from the reconstructed three-dimensional (3D) CT images were compared from T1 (before surgery), T2 (1 year after surgery), and T3 (4 years after surgery). The maximum cross-sectional area (CSA), orientation, thickness, and width of the masseter muscle were measured on both the deviated and nondeviated sides. The control group included 17 volunteers with skeletal and dental Class I relationships without dentofacial deformities.
Results: At T1, there were no significant differences in CSA, thickness, or width of masseter muscle between the deviated and nondeviated sides. Masseter muscle orientation was significantly more vertical on the nondeviated side than on the deviated side at T1 (P , .01); no significant bilateral differences were noted at T2 and T3. At T1, masseter muscle measurements were significantly lower than controls (P , .01). During T1–T3, a significant increase was noted in CSA, thickness, and width (P , .01) of masseter muscle. At T3, no significant difference was noted between the study and control groups.
Conclusion: After surgery, the masseter muscle measurements of skeletal Class III asymmetry patients showed no significant differences compared with the control group within the 4-year follow-up period, indicating adaptation to the new skeletal environments and increased functional demand. (Angle Orthod. 2012;82:792–798.)
KEY WORDS: 3D CT; Masseter muscle; Orthognathic surgery; Skeletal Class III; Facial asymmetry
INTRODUCTION
The size of the masticatory muscle varies with craniofacial morphology and is an important indicator of the functional capacity of the masticatory system.1–5
The masseter muscle is considered to generate force biting or chewing and is one of the structures that is
most altered by orthognathic surgery. Its postoperative status may influence the patient’s physical appearance as well as masticatory function.6
The functional and morphological characteristics of the masticatory muscle have been investigated in pa-tients with dentofacial deformities. Papa-tients with mandi-bular prognathism exhibit lower bite force, decreased occlusal contact, and lower electromyographic (EMG) activity than do normal subjects.1,6–9
Asymmetrical EMG activity was reported in patients with developmental mandibular asymmetry.10A
differ-ent level of bilateral activity of the masticatory muscles was reported in children with unilateral cross-bite or lateral forced bite, possibly a functional adaptation of the masticatory system to avoid cuspal interferences.11
In patients with mandibular prognathism, the mas-seter muscle is thinner and smaller in comparison with normal subjects, and its long axis is closer to a right
angle to the FH plane.6–9
In patients with facial
aResident and graduate student, Department of Orthodontics,
School of Dentistry, Yonsei University, Seoul, South Korea.
bProfessor, Department of Orthodontics, School of Dentistry,
Yonsei University, Seoul, South Korea.
Corresponding author: Dr Hyung-Seog Yu, Department of Orthodontics, (Institute of Dentofacial Deformity), School of Dentistry, Yonsei University, 134 Shinchon-dong, Seodaemun-gu, Seoul 120-752, South Korea
(e-mail: [email protected])
Accepted: January 2012. Submitted: November 2011. Published Online: March 5, 2012
G2012 by The EH Angle Education and Research Foundation,
asymmetry, Goto et al.13,14 reported bilateral size
differences of the masseter muscle, with smaller muscle size on the deviated side compared with the nonde-viated side, while other studies reported no significant bilateral differences of the masseter muscle. Kiliaridis et al.15 reported that the masseter muscle in children
with untreated unilateral cross-bite was thinner on the cross-bite side and that the bilateral differences were eliminated after treatment of malocclusion.
Orthognathic surgery, in combination with orthodon-tic treatment, corrects the dentofacial deformity and improves occlusal contacts, masticatory efficiency, bite force, and EMG activity. A number of studies reported the increased bite force and occlusal contact area after orthognathic surgery.6,8,12,16–18
However, most of those studies had insufficient follow-up to evaluate the long-term postoperative improvements and treatment effect on soft tissue and muscle changes. Therefore, the aim of the present study was to investigate long-term changes of the masseter muscle after orthognathic surgery.
Using three-dimensional (3D) computed tomography (CT) images, we evaluated morphological changes of the masseter muscle on the deviated and nondeviated sides and compared the data to that of a control group. We hypothesized that the masseter muscle measure-ments of skeletal Class III patients with facial asymmetry might approach normal values at the long-term postoperative follow-up.
MATERIALS AND METHODS Subjects
This study was carried out in a group of patients diagnosed with skeletal and dental Class III with facial asymmetry (mandibular prognathism with chin devia-tion of more than 3.5 mm from the facial midline19). The
study group was composed of 17 patients who agreed on additional CT examinations at 4 years after surgery (6 male and 11 female; average age, 21.71 years). Patients with hemifacial microsomia, cleft lip and/or
palate, or disease of the temporomandibular joint were excluded from the study. All of the patients underwent preoperative and postoperative orthodontic treatment and two-jaw surgery by one surgical team. The control group was composed of 17 volunteers with skeletal and dental Class I relationship without dentofacial deformities (6 male and 11 female; average age, 20.27 years). The description of the subjects is given in Table 1. Informed consent was obtained from each of the participants.
CT Scanning and 3D Image Reconstruction Each patient underwent 3D CT examinations at 1 month before surgery (T1), 1 year after surgery (T2), and at a postoperative follow-up time (T3) that occurred at an average of 4.25 years after surgery (ranged from 3.25 to 5.33 years). A spiral CT scanner (CT Hispeed Advantage/GE Medical System, Milwau-kee, Wis) was used for CT scans under conditions of 120 kV and 200 mA; the thickness of the axial image was 3.0 mm, and the table speed was 6 mm per second. The digital imaging and communication in medicine (DICOM) images were created in a 1.0-mm slice thickness after scanning. The DICOM images were reconstructed into 3D images using OnDemand soft-ware (CyberMed Inc, Seoul, Korea; Figure 1). The FH plane, which was constructed on both sides of porion and left of orbitale was used as a horizontal reference plane, and the midsagittal plane was drawn perpendic-ular to the FH plane passing through nasion and prechiasmatic groove.20
The shifted side of menton for the midsagittal plane was defined as the deviated side, and the other side was defined as nondeviated side. Measurements With Reconstructed 3D CT Images
The maximum CSA, thickness, and width of the masseter muscle were measured on both the deviated and the non-deviated side, using the reconstructed 3D CT axial images of T1, T2, and T3. To observe the clear outline of masseter muscle, the images were Table 1. Description of Study Group and Control Groupa
Study Group Control Group
Number of subjects 17 17
Sex 6 male; 9 female 6 male; 9 female
Race Korean Korean
Average age 21.71 y 20.27 y
Inclusion criteria Skeletal/dental Class III with mandibular prognathism Skeletal and dental Class I Chin deviation of more than 3.5 mm from the facial midline No dentofacial deformities Orthodontic treatment Preoperative and postoperative orthodontic treatment No
Surgery Le Fort I osteotomy+ IVRO No
9 of 17 patients had genioplasty
TMD No signs or symptoms of TMD No signs or symptoms of TMD
processed with the software by adjusting the window level, contrast, and density ranges (Figure 2). The maximum CSA of the masseter muscle was measured a level 10 mm above the occlusal plane of the maxillary second molar on the reconstructed CT images. Ten measurements were taken on each side of the masseter muscle, 5 mm above and below slice level, and the maximum cross-sectional area was deter-mined by selecting the highest value.
To obtain the CSA of masseter muscle perpendicular to the muscle direction, the maximum area of masseter muscle (a) was calculated by multiplying the CSA measured on the axial image (a0) by cos h (the angle between the axial image and the section perpendicular to the muscle image; Figure 3). We calculated each CSA according to this methodology because the masseter muscle direction was different between the deviated and nondeviated sides, before surgery and after surgery, affecting the determination of actual CSA. The masseter muscle angle was measured as the angle between the FH plane and the anterior border of the masseter muscle, which was clearly defined on the lateral view of reconstructed 3D CT images
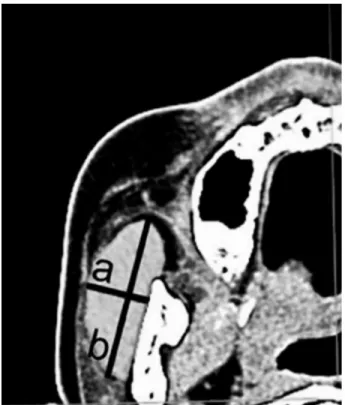
(Figure 4). The thickness was measured as the thickest distance of the masseter muscle cross-sectional area (Figure 5a) and width as the distance between the most anterior and posterior points of the masseter muscle (Figure 5b).
Statistical Analysis
All measurements were performed by one author. Measurements were repeated after 2 weeks by the same author, and the second measurement was used for the statistical analysis. The intraexaminer error between the two measurements was determined by means of a pairedt-test, and the intraclass correlation coefficient was calculated. Pearson correlation analy-sis was used to compare the differences between the
deviated and nondeviated sides. A two-sample t-test
was used to compare differences between the study group and the control group. Repeated-measures analysis of variance was used to compare the changes of masseter muscle measurements over the period from T1–T3. All statistical evaluations were performed with SAS version 9.2 (SAS Inc, Cary, NC).
Figure 1. Reconstruction of a three-dimensional image using OnDemand software (CyberMed Inc, Seoul, Korea).
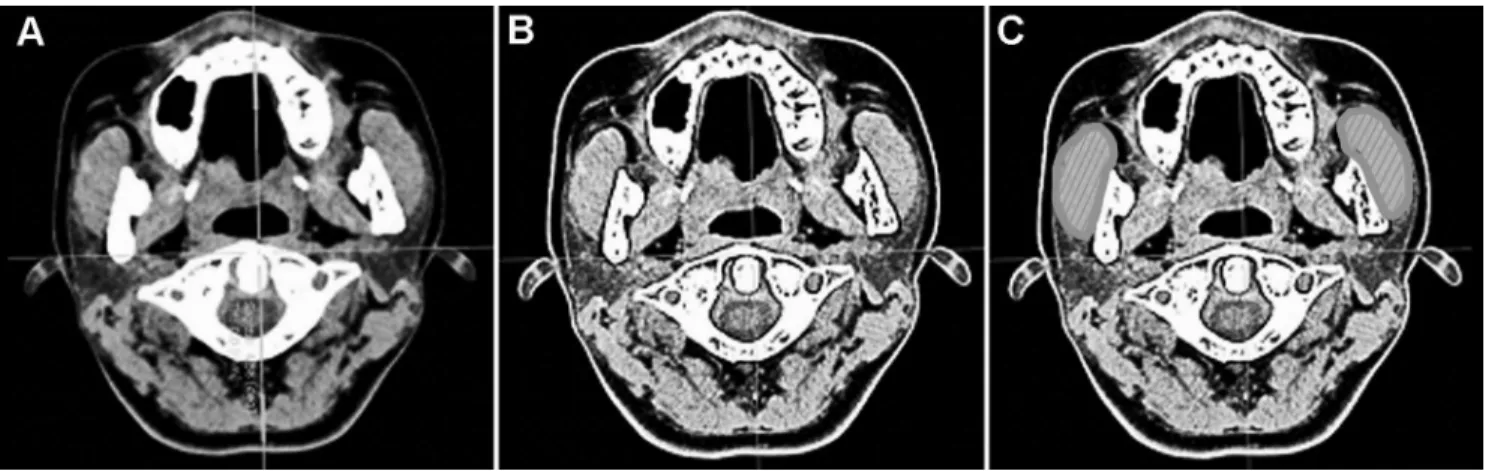
Figure 2. Three-dimensional computed tomography images. (A) Original axial image. (B) After adjusting window level to allow visualization of masseter muscle. (C) Delineation of masseter muscle area.
RESULTS
The intraexaminer error was found to be statistically insignificant (P , .05), and the intraclass correlation coefficients were within acceptable value (mean of .92, with a range of .90–.95).
The comparison of masseter muscle measurements between the deviated and nondeviated side are shown
in Table 2. When comparing the bilateral differences at T1, there was no significant difference of CSA, thickness, or width. Only the masseter angle showed differences, which was significantly more vertical on the nondeviated side than on the deviated side (P , .01). At T2 and T3, no significant bilateral difference was found on every measurement.
The comparison of masseter muscle measurements between the study group and control group is also shown in Table 2. In the study group, the masseter muscle showed significantly smaller CSA (P , .001), thickness (P , .001), and width (P , .01) compared with the control group before surgery (T1), and the masseter muscle angle was significantly different from the control group (P , .001). At T2, there was no significant difference in masseter muscle angle, but CSA (P , .05), thickness (P , .05), and width (P , .05) still were significantly lower than the control group. No significant differences were found between the study group and control group at T3.
The changes in masseter muscle during T1–T3 are shown in Figure 6. There was a significant increase during T1–T2 in the CSA (P , .01) and thickness (P , .001) of masseter muscle. During T2–T3, there was a significant increase in the CSA (P , .001), thickness (P , .001), and width (P , .05) of masseter muscle measurements. DISCUSSION
The present study demonstrated that the masseter muscle measurements of skeletal Class III asymmetry patients reached the values of the control group within the 4-year postoperative follow-up period.
Masticatory muscle assessments are performed using various imaging techniques, including CT, Figure 3. Measurement of cross-sectional area of the masseter muscle. (A) The cross-sectional area measured on an axial slice of the computed tomography images. (B) The adjusted cross-sectional area perpendicular to the muscle direction. (C) Methods for calculating the area (a) from (a0).
Figure 4. Masseter muscle angle was defined as the angle between the FHP (FH plane) and the ABM (anterior border of masseter muscle).
magnetic resonance imaging (MRI), and ultrasound scanning.1–9,13,14,21,22In our study, 3D CT images were
used because our patients underwent CT examinations before surgery and 1 year after surgery for surgical planning and postoperative follow-up. As this study was designed to evaluate the long-term morphologic chang-es of the masseter muscle, CT examinations were performed at 4 years after surgery on 17 patients who agreed on additional CT taking.
With the reconstructed 3D CT images, we could visualize not only soft tissue and muscle surfaces but
also the hard tissue landmarks and reference plane to evaluate the FHP-ABM angle and the CSA. We obtained the CSA of masseter muscle perpendicular to the long axis because the axial slice could be affected by the direction of each muscle.6
There have been many reports on the CSA of the masseter muscle using MRI or CT in subjects with normal craniofacial morphology, showing the values ranging from 363 mm2
to 500 mm2
. These contrasts might be related to variations in the samples such as craniofacial mor-phology, sex, race, and age. Furthermore, each of the studies used different protocols for measuring CSA. A comparison of the CSA area data of our study with that in the literature is shown in Table 3.2,4,5,7
The slice level for the maximum CSA is also an important variable, and we carried out measurements at 10 mm above the occlusal plane from the maxillary second molar. The artifacts from brackets and wires were avoided on this chosen level, and the slice level used in our study was very close to the optimal slice level reported in previous studies.5–8
At T1, no significant differences were found in CSA, thickness, or width of masseter muscles between the deviated and nondeviated sides. Only the angle showed significant bilateral differences, and it can be explained by the laterodeviation of the mandible and gonion. The muscle direction correlates closely with skeletal mor-phology, and masseter muscle orientation is influenced by the position of the zygomatic arch and gonion, to which the muscle attaches. The muscle orientation be-came symmetrical as the skeletal components achieved symmetry by orthognathic surgery, and no significant bilateral differences were noted after surgery. As shown in the previous studies that reported a postoperative reduction of FHP-ABM angle in patients with mandibular Figure 5. (a) Masseter muscle thickness. (b) Masseter muscle width.
Table 2. Comparisons of Masseter Muscle Measurements (Mean 6 SD)a
Control Group (n 5 17) Study Group (n 5 17) T1-D T1-ND T2-D T2-ND T3-D T3-ND CSA, mm2 419.7 6 73.0 333.0 6 52.3 332.0 6 52.6 362.0 6 67.5 363.6 6 67.6 409.2 6 73.9 402.4 6 74.6 Sig 1 *** *** * * NS NS Sig 2 NS NS NS Thickness, mm 14.1 6 1.3 11.9 6 1.4 11.4 6 1.6 13.1 6 1.6 12.8 6 1.6 14.12 6 1.6 14.1 6 1.7 Sig 1 *** *** * * NS NS Sig 2 NS NS NS Width, mm 39.5 6 2.5 36.5 6 3.6 36.4 6 3.3 36.8 6 3.1 37.3 6 3.0 38.7 6 2.7 38.4 6 3.5 Sig 1 ** ** * * NS NS Sig 2 NS NS NS Angle,u 63.8 6 3.3 68.3 6 3.7 70.6 6 3.6 63.6 6 2.8 64.3 6 2.5 63.1 6 2.4 63.4 6 2.0 Sig 1 *** *** NS NS NS NS Sig 2 ** NS NS
aSig 1: comparison between study group and control group; Sig 2: comparison between deviated side and nondeviated side. CSA indicates
cross-sectional area; D, deviated side; ND, nondeviated side; NS, not significant; SD, standard deviation; Sig, significance. *P , .05; ** P , .01; *** P , .001.
prognathism, a significant postoperative reduction of masseter angle was noted in this study.6,7
The asymmetric EMG pattern was reported in patients with developmental mandibular asymmetry or mandibular lateral shift.10
In our study, even the patients had posterior cross-bite, and the study group was composed of a common type of facial asymmetry and had relatively stable interdigitation due to dental compensation and no significant bilateral difference of muscle size was noted at T1. Although we did not measure EMG patterns in this study, we could assume that the bilateral differences of EMG might not be notable. It is reported that the stability of both condyles is more important than that of the dentition to achieve the symmetrical muscle activation pattern.11
The masseter muscle measurements of the study group were significantly lower than the control group before surgery, but they increased during T1–T3 at both sides, showing a tendency to approach control values by T3. Using ultrasonography, Trawitzki et al.9,22
also reported an increase in masseter muscle thickness of
Class III patients after surgical correction of dento-facial skeletal deformity; at 6–8 months after surgery, the values were still lower than controls but reached those of controls 3 years after surgery. These results indicate that a certain period of time is necessary for postoperative functional improvement because a new neuromuscular mechanism is established for the formation of a more stable oral environment.12
The CSA of muscle reflects the physiological action of a muscle through its relation to the maximum isometric force that can be exerted by that muscle.4
The correlation between masseter muscle CSA and maximum voluntary bite force was reported, and this parameter might indicate the functional capacity of the masticatory system.4,16
A number of studies have reported increased bite force, occlusal contact area, and EMG activity and im-proved masticatory efficiency after surgery8,12,16–18,23,24
; however, the reason for this improvement is unclear. It is a subject still under debate that surgery itself improves masticatory function. Previous studies reported that the postoperative improvements in muscular activity were due to better occlusal stability and not to surgically induced biomechanical advantages.12,23,24
The impor-tance of occlusion for the neuromuscular equilibrium and dental supports was investigated in patients undergoing orthognathic surgery. Changes in of muscle size; increased occlusal contact area providing greater dental support; sensitivity of teeth, muscles, and the temporomandibular joints; and even the patients’ willingness to exert maximum effort have been sug-gested as factors in determining the occlusal force after surgery.17
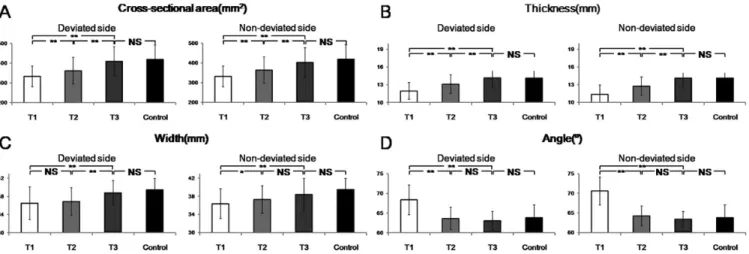
The continuous increases in masseter muscle size in our study indicate that not only was the skeletal environment altered by surgery, but additional adap-tation to new stomatognathic environments also Figure 6. The changes of masseter muscle from T1 to T3. (A) Cross-sectional area (mm2). (B) Thickness (mm). (C) Width (mm). (D) Angle (u). T1
indicates before surgery; T2, 1 year after surgery; T3, 4 years after surgery; NS, not significant. *P , .05; ** P , .01; *** P , .001.
Table 3. Comparison of Cross-Sectional Area (Mean 6 SD) of Masseter Muscle Reported in the Literaturea
Study Method Year
Sample
CSA, cm2
n Sex
Ariji et al.7 CT 2000 91 49 male 3.7 6 0.8
42 female
Boom et al.2 MRI 2008 31 9 male 4.9 6 1.2
22 female
Van Sprosen et al.4 MRI 1991 32 32 male 4.6 6 1.0
Xu et al.5 CT 1993 65 40 male 5.0 6 1.1
25 female
This study CT 2012 17 6 male 4.2 6 0.7 11 female
aCSA indicates cross-sectional area; CT, computed tomography;
occurred over time with improved occlusion and masticatory activity by orthodontic treatments. Also, the pattern of change varied among the individuals in the study group, suggesting that various factors may influence morphologic changes.
Some limitations of this study should be mentioned. We did not compare the data between sexes because of limited sample sizes, and longitudinal studies with larger samples are required. Furthermore, because muscle size is not the only factor to evaluate muscular function scientifically, future studies analyzing bite force, occlusal contact, and muscular activity (EMG) are required to investigate the factors influencing the postoperative changes.
CONCLUSIONS
N There were no significant differences between the
deviated and nondeviated side of masseter muscle measurements of skeletal Class III asymmetry patients, except for masseter muscle orientation.
N The masseter muscle measurements of skeletal
Class III asymmetry patients were significantly lower than that of the control group before surgery. N After surgery, the masseter muscle measurements of
skeletal Class III asymmetry patients reached those of the control group within a 4-year follow-up period. ACKNOWLEDGMENT
This research was supported by a faculty research grant (#6-2009-0029) of Yonsei University College of Dentistry and Oral Science Research Center.
REFERENCES
1. Ueki K, Takazakura D, Marukawa K, Shimada M, Nakagawa K, Yamamoto E. Relationship between the morphologies of the masseter muscle and the ramus and occlusal force in patients with mandibular prognathism. J Oral Maxillofac Surg. 2006;64:1480–1486.
2. Boom HP, van Spronsen PH, van Ginkel FC, van Schijndel RA, Castelijns JA, Tuinzing DB. A comparison of human jaw muscle cross-sectional area and volume in long- and short-face subjects, using MRI.Arch Oral Biol. 2008;53:273–281. 3. Naser-Ud-Din S, Sowman PF, Sampson WJ, Dreyer CW, Turker KS. Masseter length determines muscle spindle reflex excitability during jaw-closing movements.Am J Orthod Dentofacial Orthop. 2011;139:e305–e313.
4. van Spronsen PH, Weijs WA, Valk J, Prahl-Andersen B, van Ginkel FC. Relationships between jaw muscle cross-sections and craniofacial morphology in normal adults, studied with magnetic resonance imaging. Eur J Orthod. 1991;13:351–361.
5. Xu JA, Yuasa K, Yoshiura K, Kanda S. Quantitative analysis of masticatory muscles using computed tomography. Den-tomaxillofac Radiol. 1994;23:154–158.
6. Katsumata A, Fujishita M, Ariji Y, Ariji E, Langlais RP. 3D CT evaluation of masseter muscle morphology after setback
osteotomy for mandibular prognathism.Oral Surg Oral Med Oral Pathol Oral Radiol Endod. 2004;98:461–470.
7. Ariji Y, Kawamata A, Yoshida K, et al. Three-dimensional morphology of the masseter muscle in patients with mandib-ular prognathism.Dentomaxillofac Radiol. 2000;29:113–118. 8. Ueki K, Okabe K, Mukozawa A, et al. Assessment of ramus, condyle, masseter muscle, and occlusal force before and after sagittal split ramus osteotomy in patients with mandibular prognathism. Oral Surg Oral Med Oral Pathol Oral Radiol Endod. 2009;108:679–686.
9. Trawitzki LV, Dantas RO, Mello-Filho FV, Marques W Jr. Masticatory muscle function three years after surgical correction of class III dentofacial deformity. Int J Oral Maxillofac Surg. 2010;39:853–856.
10. Dong Y, Wang XM, Wang MQ, Widmalm SE. Asymmetric muscle function in patients with developmental mandibular asymmetry.J Oral Rehabil. 2008;35:27–36.
11. Alarcon JA, Martin C, Palma JC, Menendez-Nunez M. Activity of jaw muscles in unilateral cross-bite without mandibular shift.Arch Oral Biol. 2009;54:108–114. 12. Di Palma E, Gasparini G, Pelo S, Tartaglia GM, Chimenti C.
Activities of masticatory muscles in patients after orthog-nathic surgery.J Craniomaxillofac Surg. 2009;37:417–420. 13. Goto TK, Nishida S, Yahagi M, et al. Size and orientation of
masticatory muscles in patients with mandibular laterog-nathism.J Dent Res. 2006;85:552–556.
14. Kwon TG, Lee KH, Park HS, Ryoo HM, Kim HJ, Lee SH. Relationship between the masticatory muscles and mandib-ular skeleton in mandibmandib-ular prognathism with and without asymmetry.J Oral Maxillofac Surg. 2007;65:1538–1543. 15. Kiliaridis S, Mahboubi PH, Raadsheer MC, Katsaros C.
Ultrasonographic thickness of the masseter muscle in growing individuals with unilateral crossbite.Angle Orthod. 2007;77:607–611.
16. Iwase M, Sugimori M, Kurachi Y, Nagumo M. Changes in bite force and occlusal contacts in patients treated for mandibular prognathism by orthognathic surgery. J Oral Maxillofac Surg. 1998;56:850–855.
17. Ellis E III, Throckmorton GS, Sinn DP. Bite forces before and after surgical correction of mandibular prognathism. J Oral Maxillofac Surg. 1996;54:176–181.
18. Harada K, Kikuchi T, Morishima S, Sato M, Ohkura K, Omura K. Changes in bite force and dentoskeletal morphology in prognathic patients after orthognathic surgery.Oral Surg Oral Med Oral Pathol Oral Radiol Endod. 2003;95:649–654. 19. Haraguchi S, Takada K, Yasuda Y. Facial asymmetry in
subjects with skeletal Class III deformity. Angle Orthod. 2002;72:28–35.
20. Park SH, Yu HS, Kim KD, Lee KJ, Baik HS. A proposal for a new analysis of craniofacial morphology by 3-dimensional
computed tomography. Am J Orthod Dentofacial Orthop.
2006;129:e623–e634.
21. Naser-ud-Din S, Thoirs K, Sampson WJ. Ultrasonography, lateral cephalometry and 3D imaging of the human masseter muscle.Orthod Craniofac Res. 2011;14:33–43.
22. Trawitzki LV, Dantas RO, Elias-Junior J, Mello-Filho FV. Masseter muscle thickness three years after surgical correction of class III dentofacial deformity.Arch Oral Biol. 2011;56:799–803.
23. Throckmorton GS, Buschang PH, Ellis E III. Improvement of maximum occlusal forces after orthognathic surgery.J Oral Maxillofac Surg. 1996;54:1080–1086.
24. Throckmorton GS, Ellis E III. The relationship between surgical changes in dentofacial morphology and changes in maximum bite force.J Oral Maxillofac Surg. 2001;59:620–627.