This work is licensed under a Creative Commons Attribution 4.0 License. For more information, see https://creativecommons.org/licenses/by/4.0/
VOLUME XX, 2020 1
Date of publication xxxx 00, 0000, date of current version xxxx 00, 0000. Digital Object Identifier 10.1109/ACCESS.2017.Doi Number
A Frame-level Constant Bit-Rate Control using
Recursive Bayesian Estimation for Versatile
Video Coding
Myung Han Hyun1,2, Bumshik Lee3, Member, IEEE, and Munchurl Kim1, Senior Member,
IEEE
1School of Electrical Engineering, Korea Advanced Institute of Science and Technology, Daejeon 34141, Republic of Korea 2Agency for Defense Development, Daejeon 34186, Republic of Korea
3Department of Information and Communications Engineering, Chosun University, Gwangju 61452, Republic of Korea Corresponding author: Munchurl Kim (e-mail: [email protected]).
This research was supported by the MSIT (Ministry of Science and ICT), Korea, under the ITRC (Information Technology Research Center) support program (IITP-2020-2016-0-00288) supervised by the IITP (Institute for Information & communications Technology Promotion).
ABSTRACT In this paper, we present a frame-level constant bit-rate (CBR) control method using recursive Bayesian estimation (RBE) for Versatile Video Coding (VVC). An R-λ model for rate control (RC) has handled the total texture and non-texture bits at a time and has worked reasonably well in High Efficiency Video Coding (HEVC). Nevertheless, if the rate estimation is inaccurately performed, that is, the R and λ values for a current frame cannot be linearly modeled with their respective values in the previous frames, the resulting RC performance is degraded. In our work, we adopt the RBE which alternates prediction and update steps not only to precisely estimate the rates, but also to allocate target bits based on the changes in the distortions of the previously coded frames, thus considering the rates and distortions simultaneously. Therefore, an elaborate RC can be performed especially at fluctuating frame complexities. Experimental results show that our RC method outperforms the RC of VVC Test Model (VTM-5.0) in terms of normalized root mean square error (NRMSE) with maximum (average) 34.95% (12.35%) improvement, and maintains higher visual quality consistency in terms of standard deviation of PSNR by 33.07% (22.34%) improvement for All Intra (AI), maximum (average) 44.82% (27.29%) and 22.54% (9.50%) for Low Delay (LD), and maximum (average) 47.35% (39.94%) and 30.35% (18.54%) for Random Access (RA), respectively, compared to the default RC method of the original VTM-5.0.
INDEX TERMS Rate control (RC), Bit allocation (BA), Rate and distortion (R-D) models, Recursive Bayesian estimation (RBE), and Versatile video coding (VVC).
I. INTRODUCTION
ecently, Joint Video Exploration Team (JVET) of ITU-T Video Coding Experts Group (VCEG) and ISO/IEC Moving Picture Expert Group (MPEG) have been developing the Versatile Video Coding (VVC) standard [5] beyond its predecessor, the High Efficiency Video Coding (HEVC) standard [6]. Various and novel video coding technologies such as Coding Tree Unit (CTU) structure, intra/inter prediction, transforms, in-loop filtering, entropy coding, etc. [7] are devised and tested in a VVC Test Model (VTM) platform [1].
An R-Q (rate-quantization) model such as the Laplacian mixture model (LMM) [8-11] has increased the rate estimation performance in HEVC [6]. However, our previous
work [12] demonstrated that the LMM is less effective for R-D estimation when applied for VVC Test Model (VTM-5.0) [1] compared to the HM [13]. This is because the residues are obtained in various-sized CUs of deeper depths (maximum 9-level depth) in VVC become more complicated problems than those (maximum 4-level depth) in HEVC. Although an R-λ model [2-4] adopted in HM worked reasonably well and less complex than the LMM, the R-D estimation performance would be degraded unless the R and λ values for a current frame cannot be linearly modeled with their respective values in the previous frames. Also, since VVC has more flexible coding structures, some predefined model parameters of the R-λ model used in HEVC might be no longer effective for VVC [14].
In our previous work [12], we showed that our recursive nonlinear estimation on the probability density function (pdf) of particles (rates) via a Bayesian theorem and a sequential importance resampling (SIR) algorithm was effective in enhancing the R-D estimation performance. In this work, we present an R-λ model-based RC that relies on our previous stochastic framework for rate estimation. As a result, more precise RC is obtained which yields robust rate estimation and less-fluctuating visual quality over frames. The contribution of our work is summarized as follows:
(i) We utilize a reliable and robust rate estimation method based on a recursive Bayesian estimation (RBE) scheme [12] to stochastically estimate the rates for the next frames to be encoded. The RBE-based rate estimation not only utilizes the real rates of previously encoded frames but also considers their distortions so that more elaborate RC can be performed especially with fluctuating frame complexities.
(ii) Our RC method is comprehensively applied for All Intra (AI), Low Delay (LD), and Random Access (RA) configurations, and shows the effectiveness of rate control by reducing the PSNR fluctuations and by utilizing the estimated rates by the RBE for bit allocation which can effectively replace the default rate estimation of the R-λ model in the RC of the original VTM-5.0 [1]. The remainder of the paper is organized as follows: In Section II, we address the related works on R-D models for RC and bit allocation (BA) used for previous video coding standards; In Section III, our proposed method is described in details; In Section IV, experimental results are presented, and Section V concludes our work.
II. RELATED WORKS
A. RATE CONTROL (RC)
In video streaming and transmission, rate control (RC) is a crucial issue for practical applications. Thus, various RC algorithms have been thoroughly studied and implemented into various video coding standard reference models such as Test Model (TM) 5 of MPEG-2 [15], Verification Model (VM) 8 of MPEG-4 [16], Joint Model (JM) of H.264/MPEG-4 Advanced Video Coding (AVC) [17] and HEVC Test Model (HM) of HEVC [2, 6, 13].
For H.264/MPEG-4 AVC [17], Jing et al. considered an average gradient per pixel of the frame for enhancing the prediction accuracy of a quantization parameter (QP) to be applied for encoding [18]. Yan et al. utilized distortions by taking an image complexity for better intra-frame rate estimation [19]. Chang et al. proposed joint RC for a hybrid coder using gradient-based R-Q and D-Q models [20]. For HEVC [6], Karczewicz et al. have taken into account the sum of absolute transformed differences (SATD) as a complexity measure for the R-λ model [21]. Wang et al. applied gradient terms for the scene complexity to determine a new R-λ model to increase the rate estimation performance for RC [22]. Gao et al. improved the R-D performance through the optimized CTU-level BA using a structural
similarity (SSIM)-based game theory approach [23]. Although it seems fancy and reasonable, it entails high computational complexity. In order to reduce both the bit-rate and visual quality fluctuations, many methods have been studied that aimed at maintaining the visual quality consistency over frame evolutions [10, 24-26]. Recently, for VVC [5], a new quality dependency factor is derived in accordance with temporal layer for rate control [53-55]. In addition, a quadratic R/D model is proposed especially for intra frame rate control [56].
B. BIT ALLOCATION (BA) OPTIMIZATION
In order to improve the R-D performance for RC, various bit allocation optimization schemes have been studied [4, 23, 27-30]. In particular, Li et al. formulated an optimization problem to minimize the average distortion MINAVE [4]. By solving the optimization problem with a quality dependency constraint, they theoretically explained different λ values of the R-D cost function should be considered for every frame. Also, with temporal levels of LD and RA configurations, the BA process was conducted by weighted λ values to reduce the computational complexity [31]. The aforementioned BA process was implemented into the HM [13].
Chen et al. utilized a bi-section algorithm to explore an optimal λ value for a CTU-level RC and BA [28]. Li et al. proposed an algorithm to get a λ value for the CTU-level RC and BA with a closed-form equation via Taylor expansion [27]. Also, Guo et al. extended the algorithm into a frame-level RC and BA [29]. Fiengo et al. utilized a forward-backward primal-dual (FBPD) algorithm to solve the optimization problem for its recursive R-D model [32]. In addition, to boost up the efficiency of the CTU-level bit allocation, a game theory approach is taken [23]. Also, a machine learning-based technique is considered for improving the prediction accuracy of the R-D model [30].
C. R-D MODELS
The rate and distortion (R-D) models are importantly used to help generating adequate bits for RC where many R-D models have been studied [2, 3, 8-12, 18, 20, 22, 25, 26, 28, 30, 33-39].
1) R-Q MODELS
From the information theory, a closed-form solution for rate and distortion function can be derived [40]. In VM 8 of MPEG-4 [16], the rate and distortion function for residues of Laplacian pdf is expanded by the Taylor series such that a quadratic rate model is formulated as [33]:
1 2
R=aQ− +bQ− (1) where a and b refer to model parameters according to video content characteristics, Q indicates a QP, and R is a target bit amount for a certain coding level. Previously, in order to increase the rate estimation accuracy of the former video coding standards such as H.264/MPEG-4 AVC [17] and HEVC [6], several studies exploited the gradients of pixel intensities [18-22]. Also, various pdf models for transform coefficient (TC) values such as Laplacian, Cauchy, and
This work is licensed under a Creative Commons Attribution 4.0 License. For more information, see https://creativecommons.org/licenses/by/4.0/ Gaussian were investigated to increase the R-Q models’
accuracy [37, 41]. As a special case of the R-Q models, ρ, a percentage for quantized transform coefficients (QTC) of zeros from the pdf model of TC values is utilized as a linear function. It is called an R-ρ model as [36]:
(1 )
R= ⋅ −
θ
ρ
⋅N (2) where 1-ρ indicates a percentage of non-zero QTC in a frame, θ is a model parameter, and N indicates a total number of pixels in the frame.2) R-Q MIXTURE MODELS
Several schemes for an R-Q mixture model were developed by exploiting the different characteristics of pdfs in various CU depth levels [8-11]. The R-Q mixture model is expressed as a multiple mixture model of Laplacian function:
1 0 ( ) , 2 CU i N x i X i i f x p
φ
e φ x − − = =∑
∈ℜ (3) where x represents TC values, pi is the portion of pixels inthe i-th CU depth per frame, NCU is the total number of CU
depth levels (= 4 for HEVC), φ is the Laplacian model i parameter as 2 σ , where i σi is the standard deviation of
TC values in the i-th CU depth per frame, and ℜ is the set of real numbers. It is demonstrated that multiple R-Q models can be better fitted to the pdfs of actual TC values [8-11]. Gao et al. proposed a synthesized pdf model by minimizing the Kullback-Leibler divergence, and then the synthesized pdf model is collaborated with the R-ρ model to increase the R-D estimation accuracy [35].
Since the conventional R-Q models rarely deal with the non-texture bits, the rate estimation performance is decreased. In order to overcome these problems, texture and non-texture bits are separately estimated by their own models [9, 11]. It worked reasonably in HEVC, however, it is computationally burdensome since the coding depth levels are highly increased in VVC. Moreover, the computational complexity is significantly increased when the LMM with the radial basis function (RBF) network is used for R-D performance improvement [11].
3) R-λ MODELS
The conventional R-Q models developed for MPEG-2 [15], MPEG-4 [16], and H.264/MPEG-4 AVC [17] suffer from imprecise rate estimation performance as the video coding technologies get advanced. In HEVC [6], since encoded bits are influenced by the various coding parameters of intra and inter modes, a QP is not the only critical factor determining the amount of resulting bits compared to the previous video coding such as H.264/MPEG-4 AVC [17]. Instead of the R-Q models, several ideas regarding the relation between the QP (or rate) and a Lagrangian multiplier λ that represents the slope of the R-D curve were proposed [2, 3, 42]. From the viewpoint of rate-distortion optimization (RDO) [43], the distortion (D) should be minimized such that the rate (R) is less than a given bit budget (Rb) as:
minD s.t. R≤Rb (4)
Via the Lagrange multiplier method [44], (4) can be expressed by an unconstrained problem as:
( b)
J =D+ ⋅
λ
R−R (5) where J is an R-D cost function and λ is the Lagrangian multiplier. Moreover, Mallet et al. verified that the R-D curve can be expressed as a rectangular hyperbolic function as [45]:( )
D R = ⋅
ϕ
R−γ(6) where φ and γ are model parameters, and γ remains of the order of 1. It is also demonstrated that the rectangular hyperbolic function is more suitable than the exponential function [3]. Since the R-D curve is convex, it is differentiable. Thus, (6) can be rewritten as:
1
.
D R R γ
λ
= − ∂ ∂ =ϕγ
− − (7)From (7), we have an R-λ model as: Rβ
λ α
= ⋅ (8) where α and β indicate parameters of the R-λ model. It should be noted that R in (8) contains bits for both texture and non-texture, while R in (1) only contains the texture bits. Owing to the precise R-D modeling performance, the R-λ model-based RC algorithm has been adopted into the HM [2, 3, 6, 13]. However, the model parameters in (8) are estimated by a previously coded data such that the R-D modeling performance is likely to be degraded when the characteristics of previously coded data are nonlinear.III. PROPOSED FRAME-LEVEL CONSTANT BIT-RATE CONTROL USING RECURSIVE BAYESIAN ESTIMATION
In order to make an elaborate rate control for VVC by overcoming the various shortcomings of previous R-D models, we propose a frame-level constant bit-rate control using RBE. To be self-contained, we briefly review the basic concept of the RBE used for our frame-level constant bit-rate control in the following.
A. RECURSIVE BAYESIAN ESTIMATION (RBE)
A recursive Bayesian estimation (RBE) can be used for various applications of signal processing, control and dynamical systems, computer vision, and robotics to estimate a system information such as states, model parameters, and so on [46]. The Bayesian theorem [47] is utilized for a Bayesian estimation to construct a posterior probability density of the state from all the measurements given an initial prior probability density. In the RBE, two steps (prediction and update steps) are needed basically to perform the estimation. In the prediction step, a state evolution probability is used to predict a prior probability density while, in update step, both the prior probability density and a measurement data are used to obtain the posterior probability density. Through these two alternate steps, an optimal estimate can theoretically be found in accordance with several criterions such as means, modes, medians, and so on [46]. In addition, the estimation accuracy can be measured in terms of covariance.
1) BAYESIAN ESTIMATION
Estimation procedures collect the information of parameters for a random vector x, defined as a state, from a random vector y which is often obtained from an imprecise (or noisy) measurement equipment or random modeling. Usually, x is assumed having a known prior probability density p x( ). According to the Bayesian rule, as y is measured, the knowledge of parameters for x is changed as [47]:
( | ) ( | ) ( ) ( )
p x y = p y x p x p y (9) where the posterior probability density p x y( | ) after receiving y represents everything about the parameters of x , and the denominator ( )p y is a scalar positive constant that can be found by marginalization as [47]:
( ) ( | ) ( ) .
p y = ∫p y x p x dx (10) Thus, we only consider the numerator ( | ) ( )p y x p x in (9) to solve p x y( | ) . Several estimates for the Bayesian estimation are found via a conditional mean estimate (ME) and maximum a posteriori (MAP) as [46]:
ˆME ( | )
x = ∫xp x y dx (11) ˆMAP arg max ( | )
x
x = p x y (12) where ˆxME and xˆMAP are the scalar estimates of ME and MAP.
2) RECURSIVE ESTIMATION
State evolutions occur for each time sequence via the Markov process with an initial state x0 p x( 0) in a recursive estimation process. A state transition (or prior) probability density can be expressed as [46]:
1
( k | k), 0,1,
p x+ x k= (13) where x is the state vector at time instant k. Since it is k often assumed that the measurement vector yk is conditionally independent of the previous measurement vectors (y y1, 2,,yk−1) given the current state x , a k likelihood probability density is described as [46]:
( k| k), 0,1, .
p y x k= (14) Both of the transition and likelihood probability density
models in (13) and (14) rely on time instant k. In addition, the relationship between (13) and (14) can be described as a hidden Markov model (HMM) [48]. In HMM, the states are hidden (to be estimated), but the measurements dependent on the states are visible. Fig. 1 shows a flowchart of a HMM. As shown in Fig. 1, the state transition and likelihood probability density models are described via the first-order Markov process and measurements dependent on the states, respectively. By the HMM and Bayesian theorem in (9), the posterior probability density can be inferred. More specifically, by adopting the Bayesian and recursive estimations alternately, the conceptual solution for RBE can be obtained. Based on the assumption that the state evolution x is the Markov process and k xk+1 is independent of y when k x is given. Thus, we have k
1 1 1 ( , | ) ( | , ) ( | ) ( | ) ( | ). k k k k k k k k k k k k p x x y p x x y p x y p x x p x y + + + = = (15) By integrating both sides of (15) with respect to x , we k have the following Chapman-Kolmogorov identity [49]:
1 1
( k | k) ( k | k) ( k| k) k.
p x+ y = ∫p x+ x p x y dx (16) Eq. (16) is the prediction step where the prior probability density is estimated in the Bayesian recursion. In order to find the posterior probability density (p xk|yk), we apply the Bayesian theorem in (9) to the measurement vector y k based on a conditional independence assumption on y in k (14), which results in:
1 1 1 1 1 ( | ) ( | , ) ( | ) ( | ) ( | ) ( | ) ( | ) k k k k k k k k k k k k k k k p x y p y x y p x y p y y p y x p x y p y y − − − − − = = (17)
where (p yk|xk) and p x( k|yk−1)indicate the likelihood and prior probability densities in (14) and (16) at time k, respectively, and p y( k |yk−1)= ∫p y( k|x p xk) ( k|yk−1)dxk is a normalizing constant value [50]. Eq. (17) is referred to as the update step in the Bayesian recursion. According to (16) and (17), the prior and posterior probability densities can be alternately updated to enhance the prediction 1
k
x − xk xk+1
: first-order Markov process
1 k y − yk yk+1 1 ( k| k ) p x x− ( k| k)
p y x : measurement dependent on the states measurements
(observed)
states
(hidden)
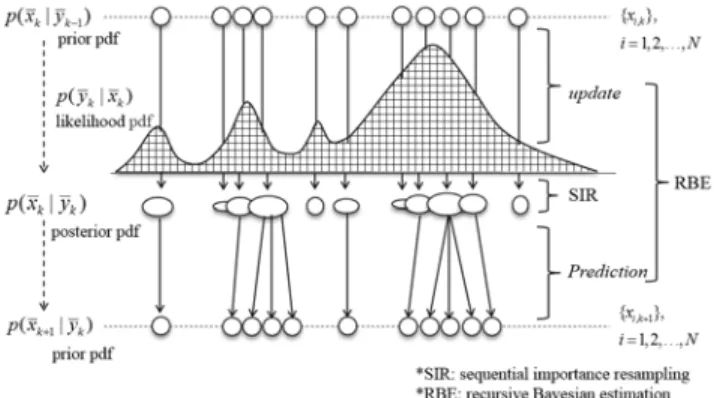
FIGURE 1. A flowchart of a hidden Markov Model (HMM). xk and yk
refer to a state random vector in (13) and a measurement random vector in (14), respectively.p x( k|xk−1) and p y( k|xk) indicatea state transition probability density in (13) and a likelihood probability density in (14), respectively.
FIGURE 2. An illustration of a particle filtering concept. xk and yk indicate a state vector in (13) and a measurement vector in (14), respectively. p x( k|yk−1)andp x( k+1|yk)refer to the prior pdf in (16) at time k and time k+1, respectively. p y( k|xk) and p x( k|yk)represent the likelihood pdf in (14) and the posterior pdf in (17), respectively.
This work is licensed under a Creative Commons Attribution 4.0 License. For more information, see https://creativecommons.org/licenses/by/4.0/ accuracy. Moreover, scalar point estimates, such as ME and
MAP, and estimation error covariance C based on ( k| k) p x y are expressed as [46]: , ˆk ME k ( k| k) k, x = ∫x p x y dx (18) ,
ˆk MAP arg max ( k| k), xk x = p x y (19) ˆ ˆ ( )( )T ( | ) . k k k k k k k C=∫ x −x x −x p x y dx (20) In spite of the theoretical optimal solution of the RBE to compute (p xk|yk), (17) is not a practical solution due to the intractable integrals with the infinite representations of pdfs for prior and posterior.
3) PARTICLE FILTERING
Particle filtering (PF) obtains an estimate value (e.g., an updated mean, model parameters) based on point (particle) mass representations of probability densities by applying the Bayesian theorem [46, 50, 51]. It is very advantageous for the particle filtering that any distribution of randomly sampled particles can be applied to its robust SIR algorithm to have the estimate value whereas other conventional methods require predefined distribution functions [46]. Thus, the particle filtering can be widely used for various applications such as terrain-aided navigation, economic forecasting, statistical signal processing [46, 50, 51]. Our previous work treated the rates and distortions as random variables whose pdf forms are unknown, and applied the PF for the R-D estimations in VVC for the first time [12].
Fig. 2 illustrates a particle filtering concept. As shown in Fig. 2, the RBE is performed via the SIR algorithm to have the posterior probability density p x( k|yk) in (17). The prior probability density p x( k|yk−1) at time k in (16) and the likelihood probability density (p yk |xk) in (14) are plugged into (17), which is called the update step to have
( k| k)
p x y . Then, ( | )p xk yk is plugged back into (16), which is called the prediction step to have the prior probability density p x( k+1|yk) at time k+1. Therefore, the alternate operations between the update step and the prediction step increase the prediction accuracy of particle filtering. Detailed mathematical definitions and descriptions of the SIR algorithm for particle filtering can be found in our previous work [12].
B. PROBLEM FORMULATION
As mentioned in Section I, rate control algorithms using the LMM-based R-Q model is problematic when R-D estimation is not precisely performed in VVC [5] that has a deeper coding structure than HEVC [6]. Moreover, rate estimation (RE) performance of the R-λ model is degraded if the respective linearities among λ and bpp values are not maintained. In order to cope with these problems, we formulate the RE problem as:
( )
(
max)
(
)
(
min)
arg min s.t. ( ) opt RT R D R D R D R λ λ λ λ = − ≤ ≤ (21)where RT indicates a proposed target bit amount per-frame,
and R(λ) and D(R(λ)) indicate a rate and a distortion of the R-λ model, respectively. It is noted that D(∙) indicates the distortion function in (6). Rmin and Rmax are the minimum
and maximum allowances of rates, respectively, to prevent a buffer from overflowing and underflowing. λopt represents
an optimal value to be found in the R-λ model, which can be solved by certain optimization techniques.
Our previous work [12] showed that the rate and distortion values are obtained quite in random due to various spatial and temporal complexities of the input video sequences. Thus, the rate and distortion values can be regarded as random variables, so being modeled by a certain pdf. Therefore, we propose an RBE-based stochastic framework in Section-III-A that simply predicts RT to solve
the formulated problem in (21) without additional computation for an optimization technique.
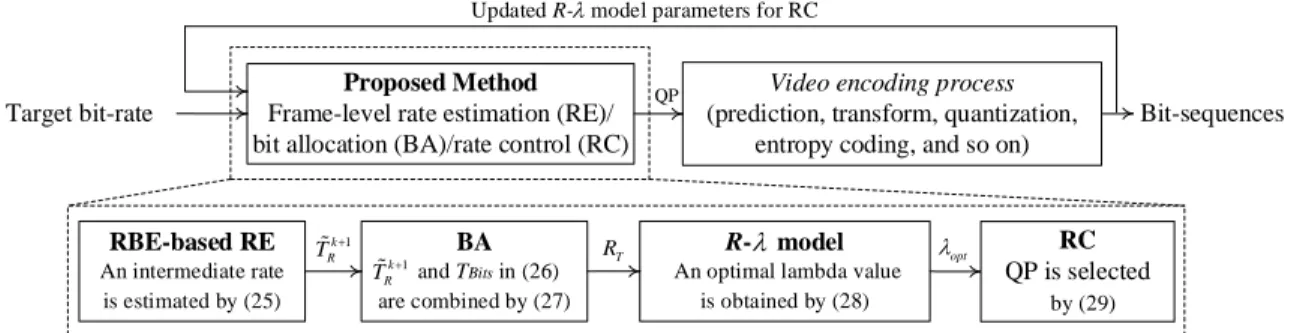
B. FRAME-LEVEL RATE ESTIMATION (RE), BIT ALLOCATION, AND RATE CONTROL USING RECURSIVE BAYESIAN ESTIMATION
Fig. 3 describes an overview of our proposed frame-level RE, BA, and RC using RBE. Initially, a target bit-rate for RC is set as input to our algorithm. The proposed frame-level RE using RBE estimates an intermediate rate, k 1
R
T + which can not only improve the rate estimation accuracy but also be effectively used for our BA process. Then, a proposed target bit amount per-frame RT is calculated by our RBE for BA
process so that RT can be applied for the R-λ model [2-4] to
Proposed Method
Frame-level rate estimation (RE)/ bit allocation (BA)/rate control (RC)
Video encoding process
(prediction, transform, quantization, entropy coding, and so on)
RBE-based RE An intermediate rate is estimated by (25) BA and TBits in (26) are combined by (27) R- model
An optimal lambda value is obtained by (28) Target bit-rate 1 k R T+ RC QP is selected by (29) T R λopt 1 k R T+ Bit-sequences QP
Updated R- model parameters for RC
λ
λ
FIGURE 3. An overview of the proposed frame-level rate estimation (RE), bit allocation (BA), and rate control (RC) using RBE. k1 R
T + is an intermediate rate by the proposed RE, RT is the target bit amount per-frame by the proposed BA, TBits is the target bit amount per-frame by the frame-level BA in [1],
λopt is an optimal value of the R-λ model [2-4], and QP is a quantization parameter.
VOLUME XX, 2020 5
determine λopt. Then, λopt is used for selecting an appropriate
QP. Finally, the selected QP is utilized for our video encoding process. The details of our proposed method are described in the following sub-sections.
1) PROPOSED FRAME-LEVEL RATE ESTIMATION USING RBE
Our RE method utilizes the RBE by considering a distortion variation. The distortion variation between two encoded frames is defined as:
(
)
/k k k n k n
MSE γ MSE MSE− MSE−
∆ = ⋅ − (22)
where MSE and k MSEk n− are the mean square error in frame k and k-n, respectively, and γ is a control parameter for the rate adjustment, which is empirically set to 0.3 for our experiments. Also, n is empirically set to 2 which yields an appropriate variation for distortion to properly respond to the dynamics of distortions during the RE. Also, we used empirically found values, γ = 0.3 and n = 2 for all test sequences and QPs (= 22, 27, 32, and 37), which reasonably work well.
For the practical implementation of RBE, by regarding the rates as random variables of unknown pdfs, the SIR algorithm in our previous work [12] is exploited. Initially, we randomly generate N (= 150) rate particles whose vector form is rk at frame k from a normal distribution with mean (= 0) and standard deviation (= 0.1). In addition, initial particle weights for rk are set to 1/N. Then, the prediction and update steps in (16) and (17) are performed alternately. Furthermore, the weights adjusting and normalizing processes for particles are performed by the update steps using measurement data (= actual encoded bits or distortions) [12]. For this, the RBE is able to stably estimate the rates even though it relies on a stochastic framework. So, the rate particles are propagated to the next frame k+1 as:
1 [1 1 1] T
k k k k
N
r+ =R ⋅ + ∆MSE ⋅r (23) where Rk is the actual scalar rate of frame k after video
coding and ∆MSEk is the variation of distortion in (22). After propagating the rate particles r to frame k+1, the rate k particles rk+1 are resampled for N times according to
1 1( 1)
i
k k k
r+ =g + r+ where i 1( )
k
g + ⋅ is the sampling function that randomly samples the i-th particle ri k, +1 with replacement at frame k+1. Then, the weights (or probabilities) of rk+1 are normalized as:
1 , 1 ( , 1) ( , 1) , 1, 2, ..., N j i k i k j k s + =p r + ∑ = p r + i= N (24) where p r(k+1) is the pdf of 1 k
r+ . By inner product with 1
k
r+ and sk+1, the intermediate rate estimate for frame k+1 via the RBE considering ∆MSEk can be obtained as:
1 1 1 k R k k T + =s+ ⋅r+ (25) where 1 k
r+ and sk+1 are the rate particles in (23) and their weights in (24) at frame k+1, respectively.
2) PROPOSED FRAME-LEVEL BIT ALLOCATION AND RATE CONTROL
In the R-λ model-based RC, the target bit amount per-frame for the frame-level BA is defined as [1]:
(
)
(
)
Bits TBL TBF Left
T = R −R ⋅ N −SW SW (26) where RTBL is a total bit budget, and
TBF BR
R =T FR indicates an average target bit amount per-frame. TBR and
FR indicate a target bit-rate (bits/sec) and a frame-rate (frames/sec). NLeft is a number of frames left, and SW is the
size of a sliding window for bit-rate fluctuation smoothing which is set to 40 [1, 3].
Usually, a bit allocation per-frame is deeply related to the performance of RC since the RC calculates a QP based on the allocated target bits. However, in the R-λ model [2-4], TBits is allocated simply in a mechanical manner in
accordance with a certain frame-complexity measure. Thus, it not only degrades an R-D performance but also fluctuates the visual quality over frames. It is noted that an elaborate optimization technique for BA process is not considered in this work since we rather focus on simplified RC and BA processes. However, if an RBE-based BA is exclusively applied, it causes a buffer underflow and results in the lack of bit resources toward the end of a video sequence. In order to prevent this problem, we restrict the proposed target bit amount per-frame RT by averaging the target bit
amount per-frame TBits in (26) and the intermediate rate
1
k R
T + for frame k+1 by our frame-level RE using RBE in (25). Thus, RT is defined as:
(
1)
2. k
T Bits R
R = T + T + (27) As described in (21), λopt can be solved by certain
optimization techniques such as gradient descent method, bisection method, and so on [28, 44] to calculate QP, which may cause high computational complexity. In order to relieve this, RT in (27) is assumed as a true rate value thanks
to the high RE accuracy in our RBE-based stochastic framework. Thus, (21) is rewritten as:
(
1)
( ) k 2 0
opt Bits R
R λ − T +T + = (28) where (R λopt)is an estimated bit amount by (8). Thus, λopt is obtained by solving (28). In addition, via the relation between R-λ and QP [2, 3, 42], QP is determined as:
( ln( ) )
QP=round c⋅ λ +d (29) where c (= 4.20005) and d (= 13.71220) are empirical constant values [2, 3, 42] and round() indicates the function to round a value to its nearest integer. Then, by substituting λopt into (29), QP can be calculated. In order to prevent
abrupt changes for both λopt and QP, the allowable ranges
are constrained with [λavg⋅2-2/3, λavg⋅22/3] and [QPavg–2,
QPavg+2], respectively [2, 3]. Moreover, the R-λ model
parameters in (8) are updated by the linear update model [3]. It is noted that the same initial model parameters of the R-λ model in HEVC are applied for our experiment.
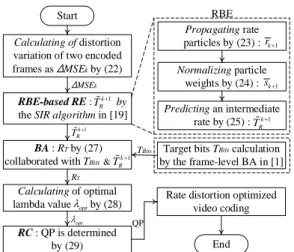
Fig. 4 summarizes a flowchart of frame-level RE, RC and BA schemes using RBE. As shown in Fig. 4, in order to
This work is licensed under a Creative Commons Attribution 4.0 License. For more information, see https://creativecommons.org/licenses/by/4.0/ reflect the R-D characteristics into RC, the distortion
variations of previously encoded frames in (22) is considered. Then, the proposed RE through the SIR algorithm [12] is applied to have the intermediate rate estimate k 1
R
T + for frame k+1. The proposed BA process is performed by achieving the proposed target bit amount per-frame (RT) as an average of
1
k R
T + and TBits according to (27). By using RT, λopt is
calculated by (28). Finally, QP is determined by (29), then the QP is used for our rate distortion optimized video coding.
IV. EXPERIMENTAL RESULTS
A. EXPERIMENTAL SETTINGS
To prove the fidelity of our proposed method for the frame-level RE, BA, and RC using RBE, the proposed RC method is implemented into VVC Test Model reference software (VTM-5.0) [1]. All the experiments are performed under All Intra (AI), Low Delay (LD), and Random Access (RA) configurations using GOP (= 1), GOP (= 4), and GOP (= 8), respectively, with four QP values (22, 27, 32, and 37) in the JVET common test conditions [52]. For an intra frame period, only first frame is an intra picture for AI and LD configurations. The intra frame period is 8 for RA configuration. Rate-distortion optimized quantization (RDOQ) and rate-distortion optimized quantization for transform skip (RDOQTS), context-adaptive binary arithmetic coding (CABAC), and sample adaptive offset (SAO) are activated for use during encoding. The intra coding tools of VTM-5.0 such as multiple transform selection (MTS), low frequency non-separable secondary transform (LFNST), intra sub-partitions (ISP), and matrix-weighted intra prediction (MIP) are activated. Also, fast implementation tools such as FastLFNST, FastMIP, and ISPFast are activated. The maximum width, height, and partition depth of CU are 64, 64, and 4, respectively. The CTU size is 128.
For the experiments, we use nineteen test sequences of seven classes which have different texture characteristics and resolutions (Class A1 (3840×2160), Class A2 (3840×2160), Class A (2560×1600), Class B (1920×1080), Class C (832×480), Class D (416×240), and Class E
(1280×720)), which have been used as the test sequences in VVC development. Note that Class A, Class B, Class C, Class D, and Class E are 8-bit depth sequences, and Class A1 and Class A2 are 10-bit depth sequences. More information on the test sequences is listed in Table I. To evaluate the proposed method for frame-level RE, BA, and RC using RBE, its RE and target bit-rate allocation performances are compared to those of VTM-5.0 with the R-λ model [2-4]. The RE and target bit-rate allocation accuracies are measured by a normalized root mean square error (NRMSE) and bit-rate accuracy (BRA) measure, respectively, which are defined in Section-IV-B. The target bit-rates for each test sequence are determined as the actual bit-rates obtained at four QP values (22, 27, 32, and 37) without the RC activation using VTM-5.0 [1], and are then compared with the encoded bit amounts obtained by the proposed RC method and the VTM-5.0’s RC method [1]. For the evaluation of visual quality consistency over frames, a standard deviation for the PSNR values of all encoded frames σPSNR is used for each test sequence.
B. EVALUATION ON RATE CONTROL AND BIT ALLOCATION
The accuracy for RE is measured in terms of NRMSE. The NRMSE metric [12] is defined as:
2 1 1 ( ( ) ( )) 100 ( ) N k Est k Act k NRMSE avg Act N = − ∑ = ⋅ × (30)
where N (= 100) is the number of coded frames, Est(k) and Act(k) refer to the estimated and actual (true) encoded bits in frame k, respectively, and avg(Act) is the average of actual coded bits over all the frames. Lower NRMSE values indicate higher accuracy in RE. For the accuracy measure of RC, the BRA (%) is used as:
| _ _ | 1 100 _ GT act GT T BR T BR BRA T BR − = − × (31)
where T_BRGT indicates the target bit-rate obtained by the Calculating of distortion
variation of two encoded frames as ΔMSEk by (22) RBE-based RE : by
the SIR algorithm in [19]
BA : RT by (27)
collaborated with TBits & Start Propagating rate particles by (23) : Normalizing particle weights by (24) : sk+1 Predicting an intermediate rate by (25) : k1 R T+
Target bits TBits calculation
by the frame-level BA in [1]
End Calculating of optimal
lambda value by (28)λopt RC : QP is determined by (29) 1 k R T+ TBits
Rate distortion optimized video coding QP ΔMSEk 1 k R T+ RT opt λ 1 k R T+ 1 k r+ RBE
FIGURE 4. A flowchart of frame-level rate estimation (RE), bit allocation (BA), and rate control (RC) schemes using recursive Bayesian estimation (RBE).
TABLEI.Detailed Information of Sequences for Experiments
Sequences Classes Sizes fps Bit- depth No. of frames BlowingBubbles D 416×240 50 8 100 RaceHorses D 416×240 30 8 100 BQMall C 832×480 60 8 100 BasketballDrill C 832×480 50 8 100
Kristin and Sara E 1280×720 60 8 100
FourPeople E 1280×720 60 8 100 Cactus B 1920×1080 50 8 100 ParkScene B 1920×1080 24 8 100 BasketballDrive B 1920×1080 50 8 100 BQTerrace B 1920×1080 60 8 100 Kimono B 1920×1080 24 8 100 Traffic A 2560×1600 30 8 100 People on Street A 2560×1600 30 8 100 Tango2 A1 3840×2160 60 10 100 FoodMarket4 A1 3840×2160 60 10 100 Campfire A1 3840×2160 30 10 100 CatRobot1 A2 3840×2160 60 10 100 ParkRunning3 A2 3840×2160 50 10 100 DaylightRoad2 A2 3840×2160 60 10 100 VOLUME XX, 2020 7
VTM-5.0 without RC, and T_BRact is the actual encoded
bit-rate by the VTM-5.0 with our proposed RC method (R-λ model with our RBE for BA) and the one with the default RC method (conventional R-λ model [2-4]). Greater BRA values indicate higher accuracy in RC.
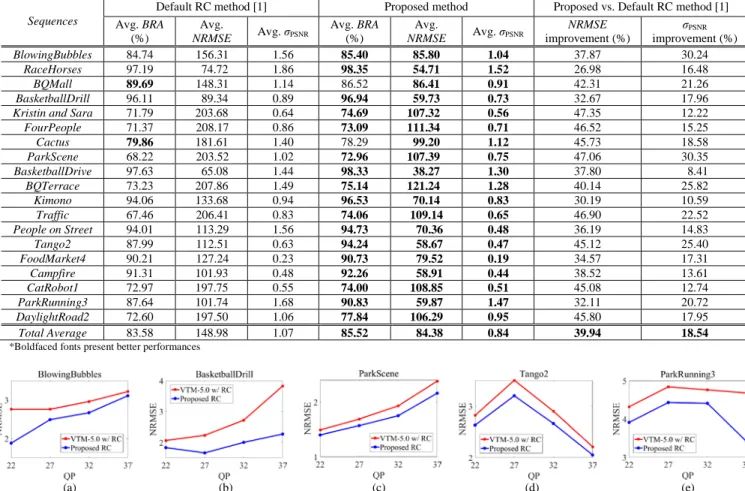
Table II, Table III, and Table IV show the average BRA (%), NRMSE, and σPSNR performances for the proposed RC
method implemented in VTM-5.0 and the default RC method of the original VTM-5.0 for AI, LD, and RA configurations, respectively. It is noticed that lower NRMSE and σPSNR values indicate more precise estimates
for the actual (true) rates and more consistent visual quality. As shown in Table II, Table III, and Table IV, our proposed
RC method outperforms the default RC method of the original VTM-5.0 for AI, LD, and RA by 34.95% (12.35%), 44.82% (27.29%), and 47.35% (39.94%) improvements in terms of maximum (average) NRMSE, respectively, and shows better visual quality consistency for AI, LD, and RA by 33.07% (22.34%), 22.54% (9.50%), and 30.35% (18.54%) improvements, respectively, in terms of maximum (average) σPSNR, compared to the default RC
method. The average BRAs of the proposed and default RC methods are 99.89% and 99.91% for AI, 97.50% and 98.03% for LD, and 85.52% and 83.58% for RA, respectively. Finally, it is worthy to note that BRA is measured after encoding the total frames for each sequence
TABLE II. Average BRA, NRMSE and σPSNR performances for the proposed RC method and the default RC method of the original VTM-5.0 [1] under AI
Sequences
Default RC method [1] Proposed method Proposed vs. Default RC method [1] Avg. BRA (%) Avg. NRMSE Avg. σPSNR Avg. BRA (%) Avg. NRMSE Avg. σPSNR NRMSE improvement (%) σPSNR improvement (%) BlowingBubbles 99.74 2.69 0.44 99.53 2.37 0.36 12.27 27.69 RaceHorses 99.74 3.30 0.34 99.74 2.66 0.22 19.10 33.07 BQMall 99.90 2.06 0.24 99.92 1.75 0.18 15.86 22.24 BasketballDrill 99.83 2.71 0.16 99.80 1.94 0.12 25.98 24.44
Kristin and Sara 99.91 1.74 0.07 99.87 1.64 0.05 6.10 23.51
FourPeople 99.92 1.52 0.07 99.93 1.41 0.05 7.23 26.50 Cactus 99.98 1.29 0.07 99.98 1.17 0.05 10.09 21.71 ParkScene 99.99 1.81 0.06 99.98 1.65 0.04 8.46 30.71 BasketballDrive 99.97 4.99 0.82 99.88 4.45 0.56 27.62 9.61 BQTerrace 100.00 1.01 0.17 99.91 0.92 0.14 10.97 17.24 Kimono 99.96 1.82 0.14 99.96 1.72 0.13 4.95 12.91 Traffic 99.98 1.39 0.07 99.98 1.27 0.07 8.18 12.73 People on Street 99.99 1.93 0.13 99.98 1.84 0.10 4.54 22.45 Tango2 99.95 2.39 0.07 99.92 2.11 0.06 11.45 9.45 FoodMarket4 99.77 6.63 0.42 99.96 2.40 0.37 34.95 15.06 Campfire 99.99 3.61 0.38 99.97 2.92 0.33 13.36 12.70 CatRobot1 99.98 1.65 0.09 99.99 1.52 0.07 8.21 27.62 ParkRunning3 99.98 4.65 0.41 100.00 4.04 0.29 13.11 29.13 DaylightRoad2 99.63 3.92 0.07 99.68 3.57 0.05 10.18 27.76 Total Average 99.91 2.69 0.22 99.89 2.18 0.17 12.35 22.34
*Boldfaced fonts present better performances
TABLE III. Average BRA, NRMSE and σPSNR performances for the proposed RC method and the default RC method of the original VTM-5.0 [1] under LD
Sequences
Default RC method [1] Proposed method Proposed vs. Default RC method [1] Avg. BRA (%) Avg. NRMSE Avg. σPSNR Avg. BRA (%) Avg. NRMSE Avg. σPSNR NRMSE improvement (%) σPSNR improvement (%) BlowingBubbles 95.19 93.66 1.21 94.57 56.97 0.93 38.74 22.54 RaceHorses 99.43 23.41 1.14 99.28 19.68 1.05 13.49 8.28 BQMall 98.90 27.82 0.94 99.52 16.47 0.86 39.73 8.46 BasketballDrill 98.85 29.70 0.63 98.07 21.51 0.56 23.07 10.67
Kristin and Sara 96.13 117.53 0.53 96.92 43.39 0.45 44.82 15.31
FourPeople 99.70 120.67 0.46 97.52 96.70 0.40 5.06 12.80 Cactus 98.64 23.57 0.54 98.12 17.25 0.50 28.16 6.24 ParkScene 98.23 29.09 0.60 98.23 16.31 0.55 42.95 6.15 BasketballDrive 99.33 27.74 0.95 98.89 22.15 0.82 20.10 13.79 BQTerrace 95.13 98.13 0.51 94.36 59.31 0.47 38.17 8.27 Kimono 98.96 18.76 0.52 98.69 13.98 0.46 23.55 13.59 Traffic 97.19 48.46 0.50 95.89 38.32 0.47 18.65 4.68 People on Street 99.45 10.74 1.03 99.36 8.03 0.98 25.31 4.41 Tango2 95.91 72.39 0.42 94.59 47.86 0.39 23.12 7.25 FoodMarket4 97.84 47.62 0.73 96.76 39.28 0.68 20.60 6.12 Campfire 98.28 28.71 1.02 97.92 18.43 0.89 28.81 11.92 CatRobot1 98.14 50.50 0.42 97.16 26.29 0.38 38.39 8.44 ParkRunning3 99.19 21.79 1.38 99.34 16.68 1.30 21.20 6.03 DaylightRoad2 98.11 32.69 0.49 97.32 24.39 0.45 27.82 5.50 Total Average 98.03 44.00 0.74 97.50 28.38 0.66 27.29 9.50
This work is licensed under a Creative Commons Attribution 4.0 License. For more information, see https://creativecommons.org/licenses/by/4.0/
(a) (b) (c) (d) (e)
FIGURE 5.NRMSE plots for estimated rates by the proposed and default RC methods for five test sequences under AI. (a) BlowingBubbles (416×240), (b) BasketballDrill (832×480), (c) ParkScene (1920×1080), (d) Tango2 (3840×2160), and (e) ParkRunning3 (3840×2160).
(a) (b) (c) (d) (e)
FIGURE 6.NRMSE plots for estimated rates by the proposed and default RC methods for five test sequences under LD. (a) BlowingBubbles (416×240), (b) BasketballDrill (832×480), (c) ParkScene (1920×1080), (d) Tango2 (3840×2160), and (e) ParkRunning3 (3840×2160).
(a) (b) (c) (d) (e)
FIGURE 7.NRMSE plots for estimated rates by the proposed and default RC methods for five test sequences under RA. (a) BlowingBubbles (416×240), (b) BasketballDrill (832×480), (c) ParkScene (1920×1080), (d) Tango2 (3840×2160), and (e) ParkRunning3 (3840×2160).
and its values may not reflect the rate estimation accuracy frame-by-frame. Therefore, the BRA is more worthwhile to be analyzed in conjunction with σPSNR.
These noticeable improvements on rate estimation accuracy and visual quality consistency stem mainly from the capability that the proposed RC method can precisely predict
the intermediate rates by exploiting our stochastic RBE framework. In addition, our RC method is capable of properly allocating the per-frame target bit amount RT by
considering the R-D characteristics in collaboration with the R-λ model [1].
Fig. 5, Fig. 6, and Fig. 7 show the plots of NRMSE for
TABLE IV. Average BRA, NRMSE and σPSNR performances for the proposed RC method and the default RC method of the original VTM-5.0 [1] under RA
Sequences
Default RC method [1] Proposed method Proposed vs. Default RC method [1] Avg. BRA (%) Avg. NRMSE Avg. σPSNR Avg. BRA (%) Avg. NRMSE Avg. σPSNR NRMSE improvement (%) σPSNR improvement (%) BlowingBubbles 84.74 156.31 1.56 85.40 85.80 1.04 37.87 30.24 RaceHorses 97.19 74.72 1.86 98.35 54.71 1.52 26.98 16.48 BQMall 89.69 148.31 1.14 86.52 86.41 0.91 42.31 21.26 BasketballDrill 96.11 89.34 0.89 96.94 59.73 0.73 32.67 17.96
Kristin and Sara 71.79 203.68 0.64 74.69 107.32 0.56 47.35 12.22
FourPeople 71.37 208.17 0.86 73.09 111.34 0.71 46.52 15.25 Cactus 79.86 181.61 1.40 78.29 99.20 1.12 45.73 18.58 ParkScene 68.22 203.52 1.02 72.96 107.39 0.75 47.06 30.35 BasketballDrive 97.63 65.08 1.44 98.33 38.27 1.30 37.80 8.41 BQTerrace 73.23 207.86 1.49 75.14 121.24 1.28 40.14 25.82 Kimono 94.06 133.68 0.94 96.53 70.14 0.83 30.19 10.59 Traffic 67.46 206.41 0.83 74.06 109.14 0.65 46.90 22.52 People on Street 94.01 113.29 1.56 94.73 70.36 0.48 36.19 14.83 Tango2 87.99 112.51 0.63 94.24 58.67 0.47 45.12 25.40 FoodMarket4 90.21 127.24 0.23 90.73 79.52 0.19 34.57 17.31 Campfire 91.31 101.93 0.48 92.26 58.91 0.44 38.52 13.61 CatRobot1 72.97 197.75 0.55 74.00 108.85 0.51 45.08 12.74 ParkRunning3 87.64 101.74 1.68 90.83 59.87 1.47 32.11 20.72 DaylightRoad2 72.60 197.50 1.06 77.84 106.29 0.95 45.80 17.95 Total Average 83.58 148.98 1.07 85.52 84.38 0.84 39.94 18.54
*Boldfaced fonts present better performances
(a) (b) (c)
FIGURE 8.The R-D curves obtained by the VTM-5.0 [1] without RC at QP = 22, 27, 32 and 37, and with the proposed RC method and the VTM-5.0’s default RC method. For the rate control methods, the target bit-rate at each QP value was set to be the average bit-rate of the encoded bits by the VTM-5.0 [1] without RC. (a) FoodMarket4 (3840×2160) under AI, (b) BlowingBubbles (416×240) under LD, and (c) ParkScene (1920×1080) under RA.
(a) (b) (c)
FIGURE 9.PSNR fluctuations over frames for the two RC methods under AI for QP = 37. (a) BasketballDrill (832×480) with a target bit-rate (TBR) of 2,813
kbps, (b) ParkScene (1920×1080) with TBR = 6,565 kbps, and (c) ParkRunning3 (3840×2160) with TBR = 69,558 kbps.
(a) (b) (c)
FIGURE 10.PSNR fluctuations over frames for the two RC methods under LD for QP = 37. (a) BlowingBubbles (416×240) with a target bit-rate (TBR) of
158 kbps, (b) BasketballDrill (832×480) with TBR = 357 kbps, and (c) FourPeople (1280×720) with TBR = 214 kbps.
(a) (b) (c)
FIGURE 11.PSNR fluctuations over frames for the two RC methods under RA for QP = 37. (a) BlowingBubbles (416×240) with a target bit-rate (TBR) of
This work is licensed under a Creative Commons Attribution 4.0 License. For more information, see https://creativecommons.org/licenses/by/4.0/
(a) (b) (c) (d)
FIGURE 12.Subjective visual comparisons with some decoded frames at QP = 37 under AI. (a) Original 72-th frame of Tango2 (3840×2160) (cropped), (b) Original frame (enlarged), (c) Ours (enlarged decoded frame; 38.36 dB), and (d) the default RC method (enlarged decoded frame; 38.28 dB).
(a) (b) (c) (d)
FIGURE 13.Subjective visual comparisons with some decoded frames at QP = 32 under LD. (a) Original 49-th frame of BlowingBubbles (416×240), (b) Original frame (enlarged), (c) Ours (enlarged decoded frame; 30.76 dB), and (d) the default RC method (enlarged decoded frame; 29.35 dB).
(a) (b) (c) (d)
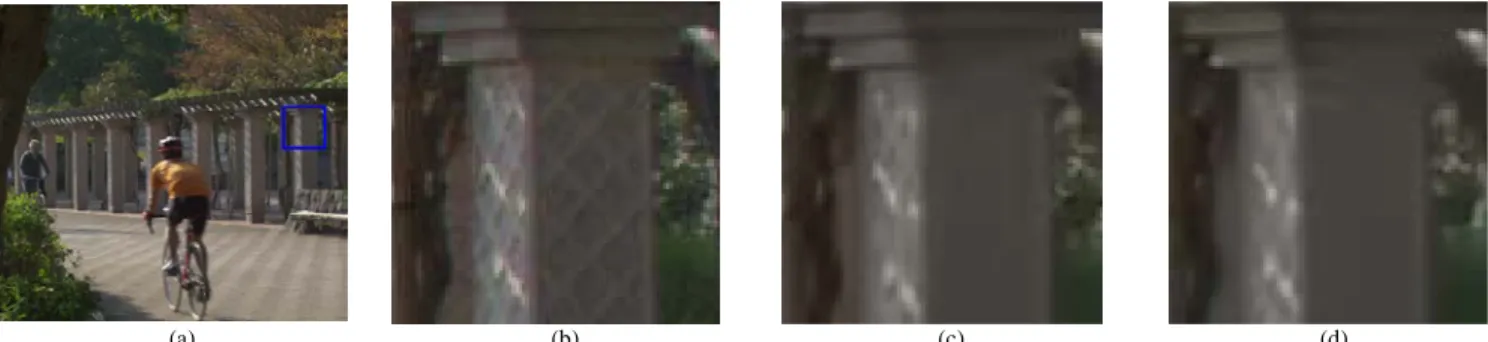
FIGURE 14.Subjective visual comparisons with some decoded frames at QP = 37 under RA. (a) Original 82-th frame of ParkScene (1920×1080) (cropped), (b) Original frame (enlarged), (c) Ours (enlarged decoded frame; 33.70 dB), and (d) the default RC method (enlarged decoded frame; 32.57 dB).
estimated rates by the proposed and default RC methods for five test sequences with AI, LD, and RA configurations. As shown in Fig. 5, Fig. 6, and Fig. 7, the trends of NRMSE curves are almost identical for the both RC methods, but the proposed RC method shows smaller NRMSE values for almost all QP value ranges in our experiment.
Fig. 8 shows the R-D curves obtained by the VTM-5.0 [1] without RC activation, and with the proposed and default RC methods turned on. As shown in from Fig. 8-(a) to Fig. 8-(c), some R-D gains by our RC method are found in particular ranges from QP = 22 to QP = 37, compared to the default RC method. Similar R-D curves are also achieved for other test sequences.
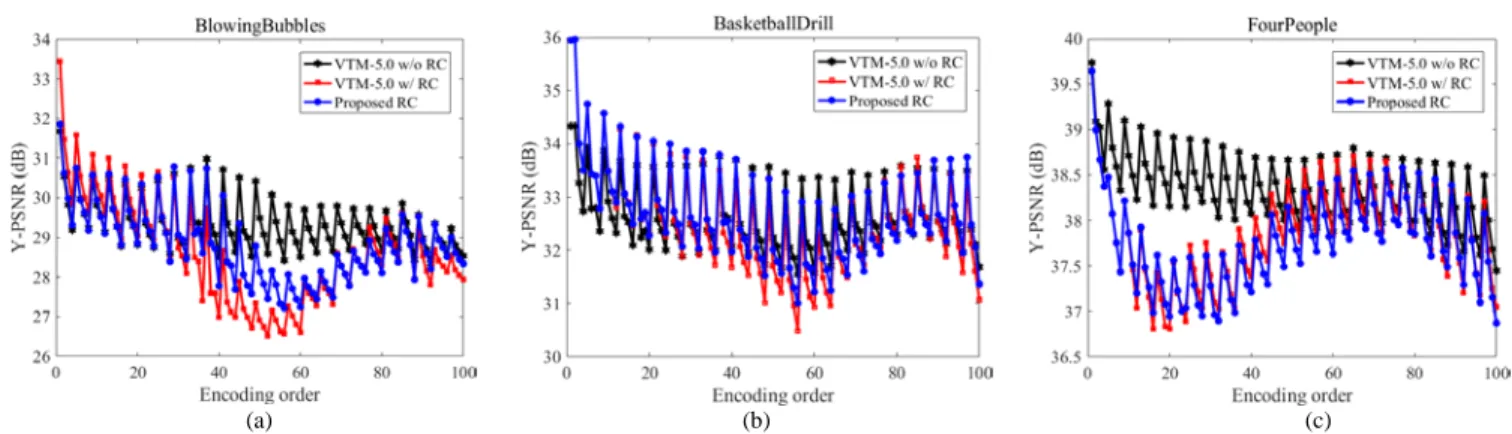
Fig. 9, Fig. 10, and Fig. 11 show the measured per-frame PSNR performances between the two RC methods using AI, LD, and RA configurations respectively for QP = 37. As shown in Fig. 9-(a) and Fig. 9-(c), the proposed RC method tends to yield smoother PSNR curves with smaller
peak-to-valley variations, compared to the default RC method. Especially, the proposed RC method exhibits much less visual quality fluctuation between the 60-th and 100-th frames in Fig. 9-(b). As shown from Fig. (a) to Fig. 10-(c), it is also noticed that the proposed RC method yields smoother change of PSNR curves. In addition, the proposed RC method tends to yield smoother PSNR curves with smaller peak-to-valley variations between the 70-th and 100-th frames in Fig. 11-(a), compared to the default RC method. Especially, the proposed RC method maintains the visual quality consistency up to the end of the sequence whereas the default RC method fails to do so especially from the 80-th to the 100-th frames both in Fig. 11-(b) and Fig. 11-(c).
Fig. 12, Fig. 13, and Fig. 14 show some decoded frames for subjective visual quality comparisons using AI, LD, and RA configurations, respectively. Fig. 12 shows the 72-th reconstructed frame (cropped) of Tango2 (3840×2160) with
(a) (b) (c)
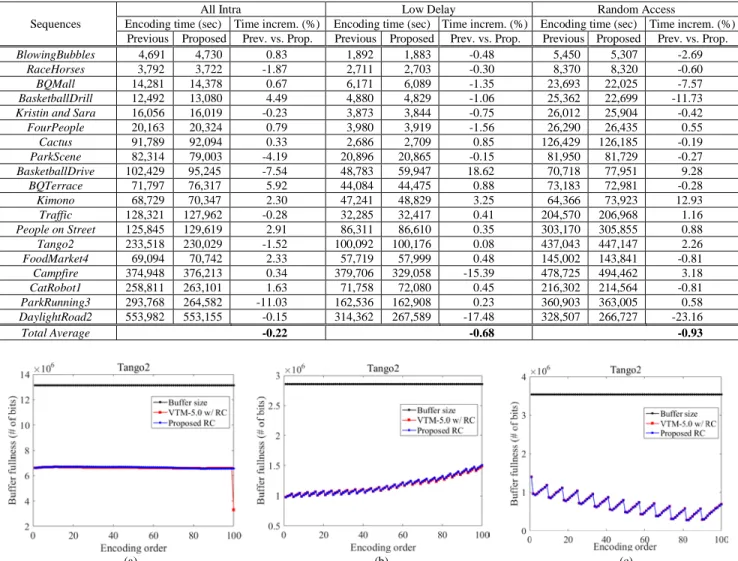
FIGURE 15.Buffer fullness (# of bits) of Tango2 (3840×2160) by the two RC methods for QP = 37. (a) Under AI with a buffer size (TBS) of 13,138 kbits,
(b) Under LD mode with TBS = 2,856 kbits, and (c) Under RA with TBS = 3,534 kbits.
QP = 37. As shown in Fig. 12-(b) to Fig. 12-(d), the vivid blemish on the wrist in the original frame shown in Fig. 12-(b) appears blurred in Fig. 12-(d) by the default RC method. Fig. 13 shows the 49-th reconstructed frame (cropped) of BlowingBubbles (416×240) with QP = 32. As shown in Fig. 13-(b) to Fig. 13-(d), the braided hair and face on the left girl in the original frame shown in Fig. 13-(b) appears blurred in Fig. 13-(d) by the default RC method. Fig. 14 shows the 82-th reconstructed frame (cropped) of ParkScene (1920×1080) with QP = 37. As shown in Fig. 14-(b) to Fig. 14-(d), a pattern carved on a pillar in the original frame shown in Fig. 14-(b) appears blurred in Fig. 14-(d) by the default RC method. However, our RC method presents better visual quality as shown in Fig. 12-(c), Fig. 13-(c), and Fig. 14-(c).
From the observations of the extensive experimental results throughout Table II, Table III, Table IV, Fig. 5, Fig. 6, Fig. 7, Fig. 8, Fig. 9, Fig. 10, Fig. 11, Fig.12, Fig. 13, and Fig. 14, the proposed RC method shows the superiority of RC performance in terms of NRMSE, σPSNR, and PSNR
compared to the default RC method, for almost all the test sequences by enhancing both the rate estimation accuracy and visual quality consistency.
C. COMPLEXITY
Table V shows the complexity of the proposed RC method in terms of run times, which was performed on a PC platform with Intel CoreTM i-7-8700K [email protected] GHz, a 32.0 GB
RAM and a 64-bit WindowsTM 10 operating system. The
average run times were measured with three runs of encoding 100 frames using QP = 22 for each test sequence by using the VTM-5.0 reference SW encoder [1]. As shown in Table V, the time increments required for the proposed RC method are ranged between -11.03% and 5.29% for AI configuration, -17.48% and 18.62% for LD configuration, and -23.16% and 12.93% for RA configurationcompared to the original VTM-5.0 reference SW encoder with the default RC method. Our RC method, which is implemented into the VTM-5.0 by replacing the default RC method, has reduced the encoding time about 0.22% for AI configuration, 0.68% for LD
configuration, and 0.93% for RA configuration in average, thus not increasing the overall complexity of the VTM-5.0 reference SW encoder. It is also worthwhile to mention that the encoding time is affected by the selected QP values for rate control.
TABLEV.Processing Complexity Comparison for the proposed RC method and the default RC method of the original VTM-5.0 [1]
Sequences
All Intra Low Delay Random Access
Encoding time (sec) Time increm. (%) Encoding time (sec) Time increm. (%) Encoding time (sec) Time increm. (%) Previous Proposed Prev. vs. Prop. Previous Proposed Prev. vs. Prop. Previous Proposed Prev. vs. Prop.
BlowingBubbles 4,691 4,730 0.83 1,892 1,883 -0.48 5,450 5,307 -2.69
RaceHorses 3,792 3,722 -1.87 2,711 2,703 -0.30 8,370 8,320 -0.60
BQMall 14,281 14,378 0.67 6,171 6,089 -1.35 23,693 22,025 -7.57
BasketballDrill 12,492 13,080 4.49 4,880 4,829 -1.06 25,362 22,699 -11.73
Kristin and Sara 16,056 16,019 -0.23 3,873 3,844 -0.75 26,012 25,904 -0.42
FourPeople 20,163 20,324 0.79 3,980 3,919 -1.56 26,290 26,435 0.55 Cactus 91,789 92,094 0.33 2,686 2,709 0.85 126,429 126,185 -0.19 ParkScene 82,314 79,003 -4.19 20,896 20,865 -0.15 81,950 81,729 -0.27 BasketballDrive 102,429 95,245 -7.54 48,783 59,947 18.62 70,718 77,951 9.28 BQTerrace 71,797 76,317 5.92 44,084 44,475 0.88 73,183 72,981 -0.28 Kimono 68,729 70,347 2.30 47,241 48,829 3.25 64,366 73,923 12.93 Traffic 128,321 127,962 -0.28 32,285 32,417 0.41 204,570 206,968 1.16 People on Street 125,845 129,619 2.91 86,311 86,610 0.35 303,170 305,855 0.88 Tango2 233,518 230,029 -1.52 100,092 100,176 0.08 437,043 447,147 2.26 FoodMarket4 69,094 70,742 2.33 57,719 57,999 0.48 145,002 143,841 -0.81 Campfire 374,948 376,213 0.34 379,706 329,058 -15.39 478,725 494,462 3.18 CatRobot1 258,811 263,101 1.63 71,758 72,080 0.45 216,302 214,564 -0.81 ParkRunning3 293,768 264,582 -11.03 162,536 162,908 0.23 360,903 363,005 0.58 DaylightRoad2 553,982 553,155 -0.15 314,362 267,589 -17.48 328,507 266,727 -23.16 Total Average -0.22 -0.68 -0.93
This work is licensed under a Creative Commons Attribution 4.0 License. For more information, see https://creativecommons.org/licenses/by/4.0/
D. BUFFER FULLNESS
In order to seamlessly stream the encoded bit-sequences within a certain bandwidth under a CBR constraint, a proper buffer size needs to be defined such that an RC algorithm controls the bit generation to prevent buffer overflow and underflow. The buffer is named as a coded picture buffer (CPB) whose size is same as a target bit-rate [1]. In our experiments, both the proposed RC method and the default method work reasonably well for the CPB state controlling without buffer overflow and underflow. Fig. 15 shows the buffer fullness (= CPB) of Tango2 by the two RC methods under AI, LD, and RA configurations. As shown in Fig. 15, the CPBs are stably controlled for seamless streaming. However, as shown in Fig. 15-(a), the default RC method generates a great amount of bits to adjust the target bit-rates at the very end of the sequence where the CPB state goes down abruptly, thus it may cause a buffer underflow.
E. DISCUSSION ON HARDWARE ISSUES
A video encoder for real-time fidelity and high-resolution applications may require a hardware implementation where bit rate estimation is an essential element [57]. Based on our complexity analysis on the random sampling function of RBE-based rate estimation using nineteen test sequences in Table I, the run time of our RC method approximately is less than 2msec per frame while other method in [8] requires more than 20msec per frame. It is noted that since our RBE-based rate estimation scheme only utilizes previous encoded distortions and rates for bit estimation, the complexity for rate estimation is not dependent on the image sizes of test sequences. Nevertheless, in order to reduce the processing time for bit rate estimation in the perspective of hardware optimization, a parallel hardware architecture for random sampling function of RBE-based rate estimation can be considered. In particular, a probability summation and indexing for our RBE-based rate estimation can possibly be implemented in parallel processing architecture.
V. CONCLUSION
In this paper, we propose a frame-level constant bit-rate (CBR) control using recursive Bayesian estimation (RBE) for Versatile Video Coding (VVC). The proposed RC method is based on a stochastic framework and considers the R-D characteristics of the previously encoded frames in estimating the rate for the current frame with a less visual quality fluctuation. Extensive experimental results have shown that our RC method can effectively reduce the NRMSE for rate estimation and σPSNR (the standard deviation
of all resulting PSNRs) for visual quality consistency compared to the default RC method of the original VTM-5.0. This performance gain comes from the fact that our proposed RC method uses an effective RBE for rate estimation and regulates the bit allocation (BA) process with the estimated bits for VVC. As a future work, a deep learning-based long short-term memory model (LSTM) for rate estimation will be studied to improve RC performance in VVC.
REFERENCES
[1] Joint Video Expoloration Team (JVET) of ITU-T VCEG and ISO/IEC MPEG, "VVC reference software," [Online]. Available: https://jvet.hhi.fraunhofer.de/jvet/VVCSoftware_VTM.
[2] B. Li, H. Li, L. Li, and J. Zhang, "Rate control by R-lambda model
for HEVC," JCTVC-K0103, 11th meeting, Shanghai, CN, 2012.
[3] B. Li, H. Li, L. Li, and J. Zhang, "lambda domain rate control algorithm for high efficiency video coding," IEEE Trans. Image
Process., vol. 23, no. 9, pp. 3841-54, Sep. 2014.
[4] L. Li, B. Li, H. Q. Li, and C. W. Chen, "lambda-Domain Optimal Bit Allocation Algorithm for High Efficiency Video Coding," IEEE
Trans. Circuits Syst. Video Technol., vol. 28, no. 1, pp. 130-142, Jan.
2018.
[5] B. Bross, J. Chen, and S. Liu, "Versatile Video Coding (Draft 5)," JVET-N1001-v10, 14th meeting, Geneva, CH, 2019.
[6] G. J. Sullivan, J. R. Ohm, W. J. Han, and T. Wiegand, "Overview of the High Efficiency Video Coding (HEVC) Standard," IEEE Trans.
Circuits Syst. Video Technol., vol. 22, no. 12, pp. 1649-1668, Dec.
2012.
[7] J. Chen, Y. Ye, and S. H. Kim, "Algorithm Description for Versatile
Video Coding and Test Model 5," JVET-N1002, 14th meeting,
Geneva, CH, 2019.
[8] B. Lee and M. Kim, "Modeling Rates and Distortions Based on a Mixture of Laplacian Distributions for Inter-Predicted Residues in Quadtree Coding of HEVC," IEEE Signal Process. Lett., vol. 18, no. 10, pp. 571-574, Oct. 2011.
[9] B. Lee, M. Kim, and T. Q. Nguyen, "A Frame-Level Rate Control Scheme Based on Texture and Nontexture Rate Models for High Efficiency Video Coding," IEEE Trans. Circuits Syst. Video
Technol., vol. 24, no. 3, pp. 465-479, Mar. 2014.
[10] C. W. Seo, J. H. Moon, and J. K. Han, "Rate control for consistent objective quality in high efficiency video coding," IEEE Trans.
Image Process., vol. 22, no. 6, pp. 2442-2454, Jun. 2013.
[11] Z. W. Zhang, T. Jing, J. N. Han, Y. W. Xu, and F. Zhang, "A New Rate Control Scheme For Video Coding Based On Region Of Interest," IEEE Access, vol. 5, pp. 13677-13688, Mar. 2017. [12] M. H. Hyun, B. Lee, and M. Kim, "A Novel Rate and Distortion
Estimation Method using Particle Filtering based Prediction for Intra-Predictive Coding of Deep Block Partitioning Structures,"
IEEE Trans. Circuits Syst. Video Technol.(Early Access), pp. 1-16,
Apr. 2020.
[13] Joint Video Expoloration Team (JVET) of ITU-T VCEG and ISO/IEC MPEG, "HEVC reference software," [Online] Available: https://hevc.hhi.fraunhofer.de/svn/svn HEVCSoftware.
[14] Y. Li, B. Li, D. Liu, and Z. Chen, "A Convolutional Neural Network-Based Approach to Rate Control in HEVC Intra Coding," in Proc. VCIP, St. Petersburg, U.S.A., pp. 1-4, Dec. 2017.
[15] MPEG-2 Test Model 5, ISO/IEC JTC1/SC29 WG11/93-400, 1993. [16] A. Vetro, H. F. Sun, and Y. Wang, "MPEG-4 rate control for
multiple video objects," IEEE Trans. Circuits Syst. Video Technol., vol. 9, no. 1, pp. 186-199, Feb. 1999.
[17] T. Wiegand, G. J. Sullivan, G. Bjontegaard, and A. Luthra, "Overview of the H.264/AVC video coding standard," IEEE Trans.
Circuits Syst. Video Technol., vol. 13, no. 7, pp. 560-576, Jul. 2003.
[18] X. Jing, L. P. Chau, and W. C. Siu, "Frame complexity-based rate-quantization model for H.264/AVC intraframe rate control," IEEE
Signal Process. Lett., vol. 15, pp. 373-376, Mar. 2008.
[19] B. Yan and M. H. Wang, "Adaptive Distortion-Based Intra-Rate Estimation for H.264/AVC Rate Control," IEEE Signal Procss. Lett., vol. 16, no. 1-3, pp. 145-148, Mar. 2009.
[20] Y. Chang and M. Kim, "Hybrid Codec-Based Intra-Frame Joint Rate Control for Stereoscopic Video," IEEE Signal Proc. Lett., vol. 18, no. 10, pp. 543-546, Oct. 2011.
[21] M. Karczewicz and X. Wang, "Intra Frame Rate Control Based on
SATD," JCTVC-M0257, 13th meeting, Incheon, KR, 2013.
[22] M. H. Wang, K. N. Ngan, and H. L. Li, "An Efficient Frame-Content Based Intra Frame Rate Control for High Efficiency Video Coding," IEEE Signal Process. Lett., vol. 22, no. 7, pp. 896-900, Jul. 2015.
[23] W. Gao, S. Kwong, Y. Zhou, and H. Yuan, "SSIM-Based Game Theory Approach for Rate-Distortion Optimized Intra Frame CTU-Level Bit Allocation," IEEE Trans. Multimedia, vol. 18, no. 6, pp. 988-999, Jun. 2016.
![TABLE II. Average BRA, NRMSE and σ PSNR performances for the proposed RC method and the default RC method of the original VTM-5.0 [1] under AI](https://thumb-ap.123doks.com/thumbv2/123dokinfo/5094374.77563/8.864.58.808.109.465/table-average-nrmse-performances-proposed-default-method-original.webp)