DNA methylation loss promotes immune evasion
of tumours with high mutation and copy
number load
Hyunchul Jung
1,10
, Hong Sook Kim
2,10
, Jeong Yeon Kim
1
, Jong-Mu Sun
2
, Jin Seok Ahn
2
, Myung-Ju Ahn
2
,
Keunchil Park
2
, Manel Esteller
3,4,5,6,7
, Se-Hoon Lee
2,8
& Jung Kyoon Choi
1,9
Mitotic cell division increases tumour mutation burden and copy number load, predictive
markers of the clinical benefit of immunotherapy. Cell division correlates also with genomic
demethylation involving methylation loss in late-replicating partial methylation domains. Here
we
find that immunomodulatory pathway genes are concentrated in these domains and
transcriptionally repressed in demethylated tumours with CpG island promoter
hyper-methylation. Global methylation loss correlated with immune evasion signatures
indepen-dently of mutation burden and aneuploidy. Methylome data of our cohort (
n = 60) and a
published cohort (
n = 81) in lung cancer and a melanoma cohort (n = 40) consistently
demonstrated that genomic methylation alterations counteract the contribution of high
mutation burden and increase immunotherapeutic resistance. Higher predictive power was
observed for methylation loss than mutation burden. We also found that genomic
hypo-methylation correlates with the immune escape signatures of aneuploid tumours. Hence,
DNA methylation alterations implicate epigenetic modulation in precision immunotherapy.
https://doi.org/10.1038/s41467-019-12159-9
OPEN
1Department of Bio and Brain Engineering, KAIST, Daejeon 34141, Republic of Korea.2Division of Hematology/Oncology, Department of Medicine, Samsung
Medical Center, Sungkyunkwan University School of Medicine, Seoul 06351, Republic of Korea.3Cancer Epigenetics and Biology Program (PEBC), Bellvitge
Biomedical Research Institute (IDIBELL), L’Hospitalet, Barcelona, Catalonia, Spain.4Centro de Investigacion Biomedica en Red Cancer (CIBERONC), 28029
Madrid, Spain.5Institucio Catalana de Recerca i Estudis Avançats (ICREA), Barcelona, Catalonia, Spain.6Physiological Sciences Department, School of
Medicine and Health Sciences, University of Barcelona (UB), Barcelona, Catalonia, Spain.7Josep Carreras Leukaemia Research Institute (IJC), Badalona,
Barcelona, Catalonia, Spain.8Department of Health Sciences and Technology, Samsung Advanced Institute of Health Science and Technology,
Sungkyunkwan University, Seoul 06351, Republic of Korea.9Penta Medix Co., Ltd., Seongnam-si, Gyeongi-do 13449, Republic of Korea.10These authors
contributed equally: Hyunchul Jung, Hong Sook Kim. Correspondence and requests for materials should be addressed to S.-H.L. (email:shlee119@skku.edu)
or to J.K.C. (email:jungkyoon@kaist.ac.kr)
123456789
C
ancer immunotherapy based on checkpoint blockade has
become highly effective in a subset of patients with
dif-ferent types of human cancers. In particular,
antibody-mediated interventions targeting cytotoxic T lymphocyte
antigen-4 (CTLA-antigen-4) and programmed death receptor-1 (PD-1) on T
lymphocytes and the principal ligand (PD-L1) on tumour cells
can reverse tumour-induced immunosuppression and induce
durable clinical responses
1.
A major challenge facing current immunotherapies is the
identification of biomarkers that predict clinical responses to
CTLA-4 and PD-1/PD-L1 blockade. Overall, the mutational or
neoantigen load
2–5and pre-existing T cell infiltration
6,7are
indicators of clinical benefit of checkpoint blockade. On the other
hand, somatic copy number alterations (SCNAs)
8–10, tumour
heterogeneity
11, and the genetic alteration of specific genes
12or
pathways
13have been identified as resistance factors.
Tumour cells produce neoantigens or antigens that the
immune system never encountered without cancer. The epitopes
of neoantigens are displayed on the surface of cancer cells and
provoke immune response. Therefore, tumours with high
muta-tion load are more likely to respond to anti-immunosuppressive
strategies based on checkpoint blockade
2–5. Mutation load
increases as a result of replicative errors during cell division. Not
only mutations but also methylation losses accumulate during
successive rounds of cell division
14. Global hypomethylation and
CGI hypermethylation represent the hallmark methylation
changes in cancer
15. Considering its association with late
repli-cation timing, progressive methylation loss may occur due to the
failure of methylation maintenance machinery to remethylate
newly synthesized daughter stands during DNA replication
14,16.
However, the influence of genomic methylation loss through cell
divisions has never been investigated in the context of cancer
immunotherapy.
Meanwhile, SCNAs emerged as a resistance parameter
8–10. A
pan-cancer analysis discovered the association of SCNAs with
molecular signatures of cytotoxic immune activity across diverse
tumour types
10. Particularly, highly aneuploid tumours with
extensive chromosome- or arm-level SCNAs showed a lower
expression of markers indicating infiltrating immune cells. In
contrast, focal SCNAs mainly correlated with cell proliferation
markers instead of immune activity signatures. However, the
mechanism by which aneuploidy affects immune cell infiltration
remains unknown. Global demethylation in cancer promotes
chromosomal instability
17–20, particularly involving large-scale
alterations leading to aneuploidy
21–23. Therefore, we investigated
the relationships between methylation changes and aneuploidy.
Here, we performed large-scale systematic analyses of the
molecular data of TCGA samples across a variety of tumour
types. We examined the relationships of global methylation levels
with markers of cell proliferation, mutation burden, SCNA levels,
markers of infiltrating immune cells, and activity of
immune-response genes. Importantly, we tested our hypotheses developed
from the molecular analyses by using our lung cancer cohort.
This is the
first study that inspected DNA methylation patterns in
the molecular and clinical data with regards to cancer
immu-notherapy. As a result, we suggest that as an important predictive
marker in immunotherapy, genomic demethylation implicates
epigenetic modulation as a combination regimen for precision
immunotherapy.
Results
Global methylation correlates with immune signatures. Our
pan-cancer analyses of TCGA data demonstrated that markers of
cell proliferation tightly correlate with mutation burden and
aneuploidy across cancer types and among samples within each
cancer type (Supplementary Fig. 1). Our measure of genomic
demethylation based on long interspersed nuclear element-1
(LINE-1 or L1)
24,25probes (Supplementary Fig. 2) also strongly
correlated with cell proliferation markers (Fig.
1
a and
Supple-mentary Data 1). Global methylation loss was also associated with
an increase in mutation burden (Fig.
1
b) and chromosomal
SCNA load (Fig.
1
c), two types of genomic aberrations that
accumulate through cell division (Supplementary Fig. 5).
Notably, we found a correlation between the global L1
methylation levels and immune signatures such as markers of
tumour-infiltrating CD8 + T cells (Fig.
1
d, Supplementary Data 1,
and Supplementary Fig. 3). However, immune cell markers are
expected to correlate with mutation burden and also are known to
be associated with aneuploidy
10. To disentangle this
intercorrela-tion, we performed multiple regression of the expression level of
each gene on sample-level features, namely, global L1
methyla-tion, mutation burden, aneuploidy, tumour purity, age, and
tumour stage. In this manner, we were able to determine that
immune infiltrates are associated with the global methylation
levels independently of mutation burden and aneuploidy when
purity, age, and tumour stage are adjusted (Fig.
2
a).
Significant correlations with genomic demethylation were
observed also for immunomodulatory pathways that should
include genes expressed in tumour cells. These include antigen
processing and presentation, major histocompatibility complex
(MHC), cytokine–cytokine receptor interaction, interferon or
other cytokine signaling, and complement and coagulation
(Fig.
2
b). There is an emerging role for the complement system
in regulating the antitumour immune response
26. The correlation
of the cell proliferation markers was in the opposite direction to
that of the immune cell markers or immunomodulatory genes
(Fig.
2
b). We confirmed that the global L1 methylation level itself
was not affected by the leukocyte fraction, which correlated only
with immune gene expression (Supplementary Fig. 4).
Repression of immune genes in late-replicating regions. To
focus on the repression of immune-response genes in tumour
cells, we excluded genes that are specifically expressed in the
immune system from the following analyses. Because methylation
loss occurs primarily in late-replicating regions
14,16, we examined
whether the transcriptional activity of late-replicated genes are
affected in the tumours that underwent global demethylation. By
using cell line data, we identified genes that are replicated earlier
or later in cancer compared with normal cells (Supplementary
Data 2). As a result, we found that the genes replicating late in
cancer were significantly repressed in the demethylated tumours
(Fig.
3
a) with CpG island (CGI) promoter hypermethylation
(Fig.
3
b). In contrast, the early-replicating genes tended to be
overexpressed in the demethylated tumours (Fig.
3
c).
Overall, immune-related pathways were overrepresented in the
late-replicating regions while cell cycle genes were concentrated in
the early-replicating regions (Fig.
3
d). More specifically, the
pathways most enriched for the late-replicating genes in cancer
included cytokine-cytokine receptor interaction, interferon-α/β
(IFN-α/β) signaling, and RIG-1/MDA5-mediated IFN-α/β
induc-tion (Fig.
3
e and Supplementary Table 1). RIG-1/MDA5-mediated
induction of IFN-α/β represents innate immune reaction against
RNA viruses. In contrast to our data from tumour-intrinsic
demethylation, treatment of methylation inhibitors was shown to
induce double-stranded RNAs (dsRNAs) derived from
endogen-ous retroviruses (ERVs) and LINEs, resulting in the activation of
the IFN-α/β response in cancer
27–29. Without the silencing of the
IFN-α/β pathway, genomic demethylation would cause the
antiviral response and facilitate antitumour immune reaction as
demonstrated with demethylating agents. We measured the
0.2
a
c
d
b
1000 100 10 0.1 Prolif er ation score P a rtial correlation coefficient (PCC) Aneuploidy le v e l PCC CD8 T cells PCC Mutation b u rden 0.0 15 0.22 0.21 0.20 10 5 0 0.0 –0.2 –0.4 0.0 –0.2 –0.4 PCC 0.4 0.2 0.0 0.0 –0.2 –0.4 0.35 0.40 0.45 PCPG PCPG PCPG PRAD PRAD PRAD LIHC LIHC LIHC UCEC UCEC LUAD LUAD LUAD PAAD PAAD PAAD KIRC KIRC KIRC KIRP KIRP KIRP THCA THCA THCA LGG LGG LGG BRCA BRCA BRCA STAD STAD SARC SARC SARC ESCA ESCA SKCM SKCM SKCM BLCA BLCA BLCA LUSC LUSC LUSC CRC CRC CRC HNSC HNSC HNSC SKCM BLCA LUSC ESCA CRC LIHC UCEC BRCA PRAD TGCT PCPG THCA LGG PAAD SARC KIRC KIRP HNSC CESC STAD LUAD TGCT TGCT TGCT CESC CESC CESC r = –0.51 P = 1.2 × 10⁻² r = –0.57 P = 6.7 × 10⁻³ r = –0.56 P = 8.6 × 10⁻³ r = 0.62 P = 2.7 × 10⁻³Global methylation level
0.50 0.55
0.35 0.40 0.45
Global methylation level
0.50 0.55 0.35 0.40 0.45
Global methylation level
0.50 0.55
0.35 0.40 0.45
Global methylation level
0.50 0.55
BLCA BRCA CESC CRC ESCA HNSC KIRC KIRP LGG LIHC LU
AD
LUSC PAAD PCPG PRAD SARC SKCM ST
AD
TGCT THCA UCEC
BLCA BRCA CESC CRC ESCA HNSC KIRC KIRP LGG LIHC LU
AD
LUSC PAAD PCPG PRAD SARC SKCM ST
AD
TGCT THCA UCEC BLCA BRCA CESC CRC ESCA HNSC KIRC KIRP LGG LIHC LU
AD
LUSC PAAD PCPG PRAD SARC SKCM ST
AD
TGCT THCA UCEC BLCA BRCA CESC CRC ESCA HNSC KIRC KIRP LGG LIHC LU
AD
LUSC PAAD PCPG PRAD SARC SKCM ST
AD
TGCT THCA UCEC
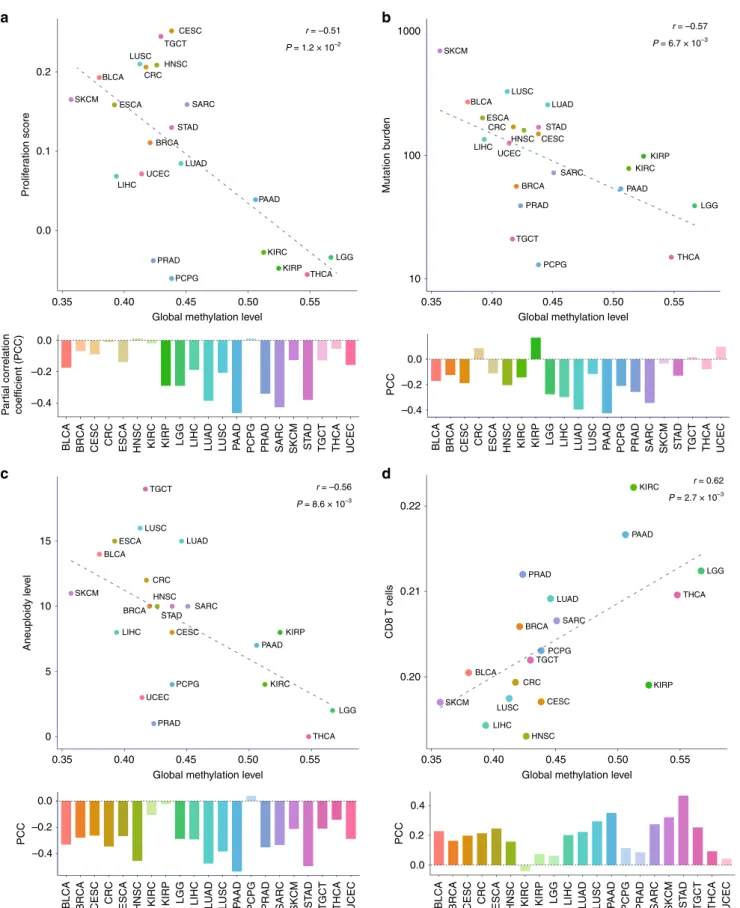
Fig. 1 Correlates of global DNA methylation level. Correlation between genomic methylation levels and cell proliferation markers a, mutation burden
b, aneuploidy level c, and tumour-infiltrating CD8 + T cell markers d across and within 21 cancer types. a–d The median values were obtained for each
cancer type, and statistical significance was evaluated using Spearman’s correlation (upper scatterplots). Three outlier cancer types (ESCA, STAD, and
UCEC) are not shown for the CD8+ T cell correlation, but included when evaluating Spearman’s correlation. For the correlation within each cancer type
(lower bar graphs), Spearman’s partial correlation was used to adjust for tumour purity. Tumour types showing significant partial correlation coefficient
expression levels of ERVs and L1s from the tumour samples. The
correlation of their expression levels with the indicators of
cytotoxic immune activity was not positive but negative in general
(Supplementary Fig. 5), implying that IFN-α/β silencing overrides
the immune-stimulatory effects of ERV/L1 expression by genomic
demethylation.
Repression of immune genes in partial methylation domains.
Methylation loss in late-replicating regions engages the formation
of heterochromatic structure termed partial methylation domains
(PMDs) as opposed to highly methylated domains (HMDs)
16.
PMDs were
first discovered as contiguous regions with lower
levels of CpG methylation in differentiated cells
30. PMD-like
long-range tumour demethylation was discovered in colon
31,
breast
32, and brain
33cancers. A recent study showed PMD
demethylation is a common feature of diverse cancer type
16. Such
long-range demethylation in cancer is accompanied with gene
silencing programs. Genes within PMDs in differentiated cells are
under-expressed
30. Similarly, genes in PMDs in various types of
cancers are largely silenced by the formation of repressive
chro-matin structures or via CGI hypermethylation
31–35.
PMDs were characterized by and defined based on the high
variability of solo-WCGW methylation levels across samples
16.
Our inspection of the methylation variability and replication
timing of various PMDs led to three distinct subclasses (Fig.
4
a).
In accordance with a previous report
36, the properties of PMDs
were associated with their genomic length with shorter PMDs
Hallmark immune gene sets ALLOGRAFT_REJECTION COAGULATION COMPLEMENT IL2_STAT5_SIGNALING IL6_JAK_STAT3_SIGNALING INFLAMMATORY_RESPONSE NTERFERON_ALPHA_RESPONSE INTERFERON_GAMMA_RESPONSE TNFA_SIGNALING_VIA_NFKB E2F_TARGETS G2M_CHECKPOINT MITOTIC_SPINDLE MYC_TARGETS_V1 MYC_TARGETS_V2 P53_PATHWAY Hallmark proliferation gene setsGlobal methylation level Tumor type
Mutation burden Aneuploidy level
a
b
Activated_B_cell Activated_CD4_T_cell Activated_CD8_T_cell Central_memory_CD4_T_cell Central_memory_CD8_T_cell Effector_memeory_CD4_T_cell Effector_memeory_CD8_T_cell Gamma_delta_T_cell Immature__B_cell Regulatory_T_cell T_follicular_helper_cell Type_1_T_helper_cell Type_17_T_helper_cell Type_2_T_helper_cell Activated_dendritic_cell Immature_dendritic_cell Macrophage MDSC Monocyte Natural_killer_cell Natural_killer_T_cell Plasmacytoid_dendritic_cell MAJOR_HISTOCOMPATIBILITY_COMPLEX ANTIGEN_PROCESSING_AND_PRESENTATION CYTOKINE_CYTOKINE_RECEPTOR_INTERACTIONGlobal methylation level Predictor variables
(purity, age, and stage adjusted)
Predictor variables (purity, age, and stage adjusted)
Mutation burden Aneuploidy level
Tumor type
Adaptive immunity
Innate immunity
BLCA BRCA CESC CRC ESCA HNSC KIRC KIRP LGG LIHC LUAD LUSC PAAD PCPG PRAD SARC SKCM STAD TGCT THCA UCEC Normalized enrichment score (NES)
–4 4
BLCA BRCA CESC CRC ESCA HNSC KIRC KIRP LGG LIHC LUAD LUSC PAAD PCPG PRAD SARC SKCM STAD TGCT THCA UCEC NES
–6 6
CD56bright_natural_killer_cell
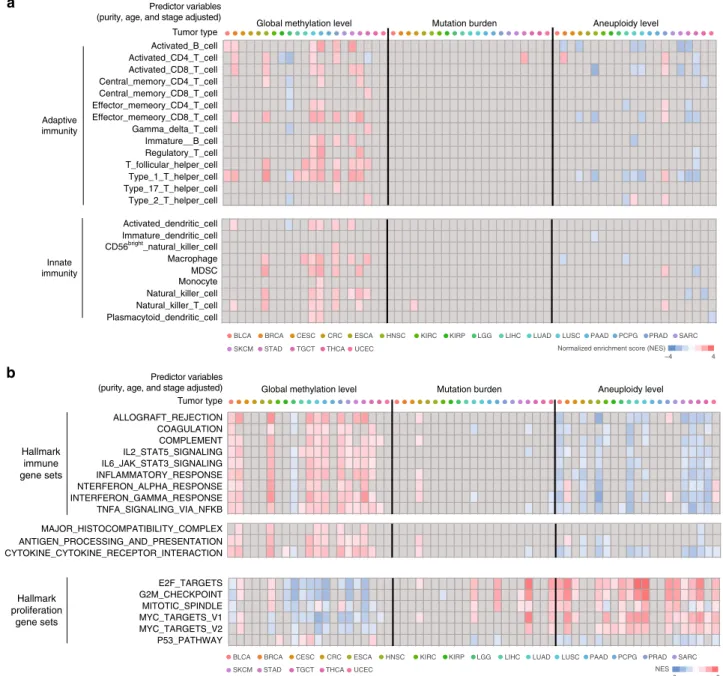
Fig. 2 Genomic methylation loss correlates with immune evasion signatures. a Heatmap of Gene Set Enrichment Analysis (GSEA)48normalized
enrichment scores (NESs) for gene sets representing various types of innate and adaptive immune cells (rows). For each gene per cancer type, a linear
regression model wasfit using mRNA expression level as response variable and global methylation, mutation burden, aneuploidy, tumour purity, age, and
tumour stage as predictors. For each of three predictors (global methylation level, mutation burden, aneuploidy level), GSEA was performed on genes with
significant regression coefficients. Cells with significant NES (FDR <0.25) are colour-scaled. b Heatmap of GSEA NESs for hallmark immune and
characterized by earlier replication timing (Fig.
4
a, b). Strikingly,
immunomodulatory pathway genes involved in antigen
proces-sing and presentation, cytokine-cytokine receptor interaction, and
JAK-STAT signaling pathway were concentrated in the short
PMDs (Fig.
4
c, d and Supplementary Table 2). The INF-α family
genes were in the short PMDs (Fig.
4
e). Also, 8 HLA genes,
including HLA-DQA1, HLA-DRA, and HLA-DRB1, were located
within the short PMDs. Consistent with the late-replicating
regions (Fig.
3
a, b), the short PMDs were accompanied with gene
repression (Fig.
4
f) and CGI hypermethylation (Fig.
4
g) in
demethylated tumours. Hypermethylated CGIs are most
abun-dant within 150 kb of PMD boundaries
31. The enriched immune
genes (Fig.
4
c, d) were significantly concentrated near PMD
boundaries with the average distance of 143 kb (Fig.
4
h),
suggesting that these genes are particularly prone to promoter
methylation.
Global methylation predicts responses to immunotherapy. To
test whether global methylation alterations affect the clinical
benefit of immunotherapy, we generated methylome and exome
data for 60 samples in an anti-PD-1/PD-L1 cohort in lung cancer
collected from Samsung Medical Center (SMC) (Supplementary
Table 3). Also, we employed an additional anti-PD-1 lung cancer
cohort composed of 81 methylomes and 22 exomes from Bellvitge
Biomedical Research Institute (IDIBELL)
37. For validation, we
utilized data from 40 TCGA melanoma patients who received
immunotherapies. The summary of the three cohorts is provided
in Fig.
5
a.
The samples from the combined lung cancer cohort were
divided into global low versus high methylation groups according
to the L1 methylation levels. The global low methylation group
exhibited decreased genomic (open sea/shelf) methylation and
increased CGI/shore methylation (Fig.
5
b, c). In agreement with
Enriched pathways in late-replicating regions (n = 6; FDR < 0.1) NES Late-replicated genes (n = 885)
e
a
−1.0 −0.5 0.0 0.5 1.0mRNA expression level
(average z-score)
BLCA BRCA CESC CRC ESCA HNSC LIHC LUAD LUSC PAAD PRAD STAD TGCT
CYTOKINE_CYTOKINE_RECEPTOR_INTERACTION ES −4.0 −2.0 0 REGULATION_OF_IFNA_SIGNALING Earlier replication in cancer Later replication in cancer Earlier replication in cancer Later replication in cancer −6.0 −3.0 0 NES = –2.17 P = 9.0 × 10⁻³ FDR = 0.01 NES = –2.18 P = 0 FDR = 0.02
Enrichment score (ES)
BLCA BRCA ESCA HNSC KIRP LUAD LUSC PAAD STAD UCEC
−0.5 0.0 0.5 1.0
mRNA expression level
(average z-score)
Early-replicated genes (n = 1747)
c
Fraction of enriched pathways
Cell cycle pathways (n = 108) Immune pathways (n = 130) 20 6 25 P = 3.7 × 10⁻⁹ 0% 10% 20% Early replication in cancer Late replication in cancer 0
d
# of hyper-methylated CGIs at late-replicated genes
BLCA BRCA CRC HNSC KIRP LUAD LUSC PAAD PRAD SKCM STAD TGCT UCEC
P ** *** *** *** ** ** * *** *** *** *** *** *** *** 100 300 150 50 100 300 100 200 40 80 50 150 50 100 200 100 50 100 50 150 200 400 10 20 200 KIRC LIHC 80 160 40 80 *** P ** Low High *P < 1.0 × 10⁻¹⁰ **P < 1.0 × 10⁻²⁰ ***P < 1.0 × 10⁻³⁰ *P < 5.0 × 10⁻² **P < 1.0 × 10⁻² ***P < 1.0 × 10⁻³ *P < 1.0 × 10⁻¹⁰ **P < 1.0 × 10⁻²⁰ ***P < 1.0 × 10⁻³⁰
Global L1 methylation level
Low High Global L1 methylation level
Low High Global L1 methylation level
* * *** * ** *** ** ** ** *** *** **
b
P ** ** *** ** *** * *** * * ** TRAF6_MEDIATED_IRF7_ACTIVATION CYTOKINE_CYTOKINE_RECEPTOR_INTERACTION REGULATION_OF_IFNA_SIGNALING JAK_STAT_SIGNALING_PATHWAY RIG_I_MDA5_MEDIATED_INDUCTION_OF_IFN_ALPHA_BETA_PATHWAYS ADP_SIGNALLING_THROUGH_P2RY12Fig. 3 Characterization of genes in late-replicating regions. a Comparison of the expression levels of late-replicated genes between tumours with low and
high global methylation. Tumour types for which the pairedt-test P < 1 × 10⁻¹⁰are shown.b Comparison of the number of hypermethylated CpG island
promoters of late-replicating genes between tumours with low and high global methylation. Tumour types withP < 0.05 (two-sided Mann–Whitney U test)
are shown. In the boxplots, the centre line, bounds of box, and whiskers represent the 50th, 25thand 75th, and 5th, and 95thpercentiles, respectively.
c Comparison of the expression levels of early-replicated genes between tumours with low and high global methylation. Tumour types for which the paired
t-testP < 1 × 10⁻¹⁰are shown.d Fraction of enriched cell-cycle and immune pathways according to replication timing. The number of the pathways
showing significant enrichment (FDR <0.25) by GSEA is indicated above the bars. e Significantly enriched pathways for genes in late-replicating regions
our pan-cancer molecular data analyses, the global low
methyla-tion samples showed high mutamethyla-tion burden and aneuploidy as
well as CGI hypermethylation in the short PMDs (Fig.
5
d).
Transcriptome data of the SMC cohort and TCGA cohort showed
that genes involved in the MHC and cytokine-cytokine receptor
interaction were significantly enriched for repression in globally
demethylated tumours of both cohorts (Supplementary Fig. 6 and
Supplementary Data 3).
High mutation load is associated with the clinical benefit of
checkpoint blockade
2–5. However, when we stratified patient
samples according to the L1 methylation levels, the global low
methylation group showed poor prognosis despite high mutation
load. In the combined lung cancer cohort (n
= 141), the hazard
ratio (HR) was 0.56 (log rank test, P
= 7.0 × 10
−3) (Fig.
5
e). The
IDIBELL cohort (n
= 81) (Fig.
5
f) and SMC cohort (left of
Fig.
5
g) resulted in HR
= 0.57 (log rank test, P = 4.0 × 10
−2) and
HR
= 0.52 (log rank test, P = 5.0 × 10
−2), respectively. Whereas
the P values decreased as sample size grew, the effect size (HR)
remained a similar level.
We next compared the effect of global methylation and
mutation load on the clinical response. For the combined lung
cancer cohort, methylome and matched exome data were
available for 82 samples in total (Fig.
5
a). In contrast to the
global L1 methylation level (log rank test, HR
= 0.46 and P =
7.0 × 10
−3), mutation burden failed to show significant
explana-tory power (log rank test, HR
= 0.77 and P = 0.3) (left and
middle of Fig.
5
h). Multiple regression with survival or clinical
benefit as the response variable demonstrated significant effects
by the global L1 methylation level but not mutation burden at
P
= 0.05 (right of Fig.
5
h). We repeated the univariate
a
Methylation variability Replication timing High Low 2.5 Mb Domain size 7.5 Mb PMD class S I L P = 1.7 × 10–64 P = 1.5 × 10⁻³⁴ P = 1.5 × 10⁻³⁰ FDR < 0.01 Enriched pathwaysb
Methylation variability Replication timing
Long (L) PMD
c
chr9p22 21,050 kb 21,250 kb 21,450 kb IFNA21 IFNA4 IFNA7 IFNA10 IFNA16 IFNA17 IFNA5 IFNA6 IFNA2 IFNA8 IFNA1 Early Replication timing Genes HMD Short PMD Methylation domain LateNormal cell lines (n = 5)
Cancer cell lines (n = 10) IFNB1 IFNA14 IFNA21 IFNA4 IFNA7 IFNA10 IFNA16 IFNA17 IFNA5 IFNA6 IFNA6 IFNA2 IFNA8 IFNA8 IFNA1
Normal cell lines (n = 5)n
Cancer cell lines (n = 10)n
IFNA14 IFNB1
BLCA BRCA CRC KIRC LGG LIHC LUAD LUSC PAAD PCPG PRAD SKCM STAD TGCT THCA UCEC
P
mRNA expression level
in short PMDs (average z-score) Low High *P < 1.0 × 10⁻¹⁰ **P < 1.0 × 10⁻²⁰ ***P < 1.0 × 10⁻³⁰ *P < 5.0 × 10⁻² **P < 1.0 × 10⁻² ***P < 1.0 × 10⁻³
Global L1 methylation level
Low High Global L1 methylation level
* *** *** * * *** * * ** * ** *** * * ** *
f
0 0.5 –0.5 # of hyper-methylated CGIs in short PMDsBLCA BRCA CESC CRC ESCA HNSC KIRP LGG LUAD LUSC PAAD PRAD SKCM STAD TGCT UCEC
200 100 150 50 200 100 200 100 125 75 25 150 50 120 40 100 50 100 50 150 50 80 40 120 40 150 50 150 50 80 60 40 200 100 P *** *** *** *** *** *** * *** * *** *** * *** *** *** ***
g
AUTOIMMUNE_THYROID_DISEASE ANTIGEN_PROCESSING_AND_PRESENTATION CYTOKINE_CYTOKINE_RECEPTOR_INTERACTION GRAFT_VERSUS_HOST_DISEASE REGULATION_OF_AUTOPHAGY NATURAL_KILLER_CELL_MEDIATED_CYTOTOXICITY INTESTINAL_IMMUNE_NETWORK_FOR_IGA_PRODUCTION ASTHMA RIG_I_LIKE_RECEPTOR_SIGNALING_PATHWAY CYTOSOLIC_DNA_SENSING_PATHWAY ALLOGRAFT_REJECTION JAK_STAT_SIGNALING_PATHWAY TOLL_LIKE_RECEPTOR_SIGNALING_PATHWAY Class S I Le
d
Density Methylation variability 0 10 20 30 40 50 0.05 0.10 0.15 0.20 HMD S-PMD I-PMD L-PMD CELL_CYCLE ANTIGEN_PROCESSING_AND_PRESENTATION P = 2.96 × 10⁻⁷ CYTOKINE_CYTOKINE_RECEPTOR_INTERACTION P = 2.96 × 10⁻¹¹ JAK_STAT_SIGNALING_PATHWAY P = 2.09 × 10⁻⁴ # of genes in S-PMDs (%) 22 (69%) 28 (49%) 47 (25%) 14 (61%) 15 (56%) 27 (28%) 12 (41%) 9 (53%) 16 (30%) 15 (31%) 9 (45%) 24 (22%) 18 (23%)Short (S) PMD Intermediate (I) PMD
Late Early 150 kb 250 kb 350 kb 450 kb 2e−06 6e−06
h
Average distance to the nearest HMD
Density
Background distribution Immune genes (P = 0)
Fig. 4 Characterization of genes in partially methylated domains. a Identification of PMD subclasses through hierarchical clustering on methylation
variability and replication timing.b Comparison of PMD size between the identified PMD subclasses. c Enrichment of genes in immune-related pathways in
the short PMDs.d Distribution of domain methylation variability for genes in cell cycle and immune pathways. The two-sample Kolmogorov-Smirnov test
was used to assess deviation from the distribution of the cell cycle genes.e IFN-α genes in a short PMD with late replication timing. The mean and standard
error of the weighted average signals of replication timing in normal cells and cancer cells are shown.f Comparison of the mRNA expression level of genes
in the short PMDs between tumour samples with low and high global methylation. Tumour types for which the paired t-testP < 1.0 × 10⁻¹⁰are shown.
g Comparison of the number of hyper-methylated promoter CGIs in the short PMDs between tumour samples with low and high global methylation.
Tumour types withP < 5.0 × 10⁻²(two-sided Mann–Whitney U test) are shown. h Concentration of immune genes near PMD boundaries. The average
distance of the immune-related genes (from b) to the nearest HMDs is marked by an arrow. The statistical significance of the observed average distance
b
1 Methylation level ( β value) 0.5 0 CGI (n = 27,497) P = 0 Open Sea (n = 199,030) P = 0c
CGI Shore Shelf
2 kb 2 kb Open Sea 2 kb 2 kb Shore Shelf Open Sea Probe location High (n=71) Low (n = 70)
Global L1 methylation level
Methylation level –2 2 z-score Global L1 methylation Low High
d
Mutation burden 50 100 150 200# of hyper-methylated CGIs in short PMDs
P = 7.2 × 10⁻¹⁰ P = 4.3 × 10⁻⁹ P = 2.0 × 10⁻³ 30 300 3000 Low High (n = 82) Low High (n = 60) Low High (n = 141)
a
Cancer type Cohort Number of samples Methylation level Mutation burden Aneuploidy level Lung cancer SMC IDIBELL Combined 60 60 60 81 22 NA 141 82 60 Melanoma TCGA 40 40 40 1e+07 1e+08 1e+09 Aneuploidy levelCombined cohort (n = 141) IDIBELL cohort (n = 81)
Mutation burden
Low High
Low High
0 5 10 15 20 25
Mutation burden Aneuploidy level
Time (months) 0 5 10 15 20 Time (months) 0 5 10 15 20 25 Time (months) 0 5 10 15 20 25 Time (months) 0 5 10 15 20 25 Time (months) 0 5 10 15 20 25 Time (months) 0 5 10 15 20 25 Time (months) Low High Low High High Low Global L1 methylation Mutaiton burden PFS DCB/NDB -log 10 ( p value) 1.5 P = 0.05
Combined cohort with methylation and mutation data (n = 82)
SMC cohort with methylation, mutation, and CNV data (n = 60)
IDIBELL cohort with methylation and mutation data (n = 22) Mutation burden
i
Time (months) 0 10 20 30 40 Time (months) 0 10 20 30 40 1.0 0.8 0.6 0.4 0.2 0.0 1.0 0.8 0.6 0.4 0.2 0.0 Combined cohort (n = 141) Global L1 methylationProgression free survival
1.0 0.8 0.6 0.4 0.2 0.0
Progression free survival
1.0 0.8 0.6 0.4 0.2 0.0
Progression free survival
1.0 0.8 0.6 0.4 0.2 0.0
Progression free survival
1.0 0.8 0.6 0.4 0.2 0.0
Progression free survival
Progression free survival
1.0 0.8 0.6 0.4 0.2 0.0
Progression free survival
1.0 0.8 0.6 0.4 0.2 0.0
Progression free survival
1.0 0.8 0.6 0.4 0.2 0.0
Progression free survival
Low High Low High IDIBELL cohort (n = 81) P = 7.0 × 10⁻³ HR = 0.56 P = 7.0 × 10⁻³ HR = 0.46 P = 2.0 × 10⁻² HR = 0.27 P = 0.3 HR = 0.77 P = 0.94 HR = 0.97 P = 4.0 × 10⁻² HR = 0.57 P = 5.0 × 10⁻² HR = 0.52 P = 0.2 HR = 0.64 P = 0.2 HR = 1.56 High High Low Low
e
h
g
Global L1 methylationGlobal L1 methylation Global L1 methylation
Global L1 methylation
f
0.5
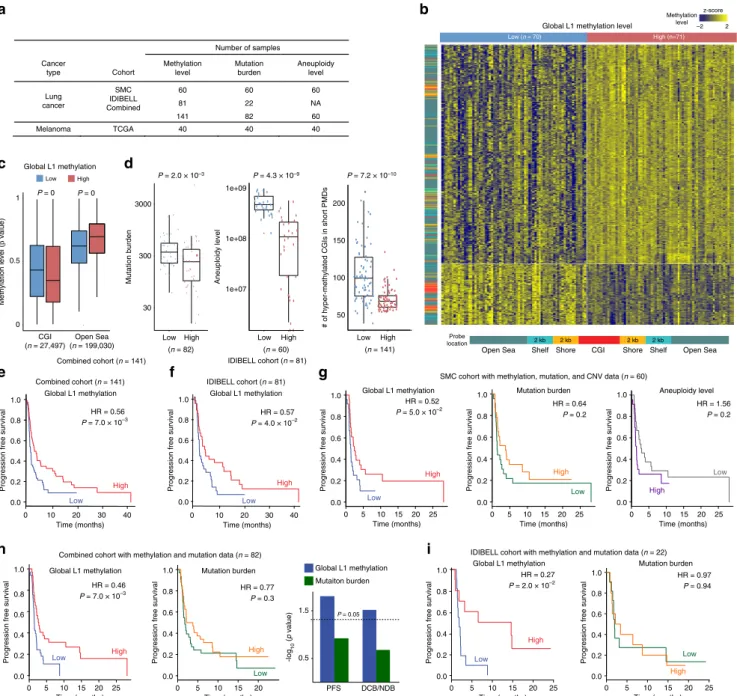
Fig. 5 Genomic demethylation adversely affects the clinical benefit of checkpoint blockade. a Summary of immunotherapy cohort samples with available
data.b Unsupervised hierarchical clustering of the DNA methylation profiles of the SMC lung cancer cohort samples. The methylation probes (row) were
clustered and samples (column) were divided into two groups according to the median of the global methylation level. The heatmap shows beta values for the most differentially methylated loci (the highest 1%) between tumour samples with low and high global methylation. The methylation probes were
categorized by the relative distance from CGIs (CGI, shore, shelf, and open sea).c Differential CGI/open-sea methylation between the global low and high
groups. The differentially methylated loci between the two groups (FDR <0.05) were selected, and per-locus beta values were averaged for each group.
The paired t-test was used to test the statistical significance. d Comparison of mutation burden, the aneuploidy level, and the number of hyper-methylated
promoter CGIs in the short PMDs between tumour samples with low and high global methylation.e, f Survival analysis using tumour samples with
methylation data from thee combined or f IDIBELL cohort. Patients were stratified by the global L1 methylation level. The log rank test was used to
compare survival curves estimated by the Kaplan–Meier method. g Survival analysis using the SMC tumour samples with methylation level, mutation
burden, and aneuploidy level. Patients were stratified by the global L1 methylation level (left), mutation burden (middle), and the aneuploidy level (right).
h Survival analysis using tumour samples with methylation and mutation data from the combined cohort. Patients were stratified by the global L1
methylation level (left) or mutation burden (middle). To estimate the relative contribution of mutation burden and global methylation to patient survival
and clinical benefit, the multivariate Cox proportional hazards model (for PFS: progression free survival) or multivariate logistic regression model (for DCB:
durable clinical benefit and NDB: no durable benefit). i Survival analysis using the IDIBELL tumour samples with methylation and mutation data. Patients
comparisons for the two lung cancer cohorts separately. Both the
SMC cohort (n
= 60) and IDIBELL cohort (n = 22) resulted in
significant stratification by global methylation but not by
mutation burden (left and middle of Fig.
5
g and i).
The global L1 methylation level negatively correlated with
aneuploidy (middle of Fig.
5
d). A pan-cancer analysis discovered
the association of aneuploidy with signatures of immune
evasion
10. Taken together, both low methylation and high
aneuploidy are expected to decrease tumour immunity and
undermine the clinical benefit of immunotherapy. However,
when we examined the SMC lung cancer cohort for which
aneuploidy data were available (Fig.
5
a), only global methylation
but not aneuploidy showed significant correlations with poor
clinical responses (left and right of Fig.
5
g).
All the above analyses were repeated for the TCGA melanoma
cohort (n
= 40) (Fig.
5
a). The samples were
first divided into
global low versus high methylation groups according to the L1
methylation levels. The global low methylation group in
melanoma recapitulated CGI promoter hypermethylation in the
short PMDs (Supplementary Fig. 7A) and poor prognosis in
response to immunotherapies (log rank test, HR
= 0.48 and P =
3.0 × 10
−2) (Supplementary Fig. 7B). Mutation burden and
aneuploidy level both failed to explain the clinical benefit
(Supplementary Fig. 7C, D).
Global demethylation rules out the effect of aneuploidy. Our
results on aneuploidy from the clinical data contradict the previous
findings on the association of aneuploidy and immune evasion
signatures
10. Thus, we examined the possibility that global
methylation is able to explain this association. Global
demethyla-tion in cancer promotes chromosomal instability
17–20. DNA
hypomethylation-related instability is mainly of chromosomal
nature and involves large-scale alterations leading to aneuploidy
rather than widespread amplifications or deletions
21–23. As in ICF
syndrome (for immunodeficiency, centromere instability, and
facial anomalies), failure of methylation maintenance in
pericen-tromeric sequences can cause erroneous chromosomal segregation
in cancer
38–42.
Indeed, global demethylation significantly correlated with
SCNAs across different tumour types (Fig.
6
a). We determined
the magnitude of chromosomal SCNAs (cSCNAs) by combining
the chromosome SCNA and arm SCNA levels that were
previously calculated
10, and compared this result with that of
focal SCNAs (fSCNAs). The correlation was stronger with
cSCNAs than with fSCNAs (Fig.
6
b and Supplementary Fig. 8).
We used partial correlations to estimate the extent to which the
global L1 methylation level correlates with cSCNAs (or fSCNAs)
when controlling for fSCNAs (or cSCNAs). In most cases, global
hypomethylation was associated with cSCNAs independently of
fSCNAs (Fig.
6
c). In contrast, the correlation with fSCNAs
disappeared when cSCNAs were controlled for (Fig.
6
c).
Importantly, the multiple regression analysis of the immune
signature scores revealed markedly higher explanatory power for
the global L1 methylation levels than cSCNA levels (Fig.
6
d). We
also performed the partial correlation analyses for the immune
signature score, global L1 methylation level, and cSCNA level.
Overall, the positive correlation between the immune signature
score and global L1 methylation level maintained when the
cSCNA level was controlled for (Fig.
6
e), except for one tumour
type that was previously reported as an exception regarding the
role of aneuploidy
10. These results indicate that the immune
avoidance signatures of highly aneuploid tumours are associated
with genomic demethylation. Indeed, a recent molecular
mechanism study
43contradicted the previous report
10by
suggesting that aneuploid cells generate pro-inflammatory signals
for their own elimination by the immune system as a means for
cancer cell immunosurveillance.
Discussion
In this work, we propose that DNA methylation aberration is an
important determinant of the tumour response to host immune
activity, and can provide a mechanism by which rapidly dividing
and highly mutated tumours escape immune reaction and resist
immunotherapy. The key mechanism seems to be the formation
of heterochromatin, which is coupled with progressive
domain-level methylation loss. An open question is what dictates these
epigenetic changes in particular regions, such as the MHC locus.
One possibility is that these changes at the particular loci are
selectively favoured during cancer evolution because they provide
immune evasion mechanisms and increase
fitness of tumour cells.
It is also possible that domain demethylation of immune-related
regions is a more inherent chromatin tendency than a
con-sequence of selection. In any case, our results suggest that mitotic
cell division causes genetic and epigenetic alterations that exert
opposing effects on tumour immunity by increasing neoantigens
and inhibiting immune gene expression, respectively. Cell
divi-sion also increases focal and chromosomal copy number changes.
Our data show that the particular association of chromosomal
copy number changes with low antitumour immune activity can
be explained by global methylation loss.
There are multiple studies that reported antitumour immunity
augmented by CDK4/6 inhibition and synergistic effects of the
cell cycle inhibitors and checkpoint blockade
44–46. Our results
suggest that cell cycle inhibition may bring about opposing effects
by suppressing genetic alterations that facilitate neoantigen
for-mation and at the same time, preventing immune evasion
pro-moted by epigenetic alterations that repress immunomodulatory
pathway genes. Hence, the reported effects of cell cycle inhibition
suggest that the benefits achieved by epigenetic influences may be
greater than the adverse effects caused by suppressing neoantigen
formation.
The repression signatures for IFN-α/β signaling draw
parti-cular attention, given that this pathway is supposed to stimulate
immune responses against dsRNAs induced by genomic
deme-thylation. Recent studies have shown that DNA methylation
inhibitors induce dsRNA expression and stimulate antitumour
immune activity through the IFN-α/β response activated by the
viral defence pathway
27–29. Based on these results, combining
epigenetic therapy and immunotherapy has been suggested
47,48.
According to our results, tumours with global methylation loss
tend to resist immunotherapy alone and may particularly benefit
from this combined treatment approach. However, intrinsically
de-suppressed dsRNAs may fail to boost antitumour immunity
because of inactivated IFN-α/β signaling. We indeed observed
that ERV/LINE expression does not increase the immune
sig-natures, which, in contrast, are reduced probably reflecting
IFN-α/β inactivation. Therefore, different action mechanisms of
epigenetic therapy are required when targeting these tumours.
Specifically, it needs to be tested whether methylation inhibitors
or other epigenetic modulators are capable of restoring the
IFN-α/β response and other immunomodulatory pathways by
diminishing CGI methylation or loosening heterochromatin
structure in these intrinsically demethylated tumours. Our study
sheds light on the combination of epigenetic modulation and
checkpoint blockade as a potential precision immunotherapy
regimen.
Methods
TCGA molecular and clinical data. The batch-corrected and normalized DNA
methylation data based on Infinium Methylation 450k technology), together with
consortium were obtained from the publication page ( https://gdc.cancer.gov/about-data/publications/pancanatlas). TCGA aliquot barcodesflagged as DO NOT USE
in the Merged Sample Quality Annotationfile were discarded. We selected cancer
types for which there were >100 patient samples with all the molecular data and age information. The selected tumour types encompassed 6968 samples across 21 types (Supplementary Table 4), including bladder urothelial carcinoma (BLCA), breast adenocarcinoma (BRCA), cervical squamous cell carcinoma and endo-cervical adenocarcinoma (CESC), colorectal carcinoma (CRC), esophageal carci-noma (ESCA), head and neck squamous cell carcicarci-noma (HNSC), kidney renal clear cell carcinoma (KIRC), kidney renal papillary cell carcinoma (KIRP), lower grade glioma (LGG), liver hepatocellular carcinoma (LIHC), lung adenocarcinoma (LUAD), lung squamous cell carcinoma (LUSC), pancreatic adenocarcinoma (PAAD), pheochromocytoma and paraganglioma (PCPG), prostate adenocarci-noma (PRAD), sarcoma (SARC), skin cutaneous melaadenocarci-noma (SKCM), stomach adenocarcinoma (STAD), testicular germ cell tumours (TGCT), thyroid carcinoma (THCA), and uterine corpus endometrial carcinoma (UCEC). PMD methylation levels were derived from Zhou et al.16(https://zwdzwd.github.io/pmd). Aneuploidy
level and tumour purity values were obtained from a Table of Taylor et al.49. The
cSCNA and fSCNA levels from 11 cancer types were obtained from Davoli et al.10.
For glioblastoma multiforme (GBM), microarray-based gene expression data were obtained from the UCSC Xena public data hubs.
Estimating global methylation levels. To determine global methylation levels, we chose methylation probes for which at least 90% of sequences (≥45 bp) mapped to the young subfamilies of LINE-1 (L1HS and L1PA). Probe mapping information
and LINE-1 family annotation were obtained from GPL1630450and the
Repeat-Masker of the UCSC genome browser51, respectively. We averaged the beta values
of the chosen probes in each tumour sample, and used the average beta as an estimate of the global methylation level (Supplementary Data 1). For validation, we
obtained the whole-genome bisulfite sequencing data (level 3 beta values) of
samples for which the methylation array data were available (n= 18;
Supplementary Table 5) from the GDC legacy archive (https://portal.gdc.cancer.
gov/legacy-archive). Wefirst selected evolutionarily young LINE-1 repeat elements containing at least three different CpG sites that were covered by at least 10 aligned reads and then computed the averaged beta value for each repeat element. The number of the selected repeat elements for each sample ranged from 67,732 to 71,958 (Supplementary Table 5). We obtained the mean of the average beta values of the repeat elements to represent the global methylation level of each sample. We performed an additional validation by using the LINE-1 pyrosequencing dataset of 15 samples for which methylation array data of the same platform were available52.
We compared our measures based on the selected array probes with the bisulfite
sequencing and pyrosequencing measures (Supplementary Fig. 2).
Linear regression modelling. For each gene per cancer type, a linear regression
model wasfit using mRNA expression level as the response variable, and global
methylation, mutation burden, aneuploidy, tumour purity, age, and tumour stage as predictors. We included tumour stage in the model for tumour types for which at least 100 patient samples with tumour stage information were available (n= 15; Supplementary Table 4). The regression model with the following formula was built using the lm function in R.
mRNA expression of gene Y ~β1× global methylation level+ β2× mutation
burden+ β3× aneuploidy level+ β4× tumour purity+ β5× age+ β6× tumour stage
For each of three predictors (global methylation level, mutation burden,
aneuploidy level) per tumour type, GSEA48was performed on genes with
significant regression coefficients (Benjamini and Hochberg FDR <0.05). Genes ranked by the z score from the linear regression model were used for input into the
preranked module of the GSEA software48with the immune and proliferation gene
sets (see below). GSEA was run with default settings, except for the minimum number of gene sets, which was set to 10.
Identification of genes with differential replication timing. Repli-Seq
mea-surements (wavelet-smoothed signal) of ENCODE 5 normal (HUVEC, IMR90,
−2 0 2
SCNA level
BRCA CRC GBM HNSC KIRC LGG LUAD LUSC SKCM STAD UCEC
Low High Low High Low High Low High Low High Low High Low High Low High Low High Low High Low High
P = 3.7 × 10⁻¹² P = 1.2 × 10⁻¹⁰ P = 3.1 × 10⁻² P = 1.6 × 10⁻¹⁹ P = 3.2 × 10⁻⁴ P = 3.9 × 10⁻⁷ P = 3.1 × 10⁻²¹ P = 2.8 × 10⁻¹⁶ P = 5.7 × 10⁻¹¹ P = 5.5 × 10⁻¹⁹ P = 2.5 × 10⁻⁸
a
n = 334 n = 194 n = 68 n = 194 n = 164 n = 224 n = 198 n = 124 n = 136 n = 144 n = 206
Global DNA methylation level (lowest 30% vs highest 30%)
Chromosomal SCNA level Focal SCNA level −2 0 2 −2 0 2 −2 0 2 −2 0 2 r = –0.43 P = 1.3 × 10–153 P = 1.7 × 10–87 r = –0.33 n = 3342 n = 3342 BRCA CRC GBM HNSC KIRC LGG LUAD LUSC SKCM STAD UCEC r P
CRC GBM HNSC KIRC LGG LUAD LUSC SKCM STAD UCEC
−0.2 0 *** *** –0.15 –0.3 ***** –0.15 *** ****** –0.3 *** ***** ***** 0 −0.2 BRCA 0 0 0 –0.15 0 0 –0.4 0 0 –0.4 –0.3 0 –0.1 0 * ****** *
cSCNA level fSCNA level
Global methylation level Global methylation level
b
c
d
** * ** ** * ** ** ** ** ** * * ** ** * Methylation cSCNA fSCNA Z 7.5 0 –7.5 *P < 1.0 × 10 –2 **P < 1.0 × 10⁻³ ***P < 1.0 × 10⁻³ **P < 1.0 × 10⁻² *P < 5.0 × 10⁻² ***P < 1.0 × 10⁻³ **P < 1.0 × 10⁻² *P < 5.0 × 10⁻²CRC GBM HNSC KIRC LGG LUAD LUSC SKCM STAD UCEC
BRCA
e
BRCA CRC GBM HNSC KIRC LGG LUAD LUSC SKCM STAD UCEC
7.27 3.48 1.78 5.13 1.71 –3.45 3.53 4.36 4.63 4.11 4.25 –3.08 –3.33 0.97 –1.04 –0.42 2.99 –3.09 –1.04 –2.91 –2.49 –2.21 3.24 -2.14 0.89 –1.70 0.10 2.14 0.86 0.05 –0.59 –0.16 1.33 0 0.5 –0.5 0 0.2 –0.2 *** ****** –0.2 0 0.2 * 0 0.5 –0.5 ****** 0.2 0 –0.2 0.2 0 –0.2 * **** 0.2 0 –0.2 ****** 0.2 0 –0.2 0.2 0 –0.2 *** 0.5 0 –0.5 ****** ****** 0.2 0 –0.2 ****
Methylation level cSCNA level
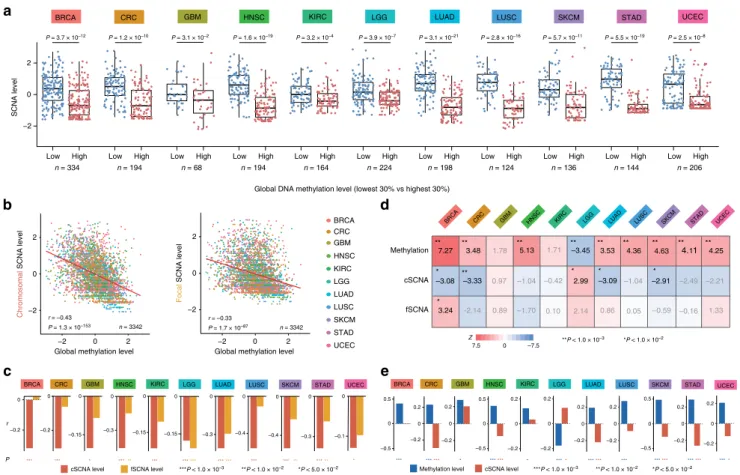
Fig. 6 Aneuploidy indicates global DNA hypomethylation. a Comparison of SCNA levels between tumours with low and high global methylation. Shown
here is the combination of cSCNAs and fSCNAs.P values from the two-sided Mann–Whitney U test are shown. b Association of global DNA methylation
with cSCNA and fSCNA levels. The values were standardized per tumour type. Spearman’s rank correlation coefficient and its P value are shown. c Partial
correlation analyses comparing cSCNAs (red) and fSCNAs (orange) for their correlation with global methylation independently of one another. The
Spearman correlation was used.d For each tumour type, samples with a low (<30thpercentile) and high (>70thpercentile) immune signature score were
compared by multivariate logistic regression with the standardized global methylation, cSCNA, and fSCNA levels, and tumour purity as predictors.e Partial
correlation analyses comparing global methylation (blue) and cSCNAs (red) for their correlation with the immune signature score independently of one
NHEK, BJ_1 and BJ_2) and 10 cancer cell lines (MCF-7, SK-N-SH, HepG2, HeLa, A549, G401, LNCaP, T47D, H460, and Caki-2) were downloaded from the UCSC
Genome Browser53and ENCODE project portal54. Average wavelet-smoothed
signal values in each 5-kb window were scaled and quantile-normalized. Windows harbouring missing values in any of the cell lines were excluded. We performed the student’s t-test for each 5-kb window to assess the replication timing difference between the normal and cancer cells. We then assigned the P value and t statistic to each gene. For genes spanning multiple replication timing windows, we assigned a combined P value using the Fisher’s method and average t statistic. We excluded
genes located on sex chromosomes or specifically expressed in the immune system
(see below). Genes with Bonferroni-adjusted P value < 0.05 were defined as early-or late-replicated genes in cancer. Genes ranked by the t statistic were used fearly-or
input into the preranked module of the GSEA software48with the canonical
REACTOME and KEGG pathways from MSigDB55.
Analysis of genes with differential replication timing. To investigate the expression differences of early- and late-replicated genes between tumour samples with high and low global methylation levels, we partitioned tumour samples into the low (<30thpercentile) and high (>70thpercentile) global methylation groups for each cancer type. After a z-score normalization of mRNA expression data per gene per cancer type, we computed the average expression level of the genes for each group and compared the groups. To calculate the fraction of enriched cell-cycle and immune pathways (Fig.3c), genes ranked by the t statistic (replication timing difference between normal and cancer cells) were used for input into the preranked
module of the GSEA software with REACTOME pathways (provided athttps://
reactome.org/) belonging to the Cell Cycle or Immune System category. Pathways harbouring at least 10 genes were used for this analysis.
Clustering of PMD and analysis of focal hypermethylation in PMD. By
employing previously defined locations of PMDs and HMDs per 100 kb16, we
merged consecutive domains of the same type and retained those >300 kb in length. After assigning average methylation variability and replication timing from normal samples into each merged PMD, we performed hierarchical clustering on them. The enrichment of genes in particular pathways for clusters was computed using the binomial test. To estimate the number of hypermethylated CpG island
promoter probes in short PMDs for each sample, wefirst calculated the mean and
standard deviations of CpG island probes in the merged HMDs and then counted CpG island promoter probes (annotated as TSS200 or TSS1500) in short PMDs for which methylation level is greater than two standard deviations from the mean. Analysis of proximity of immune genes to PMD boundaries. For a total of 77
immune genes in the pathways enriched for short PMDs (n= 13; Fig.4c), we
calculated the average distance to their nearest HMD (original HMD defined by
Zhou et al.16) and then estimated its P value by generating a background
dis-tribution. We randomly picked 77 PMD genes and calculated the average distance of them to the nearest HMD. This procedure was repeated 10,000 times.
Collection and identification of marker gene sets. We obtained markers for
CD8+ T cells and proliferation (Fig.1a, d) from Thorsson et al.56and used
single-sample GSEA to estimate the activity of the markers. Gene sets for marking dif-ferent types of immune cells and MHC (class I, class II, and non-classical) were
derived from Charoentong et al.57. Hallmark immune and proliferation gene sets
were obtained from MSigDB55. Antigen presentation and cytokine signaling
pathways were derived from canonical KEGG pathway in MSigDB55. The gene set
for the immune signature score was obtained from the aneuploidy study10. Tofilter
out genes that are specifically expressed in the immune system, we used gene
expression data from the Illumina’s Human BodyMap 2.0 project (ftp://ftp.ncbi. nih.gov/gene/DATA/expression/Mammalia/Homo_sapiens/). Genes for which the
average expression level in leukocytes and lymph nodes wasfive-fold higher than
that in the remaining tissues (n= 14) were considered as genes specifically
expressed in the immune system (n= 1216; Supplementary Data 4).
Quantification of LINE-1 and ERV expression. To quantify the LINE-1 and ERV
expression levels, we aligned RNA-seq reads against the LINE-158and ERV59
sequence library, respectively, by using BWA60. We then normalized the mapped
read counts by the total number of aligned RNA-seq reads. Reads that mapped to both of the libraries or other repeat libraries58(Alu and SVA) were excluded. The
normalized expression levels were standardized per tumour type for comparison. Clinical data of the SMC cohort. A total of 60 advanced non-small cell lung carcinoma patients who were treated with anti-PD-1/PD-L1 from 2014 to 2017 at Samsung Medical Center were enrolled for this study (Supplementary Table 3). The clinical response was evaluated by the Response Evaluation Criteria in Solid Tumours (RECIST) version 1.1 with a minimum 6-month follow-up. The response to immunotherapy was classified into durable clinical benefit (DCB, responder) or non-durable benefit (NDB, non-responder)2. Partial response (PR) or stable disease
(SD) that lasted more than 6 months was considered as DCB/responder. Progressive disease (PD) or SD that lasted less than 6 months was considered as
NDB/non-responder. Progression-free survival (PFS) was calculated from the start date of therapy to the date of progression or death, whichever is earlier. Patients were censored at the date of the last follow-up for PFS if they were not progressed and alive. We complied with all relevant ethical regulations for work with human par-ticipants. Informed consent was obtained. This study was approved from the insti-tutional review board at Samsung Medical Center (2018-03-130 and 2013-10-112). Whole-exome, transcriptome, and methylome data for the SMC cohort. Tumour samples were obtained before anti-PD1/PD-L1 treatment, and then were
embedded in paraffin after formalin fixation or kept fresh. DNA was prepared
using AllPrep DNA/RNA Mini Kit (Qiagen, 80204), AllPrep DNA/RNA Micro Kit (Qiagen, 80284), or QIAamp DNA FFPE Tissue Kit (Qiagen, 56404) for library preparation for whole exome sequencing. Library preparation was performed by
using SureSelectXT Human All Exon V5 (Agilent, 5190–6209) according to the
instructions61. Briefly, 200–300 ng of tumour and normal genomic DNA was
sheared, and 150–200 bp of the sheared DNA fragments were further processed for end-repairing, phosphorylation, and ligation to adaptors. Ligated DNA was hybridized using whole-exome baits from SureSelectXT Human All Exon V5. The libraries were quantified by Qubit and 2200 Tapestation, and sequenced on an Illumina HiSeq 2500 platform with 2 × 100 bp paired ends. Target coverage for normal samples was × 50 and tumour sample was × 100.
The sequencing reads were aligned to the human reference genome (hg19) with
BWA mem module (v0.7.12)60with default parameters. PCR duplicate reads were
marked using Picard62. We used Strelka263to call somatic variants and selected
single nucleotide variants (SNVs) and indels covered by at least ten andfive reads
in tumour, respectively. We furtherfiltered out common germline variants present
in dbSNP 15064and annotated somatic variants using ANNOVAR65. The list of
filtered SNVs and indels is provided in Supplementary Data 5. Copy number
variations (CNVs) were called using CNVkit66with the circular binary
segmentation algorithm (Supplementary Data 6). Aneuploidy levels were derived
from the called CNVs. Specifically, we applied the defined threshold of ± 0.2
(average value of LUAD and LUSC) on the segment log2ratio (tumour versus
normal) to detect amplifications/deletions affecting at least 10% of a chromosome arm or 5% of a chromosome. The aneuploidy level was the sum of the absolute segment log2ratio, each weighted by its length10.
RNA was extracted from same tumour tissue using Allprep DNA/RNA Mini
Kit (Qiagen, 80204). RNA was extracted from formalinfixed paraffin embedded
(FFPE) using Rneasy FFPE kit (Qiagen, 73504). RNA was assessed for quality and quantity using nanodrop 8000 UV-Vis spectrometer (NanoDrop Technologies Inc) and 4200 TapeStation Instrument (Aglient Technologies). RNA integrity number (RIN) of >= 5 were selected for further library preparation. In total 500 ng of RNA from fresh tissues and 100 ng of RNA from FFPE were used for library preparation using Truseq RNA library prep kit v2 (Illumina, RS-122-2001, Rs-122-2002) or Truseq RNA access library prep kit (Illumina, RS-301-2001, RS-301-2002), respectively. The library was generated according to the manufacturer’s instructions. RNA libraries were multiplexed and sequenced with 100 bp pair end reads on HiSeq2500 platform (Illumina).
The RNA-seq reads were aligned to the human reference genome (hg19) with
STAR67and gene expression values were quantified using RSEM68. Genes ranked
by t-values obtained from comparing mRNA expression levels between tumours
with low (n= 14) and high global methylation level (n = 13) were used for input
into the preranked module of the GSEA software with KEGG pathways and the MHC gene set.
Methylation assay was performed by following the instructions of Infinium
MethylationEPIC BeadChIP Kit (Illumina, WG-317-1002). Briefly, 500 ng genomic DNA (gDNA) was used for bisulfite conversion using the EZ DNA methylation kit (Zymo Research, D5001). The bisulfited gDNA was denatured and neutralized for amplification, and was further processed for fragmentation. After fragmentation, DNA was eluted and resuspended in a hybridization buffer, and then hybridized onto the BeadChip. The BeadChip was prepared for staining and extension after washing out unhybridized DNA, and it was imaged using the Illumina iScan System. The raw intensityfiles were then preprocessed into beta values using the preprocessIllumina function in minfi69. The methylation data were treated as
described in the Estimating global methylation levels section. The PMD levels of our cohort samples were calculated based on the average of EPIC probes for
Solo-WCGW CpGs in common PMDs16(provided athttps://zwdzwd.github.io/pmd).
Redundant probes such as multi-hit probes by using thefilter function of the
ChAMP package70. We used MethylCIBERSORT71and ESTIMATE72to estimate
tumour purity and leukocyte fraction (Supplementary Fig. 4). We processed the raw methylation intensityfiles of 81 lung cancer samples of the IDIBELL cohort37with
the same pipeline and merged them with the SMC cohort data using ComBat73.
Melanoma cohort data. Progression-free survival data for melanoma patients who received immune checkpoint inhibitors (drug name labelled as Ipilimumab,
Yer-voy, or Pembrolizumab; n= 15) were obtained from Ock et al.9. We included
additional 25 patients that received other types of immunotherapy using drug data from the GDC legacy archive. We selected samples for which the therapy type (CDE_ID:2793530) column indicated immunotherapy while excluding samples from patients that received multiple drugs. The molecular data for these samples were obtained as described in the TCGA molecular and clinical data section.
Multivariate survival analysis. Global methylation and mutation burden were combined in a multivariable Cox proportional hazards model using the coxph function in R. The multivariable logistic regression model was used to assess the impact of global methylation and mutation burden on the objective response using the glm function in R.
Reporting summary. Further information on research design is available in the Nature Research Reporting Summary linked to this article.
Data availability
The methylation chip and RNA-seq data for the samples of our lung cancer cohort are available at Gene Expression Omnibus under GSE119144 and GSE135222, respectively. The raw data for the exome sequencing of our SMC cohort samples have been submitted to European Genome-phenome Archive under accession number EGAS00001003731.
Code availability
Computer codes used in this study are provided as Supplementary Software 1.
Received: 24 October 2018 Accepted: 10 August 2019
References
1. Sharma, P. & Allison, J. P. The future of immune checkpoint therapy. Science 348, 56–61 (2014).
2. Rizvi, N. A. et al. Mutational landscape determines sensitivity to PD-1
blockade in non-small cell lung cancer. Science 348, 124–128 (2015).
3. Schumacher, T. N. & Schreiber, R. D. Neoantigens in cancer immunotherapy.
Science 348, 69–74 (2015).
4. Gubin, M. M. & Schreiber, R. D. The odds of immunotherapy success. Science
350, 158–159 (2015).
5. Van Allen, E. M. et al. Genomic correlates of response to CTLA-4 blockade in
metastatic melanoma. Science 350, 207–211 (2015).
6. Tumeh, P. C. et al. PD-1 blockade induces responses by inhibiting adaptive
immune resistance. Nature 515, 568–571 (2014).
7. Herbst, R. S. et al. Predictive correlates of response to the anti-PD-L1 antibody MPDL3280A in cancer patients. Nature 515, 563–567 (2014).
8. Roh, W. et al. Integrated molecular analysis of tumor biopsies on sequential
CTLA-4 and PD-1 blockade reveals markers of response and resistance. Sci. Transl. Med. 9, eaah3560 (2017).
9. Ock, C. Y. et al. Genomic landscape associated with potential response to anti-CTLA-4 treatment in cancers. Nat. Commun. 8, 1050 (2017).
10. Davoli, T., Uno, H., Wooten, E. C. & Elledge, S. J. Tumor aneuploidy correlates with markers of immune evasion and with reduced response to immunotherapy. Science 355, 8399 (2017).
11. McGranahan, N. et al. Clonal neoantigens elicit T cell immunoreactivity and sensitivity to immune checkpoint blockade. Science 351, 1463–1469 (2016). 12. Riaz, N. et al. Recurrent SERPINB3 and SERPINB4 mutations in patients who
respond to anti-CTLA4 immunotherapy. Nat. Genet. 48, 1327–1330 (2016). 13. Gao, J. et al. Loss of IFN-γ pathway genes in tumor cells as a mechanism of
resistance to Anti-CTLA-4 Therapy. Cell 167, 397–404 (2016).
14. Shipony, Z. et al. Dynamic and static maintenance of epigenetic memory in pluripotent and somatic cells. Nature 513, 115–119 (2014).
15. Ehrlich, M. DNA methylation in cancer: too much, but also too little. Oncogene 21, 5400–5413 (2002).
16. Zhou, W. et al. DNA methylation loss in late-replicating domains is linked to mitotic cell division. Nat. Genet. 50, 591–602 (2018).
17. Jaenisch, R., Chen, R. Z., Pettersson, U., Beard, C. & Jackson-Grusby, L. DNA
hypomethylation leads to elevated mutation rates. Nature 395, 89–93 (1998).
18. Eden, A., Gaudet, F., Waghmare, A. & Jaenisch, R. Chromosomal instability and tumors promoted by DNA hypomethylation. Science 300, 455–455 (2003).
19. Gaudet, F. et al. Induction of tumors in mice by genomic hypomethylation. Science 300, 489–492 (2003).
20. Lee, S. T. & Wiemels, J. L. Genome-wide CpG island methylation and intergenic demethylation propensities vary among different tumor sites. Nucleic Acids Res. 44, 1105–1117 (2016).
21. Karpf, A. R. & Matsui, S. I. Genetic disruption of cytosine DNA
methyltransferase enzymes induces chromosomal instability in human cancer cells. Cancer Res. 65, 8635–8639 (2005).
22. Rodriguez, J. et al. Chromosomal instability correlates with genome-wide DNA demethylation in human primary colorectal cancers. Cancer Res. 66,
8462–9468 (2006).
23. Suzuki, K. et al. Global DNA demethylation in gastrointestinal cancer is age dependent and precedes genomic damage. Cancer Cell 9, 199–207 (2006). 24. Weisenberger, D. J. et al. Analysis of repetitive element DNA methylation by
MethyLight. Nucleic Acids Res. 33, 6823–6836 (2005).
25. Yang, A. S. A simple method for estimating global DNA methylation using
bisulfite PCR of repetitive DNA elements. Nucleic Acids Res. 32, 38e–38e
(2004).
26. Reis, E. S., Mastellos, D. C., Ricklin, D., Mantovani, A. & Lambris, J. D. Complement in cancer: untangling an intricate relationship. Nat. Rev. Immunol. 18, 5–18 (2018).
27. Chiappinelli, K. B. et al. Inhibiting DNA methylation causes an interferon response in cancer via dsRNA including endogenous retroviruses. Cell 162, 974–986 (2015).
28. Roulois, D. et al. DNA-demethylating agents target colorectal cancer cells by inducing viral mimicry by endogenous transcripts. Cell 162, 961–973 (2015). 29. Topper, M. J. et al. Epigenetic therapy ties MYC depletion to reversing
immune evasion and treating lung cancer. Cell 171, 1284–1300 (2017). e21.
30. Lister, R. et al. Human DNA methylomes at base resolution show widespread
epigenomic differences. Nature 462, 315–322 (2009).
31. Berman, B. P. et al. Regions of focal DNA hypermethylation and long-range hypomethylation in colorectal cancer coincide with nuclear lamina–associated domains. Nat. Genet. 44, 40–46 (2012).
32. Hon, G. C. et al. Global DNA hypomethylation coupled to repressive chromatin domain formation and gene silencing in breast cancer. Genome Res. 22, 246–258 (2012).
33. Hovestadt, V. et al. Decoding the regulatory landscape of medulloblastoma using DNA methylation sequencing. Nature 510, 537–541 (2014). 34. Timp, W. et al. Large hypomethylated blocks as a universal defining epigenetic
alteration in human solid tumors. Genome Med. 6, 61 (2014).
35. Brinkman, A. B. et al. Partially methylated domains are hypervariable in breast cancer and fuel widespread CpG island hypermethylation. Nat. Commun. 10, 1749 (2019).
36. Salhab, A. et al. A comprehensive analysis of 195 DNA methylomes reveals shared and cell-specific features of partially methylated domains. Genome Biol. 19, 150 (2018).
37. Davalos, V. et al. Epigenetic prediction of response to anti-PD-1 treatment in non-small-cell lung cancer: a multicentre, retrospective analysis. Lancet Respir. Med. 6, 771–781 (2018).
38. Costa, G., Barra, V., Lentini, L., Cilluffo, D. & Leonardo, A. Di. DNA demethylation caused by 5-Aza-2’-deoxycytidine induces mitotic alterations and aneuploidy. Oncotarget 7, 3726–3739 (2016).
39. Tsuda, H., Takarabe, T., Kanai, Y., Fukutomi, T. & Hirohashi, S. Correlation of DNA hypomethylation at pericentromeric heterochromatin regions of chromosomes 16 and 1 with histological features and chromosomal
abnormalities of human breast carcinomas. Am. J. Pathol. 161, 859–866
(2002).
40. Wong, N. et al. Hypomethylation of chromosome 1 heterochromatin DNA correlates with q-arm copy gain in human hepatocellular carcinoma. Am. J. Pathol. 159, 465–471 (2001).
41. Qu, G. Z., Grundy, P. E., Narayan, A. & Ehrlich, M. Frequent
hypomethylation in Wilms tumors of pericentromeric DNA in chromosomes 1 and 16. Cancer Genet. Cytogenet. 109, 34–39 (1999).
42. Xu, G.-L. et al. Chromosome instability and immunodeficiency syndrome caused by mutations in a DNA methyltransferase gene. Nature 402, 187–191 (1999).
43. Santaguida, S. et al. Chromosome Mis-segregation generates cell-cycle-arrested cells with complex karyotypes that are eliminated by the immune system. Dev. Cell 41, 638–651 (2017). e5.
44. Goel, S. et al. CDK4/6 inhibition triggers anti-tumour immunity. Nature 548, 471–475 (2017).
45. Deng, J. et al. CDK4/6 inhibition augments antitumor immunity by enhancing T-cell activation. Cancer Disco. 8, 216–233 (2018).
46. Schaer, D. A. et al. The CDK4/6 inhibitor abemaciclib induces a T cell inflamed tumor microenvironment and enhances the efficacy of PD-L1 checkpoint blockade. Cell Rep. 22, 2978–2994 (2018).
47. Chiappinelli, K. B., Zahnow, C. A., Ahuja, N. & Bylin, S. B. Combining epigenetic and immunotherapy to combat cancer. Cancer Res. 76, 1683–1689 (2016).
48. Subramanian, A. et al. Gene set enrichment analysis: a knowledge-based
approach for interpreting genome-wide expression profiles. Proc. Natl Acad.
Sci.USA 102, 15545–15550 (2005).
49. Taylor, A. M. et al. Genomic and functional approaches to understanding
cancer aneuploidy. Cancer Cell 33, 676–689 (2018). e3.
50. Price, M. E. et al. Additional annotation enhances potential for biologically-relevant analysis of the Illumina Infinium HumanMethylation450 BeadChip array. Epigenetics Chromatin 6, 1–15 (2013).
51. Rosenbloom, K. R. et al. The UCSC Genome Browser database: 2015 update. Nucleic Acids Res. 43, D670–D681 (2015).