Measurement of Liquid-Metal Two-Phase Flow with a Dynamic Neutron Radiography
J. E. Cha1, I. C. Lim1, H.R. Kim1, C.M, Kim1, H.Y. Nam1 and Y. Saito2 1
KAERI, 150, DukJin-Dong, Yuseong-Gu, Daejeon, 305-353, Korea, [email protected]
2
Research Reactor Institute, Kyoto Univ., Kumatori, Sennan, Osaka 590-0494, Japan
1. Introduction
The dynamic neutron radiography(DNR) has complementary characteristics to X-ray radiography and is suitable to visualization and measurement of a multi-phase flow research in a metallic duct and liquid metal flow[1,2]. The flow-field information of liquid-metal system is very important for the safety analysis of fast breeder reactor and the design of the spallation target of accelerator driven system. A DNR technique was applied to visualize the flow field in the gas-liquid metal two-phase flow with the HANARO-beam facility. The lead bismuth eutectic and the nitrogen gas were used to construct the two-phase flow field in the natural circulation U-channel. The two-phase flow images in the riser were taken at various combinations of the liquid flow and gas flow with high frame-rate neutron radiography at 1000 fps.
2. Methods and Results
2.1 Experimental apparatus
Figure 1 shows the basic conceptual diagram to measure the liquid-metal two-phase flow with a DNR. The penetrated neutron flux conveys the information of two-phase flow in the test-section, since the incident neutron flux is attenuated when the neutron beam passes through the test section [3].
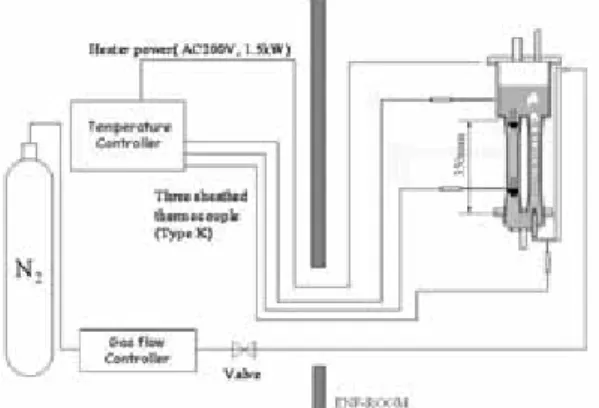
Figure 2 shows the schematic diagram of the experimental apparatus installed in the ENF-room of HANARO reactor in KAERI. The test-section was made of stainless steel SUS316 of 2.5mm thickness (22.2 mm inner diameter, height H-350 mm). A gas nozzle which consists of four holes with 0.8 mm diameter is mounted in the center area of the riser. Three electric heaters were attached to the wall of the test-section. The test-section was insulated with the ceramic wool with 2 inch thickness. The temperature of liquid metal was measured with sheathed K-type thermocouples. To reduce abrupt thermal expansion of the injected gas into the liquid-metal, the gas was electrically preheated in the guided region. Rotor meters and metering valves were used for the airflow rate measurement and control.
2.2 Imaging system
The optical devices used for the radiography are described in Ref. [4]. The HG-LE camera
Figure 1. Basic diagram of the dynamic neutron radiography
Figure 2. Schematics of the experimental apparatus
The test section was located at the position of 2350 mm from the exit of the beam port and the distance between the center of the test section and the converter was 80 mm. A neutron image covers the region of 225 mm to 296 mm from the top of the gas nozzle. For the test position, the neutron flux and L/D ratio are around 2.58 n/cm2 · s and 58, respectively [4]. One pixel represents 0.113 mm in horizontal and vertical directions. The camera frame rate was 1000 fps and the gate time of the image intensifier was 998 µsec. The imaging system was covered with lead blocks and boron sheets to protect from radiation damage before the test.
The local void fraction was calculated by using the Σ-scaling method using the equation (1) [2,3].
⎥ ⎦ ⎤ ⎢ ⎣ ⎡ − − ⎥ ⎦ ⎤ ⎢ ⎣ ⎡ − − = − = 0 0 0 0 ln ln 1 G G G G G G G G G L M L L ML δ δ α (1) ) exp( 1 ) exp( 0 L L L L G L G G G δ δ Σ − − Σ − ⋅ − = (2)
where δL andδML mean the object thickness of liquid and mixture, respectively. GG, GL and GM are the image
Transactions of the Korean Nuclear Society Autumn Meeting Busan, Korea, October 27-28, 2005
gray level of the test section filled with gas, liquid and two-phase mixture, respectively. The offset term G0 in the equation (2) includes the dark current of the imaging system and the gray level due to scattered neutrons.
The void fraction obtained from the equation (1) is the line average void fraction and the area averaged void fraction should be obtained by integrating the line average void fraction weighted with the beam path length.
Table 1. List of optical devices
Converter
Lens
NE426 type
105 mm, Telephotographic lens Nikon Micro Nikkor Image intensifier
HAMMATSU C6598 + booster Relay lens
HAMMATSU A4539
Camera REDLAKE HG-LE
Figure 3. Instantaneous void fraction images with jg
Figure 4. Instantaneous void fraction images (jg = 6.6 cm/s)
2.3 Test results
The experiment was conducted by changing the nitrogen gas velocity over the range from 0 to 11 cm/s liquid metal .
Figure 3 shows several instantaneous processed void fraction images in the riser of the U-channel test-section. The image area is included in the region of z/H=0.6~0.8 along the vertical direction from the top of the gas nozzle. Two-phase image in the riser was analyzed well with the Σ-scaling method. The images were clear enough to discern flow patterns in spite of the metallic duct and opaque fluid. The observed flow patterns from
the test were the bubbly flow, the slug flow. Cap bubbles or elongated slug bubbles are dominant since the liquid metal has large surface tension and excellent heat transfer coefficient. Figure 4 shows the rising velocity of cap bubble in the riser which is similar to the superficial gas velocity.
Figure 5. Area averaged void fraction with jg
In Figure 5, the averaged void fraction was plotted with superficial gas velocity jg. In spite of the flow
pattern, the averaged void fraction is maintained below 0.3 which is within the bubby flow region. For the two-phase modeling such as the drift flux model, it is necessary to know the liquid velocity. The three dimensional measuring techniques should be developed to obtain the velocity information in the downcomer as a long-term research plan.
3. Conclusion
Two phase and single phase images were simultaneously measured in the U-bend liquid metal channel with a dynamic neutron radiography. The high-speed NR images were taken at 1000 fps and the instantaneous processed void images were clear enough to identify the flow patterns in the metallic duct and opaque fluid. Cap bubbles or elongated slug bubbles are dominant since the liquid metal has large surface tension and excellent heat transfer coefficient.
REFERENCES
[1] I.C. Lim, Study on the characterization of the neutron radiography facility in HANARO for two-phase flow research, KAERI Report, KAERI/RR-2094/2001, 2001.
[2] Mishima K., Hibiki T., “Quantitative method to measure void fraction of two-phase flow using electronic imaging with neutrons,” Nuclear Sci. Eng., Vol. 124, pp. 327-338, 1996. [3] Y. Saito, et al., Proc. NURETH-10, Seoul, Korea, 5-9 Oct., 2003.
[4] I.C. Lim, et al., ITMNR-5, Garching, Germany, 26-30 July, 2004.