T. Takeda
Division of Materials Science and Engineering, Graduate School of Engineering, Hokkaido University, Hokkaido 060-8628, Japan R. Kanno
Department of Electronic Chemistry, Interdisciplinary Graduate School of Science and Engineering, Tokyo Institute of Technology, Yokohama 226-8502, Japan
(Received 12 December 2003; revised manuscript received 18 March 2004; published 28 June 2004)
We investigated temperature-dependent infrared-active transverse phonon modes of geometrically frustrated pyrochlore Y2Ru2O7, which exhibits a spin-glass-like transition at TG⬃80 K. According to previous neutron-scattering experiments, although Y2Ru2O7does not accompany any static lattice symmetry change, it has an intriguing magnetic ground state with strong antiferromagnetic correlation[M. Ito et al., J. Phys. Soc. Jpn. 69, 888 (2000)]. In our far-infrared spectra, we found seven phonon modes; thermal effects could explain the temperature dependences of three phonons, but not the other four phonons. We found that these abnormal temperature-dependent behaviors could be attributed to a strong antiferromagnetic correlation, not to a struc-tural distortion. Using quantitative analysis, we suggested that the strong spin-phonon coupling effects should play an important role in the intriguing magnetic state of this geometrically frustrated compound.
DOI: 10.1103/PhysRevB.69.214428 PACS number(s): 78.20.⫺e, 78.30.⫺j
Recently, compounds with pyrochlore and spinel struc-tures have been extensively investigated because of their fas-cinating phenomena related to the geometrical frustration 共GF兲. In these crystal structures, the magnetic ions are lo-cated at vertices of tetrahedra, so the antiferromagnetic共AF兲 interaction will experience a strong GF. Although the GF makes it difficult for the AF ordering to occur, many com-pounds show either AF ordering or signs of strong AF cor-relation in spin-glass ground states.1,2 In spite of the exten-sive work on these compounds, the origin of the AF ordering or the strong AF correlation still remains an open question.
Usually, the AF ordered states and the spin-glass states with strong AF correlation in GF systems accompany static local structural distortions and/or related structural symmetry changes.2–4 Based on these experimental facts, Yamashita and Ueda recently proposed the concept of a spin-driven Jahn-Teller distortion (the so-called spin-Teller distortion). Namely, degeneracy of the spin singlets of a tetrahedron is lifted by a Jahn-Teller mechanism, which leads to a cubic-to-lower-symmetry structural transition.5 They showed that the lattice distortion corresponding to the q = 0 Qv mode is responsible for the magnetic ordering in ZnV2O4. Similarly, Echernyshyov, Moessner, and Sondhi argued that a structural distortion related to the Eu phonon mode should contribute
the Néel states observed in YMn2and MgV2O4compounds.6 At present, many workers consider the spin-Teller mecha-nism to be a prerequisite for the occurrence of the AF order-ing or the strong AF correlations in the GF system.
Cubic pyrochlore ruthenate Y2Ru2O7 can be a quite un-usual compound; although it has a very strong AF correla-tion, it does not have any noticeable structural change.
Simi-lar to the other pyrochlore materials, this compound shows a spin-glass-like transition at TG. Interestingly, TG reaches as
high as ⬃80 K, which is much higher than those of other pyrochlore compounds.7From the neutron-scattering experi-ments, Ito et al. argued that the AF correlation in the spin-glass state should be so strong that the magnetic moments at the Ru sites become aligned to form an almost long-range-ordered state.8In addition, they reported that such magnetic ordering does not accompany any static lattice symmetry change. In these respects, it is quite important to understand the relation between the spin and the lattice degrees of free-dom in Y2Ru2O7.
In this paper, we tried to address this intriguing issue by investigating the temperature共T兲 dependences of the seven infrared- (IR-) active phonon modes. Using quantitative analysis, we could obtain T dependences of phonon frequen-cies, widths, and strengths. As T decreases below TG, we
observed that three phonons exhibit the normal T depen-dences, which could be explained in terms of the thermal lattice expansion effects. On the other hand, we found that the other four phonon modes show abnormal behaviors, which seem to be related to the strong AF correlation below TG. Based on these results, we were able to demonstrate that
the coupling between the spin and the phonon degrees of freedom should be strong and that it should be closely re-lated to the strong short-range ordering nature of the mag-netic moments in this pyrochlore compound.
High-density Y2Ru2O7 polycrystals were synthesized at 3 GPa with a solid-state reaction method.9 Near normal in-cident reflectivity spectra R共兲 were measured in a wide photon energy range from 5 meV to 30 eV. The T-dependent
spectra were measured between 10 K and 300 K. Figure 1 shows the far-IR R共兲 at 10 K and 300 K. At both T, R共兲 show the features due to seven phonon modes. To obtain the optical conductivity spectra˜共兲关=1共兲+i2共兲兴 from the measured R共兲, the Kramers-Kronig analysis has been com-monly used using single-crystal samples. Since the pyro-chlore structure is basically cubic, its optical constants should be isotropic. Thus, even for the polycrystalline samples, the Kramers-Kronig analysis could be applied. De-tails of the experimental process and the Kramers-Kronig analysis are described elsewhere.10
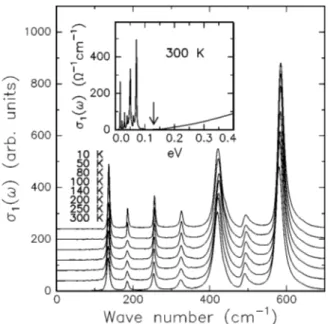
Figure 2 shows the T-dependent far-IR 1共兲 of Y2Ru2O7, where seven IR-active phonon modes can be clearly seen. From a group theoretical analysis, it is well known that the 227 compounds with the Fd3¯m symmetry should have the zone center modes of 8F1u+ 4F2u+ 2F1g + 4F2g+ 3Eu+ Eg+ A1g+ 3A2u.11,12 Among them, only the seven F1umodes are IR-active. Consequently, the number of the observed phonons in the Y2Ru2O7 spectra is in good agreement with the group theoretical analysis. It should be noted that no additional phonon peak appears below TG, in
agreement with the neutron-scattering data indicating no sig-nificant structural change at TG.8
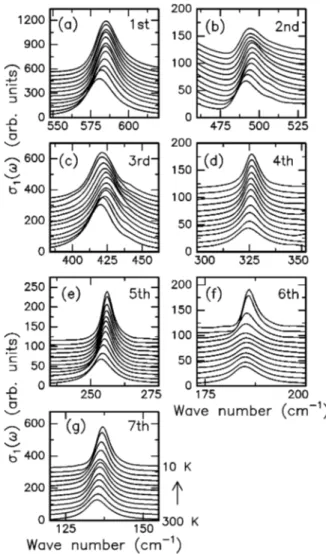
Figure 3 shows the T dependences of the phonon modes, which were numbered sequentially from the high to the low frequencies. For clarity, T-dependent 1共兲 are displayed with upward baseline shifts as T decreases from 300 K to 10 K. With lowering T, the anharmonic thermal motion should decrease, so the lattice constant should also decrease. Then the phonons should shift to higher frequencies and their linewidth should become narrower. The first, fourth, and fifth phonons exhibit the predicted T dependences, as shown in Figs. 3(a), 3(d), and 3(e), respectively. On the other hand, the other phonons exhibit strikingly unusual T dependences. As T decreases below TG, the second and third phonons show
discernible redshifts, as shown in Figs. 3(b) and 3(c), respec-tively. In addition, the sixth and the seventh phonons show
abrupt decreases in their linewidths, as shown in Figs. 3(f) and 3(g), respectively. These anomalous T dependences in-dicate that the structural degrees of freedom should be coupled with the spin degrees of freedom in Y2Ru2O7.
For a more quantitative analysis, we tried to fit the pho-non spectra with a series of Lorentz oscillator functions of the dielectric constants,
⑀ ˜共兲 =⑀⬁+
兺
i Si Ti 2 −2+ i⌫i =⑀⬁+ i4 ˜共兲, 共1兲where ⑀⬁ is the high-frequency dielectric constant, and Si, Ti, and ⌫i represent the strength, the frequency, and the
damping constant of the ith phonon mode, respectively. Table I shows the best-fitting values of Si, Ti, and ⌫i at
300 K. The fitting results for R共兲 at 300 K are shown as the solid dots in Fig. 1, where⑀⬁was adopted as 7.8.
Although the fitting result with the Lorentz oscillators could explain the global behaviors of the phonon spectra reasonably well, there remained some differences between the experimental and the fitted data. For example, Fig. 1(b) shows that there are some deviations in the frequency re-gions between 450 and 500 cm−1 (for the second phonon) and between 600 and 700 cm−1 (for the first phonon). Such discrepancies could be more easily seen in1共兲, shown in Fig. 4.(Similar discrepancies were observed for the sixth and the seventh phonons, but they are rather weak at 300 K.) Note that the first and second phonons have strongly asym-metric line shapes. We could obtain a better fitting when the Fano-type functions, such as A共q+e兲2/共1+e2兲, are used for
1共兲 of the asymmetric phonons.13The solid line in Fig. 4 shows a better agreement with the experimental data. The Fano-type dielectric functions have been used to explain
in-FIG. 1. R共兲 of Y2Ru2O7in the far-infrared region at 10 K and 300 K. Seven phonon modes contribute R共兲. The closed circles
are the fitting results using the parameters listed in Table I. FIG. 2. Temperature-dependent1共兲 of Y2Ru2O7 in the far-infrared region. Seven sharp peaks ascribable to the transverse optical-phonon modes appear. The inset shows1共兲 up to 0.4 eV where the optical gap can be estimated as around 0.14 eV, which is indicated with an arrow.
terference effects between a sharp excitation of a phonon and a broad response.14 Here, e =共−
T兲/⌫, and 1/q is the
strength of the coupling between the phonon and the broad response. The 300 K parameter values from the Fano-type fitting are also shown inside the parentheses in Table I. To
see the T dependence of each phonon more clearly, we evalu-ated⌬Ti=Ti共T兲−Ti共300 K兲, ⌬⌫i=⌫i共T兲−⌫i共300 K兲, and ⌬Si= Si共T兲−Si共300 K兲.15 The first, second, third, and fourth
rows of Fig. 5 show the fitting values of ⌬Ti, ⌬⌫i/⌫i共300 K兲, ⌬Si/ Si共300 K兲, and 1/q, respectively.16
Note that this figure was categorized into three columns, de-pending on the T-dependent behaviors, which were men-tioned above.
The first column of Fig. 5 shows the T dependences of the phonon parameters for the first, fourth, and fifth phonons, which can be explained in terms of thermal effects reason-ably well. Anharmonic interactions of the optical mode with two acoustical phonons of equal energy共=T/ 2兲 can provide T-dependent changes inTand⌫,17
T=T 0+ a
冉
2 eT 0/2k BT− 1 + 1冊
共2兲 and ⌫ = ⌫0+ b冉
2 eT 0/2k BT− 1 + 1冊
, 共3兲whereT0 and ⌫0 are the harmonic frequency of the optical mode and the line broadening due to defect. a and b are the anharmonic coefficients, and 1 /共eT
0/2k
BT− 1兲 corresponds to
the thermal population factor of the acoustic modes. The solid lines in Figs. 5(a) and 5(d) correspond to the theoretical predictions based on Eqs.(2) and (3), respectively, which are in good agreement with the experimental data. Note that these phonon parameters do not show any sudden changes at TG.
The second column shows the T-dependent parameters for the second and the third phonons, which have strong anoma-lies ofT at TG. When T decreases from 300 K,T values move to higher frequencies and their positions can be
ex-FIG. 3. T dependences of each phonon mode. The figures from
(a) to (g) are for the phonons from the first to the seventh in order.
In each figure, the spectra from top to bottom are shown for tem-peratures of 10, 40, 60, 70, 80, 90, 100, 120, 160, 200, 250, and 300 K.
TABLE I. Values of Lorentz oscillator fitting parameters for the seven IR-active phonon modes at 300 K of Y2Ru2O7. The values in the parentheses are fitting parameters for the Fano-type function.
Ti共cm−1兲 ⌫i共cm−1兲 Si共⍀−1cm−1cm−1兲 i = 1(1st) 581.0(580.0) 21.0(21.0) 10 150(4.65) i = 2(2nd) 492.0(488.5) 20.0(19.0) 1106(6.4) i = 3(3rd) 420.0 23.5 7151 i = 4(4th) 324.0 12.0 549 i = 5(5th) 253.5 11.0 729 i = 6(6th) 184.7(184.8) 8.4(8.6) 307(0.08) i = 7(7th) 135.0(135.4) 8.0(7.6) 1020(0.20)
FIG. 4. Fitting results for1共兲 at 300 K. The dotted line sup-poses the Lorentz oscillators for all phonon modes, and the solid line supposes the Fano-type functions for the first and second pho-non modes instead of the Lorentz oscillators. All of the parameters used are listed in Table I.
plained in terms of Eq.(2), as shown with the solid lines in Fig. 5(b). However, below TG, T values start to deviate
from the solid lines and show rather strong redshifts. Con-sidering the fact that there is no structural change in Y2Ru2O7 at TG, these anomalies in T should be related to the strong AF fluctuations in the spin-glass state.
The third column shows the T-dependent parameters for the sixth and the seventh phonons, which have strong anomalies of⌬⌫ and 1/q at TG. As shown in Fig. 5(f), values
of⌬⌫/⌫共300 K兲 start to show large decreases at TG. And, as
shown in Fig. 5(l), values of 1/q become larger, indicating that the couplings between the phonons and the broad re-sponse should become stronger. In addition, T dependences of theirT, shown in Fig. 5(c), cannot be simply explained in terms of Eq.(2). Note that these phonons have rather strong asymmetric Fano-type line shapes, indicating that the phonons should be coupled with a broad continuum state, which might be attributed to either electronic or magnetic origins. Note that Y2Ru2O7 is a Mott insulator,18 and that there are no electronic continuum states in the phonon spec-tral region, as shown in the inset of Fig. 2. Therefore, the continuum background might be due to a broad density of states for spin waves, and the strong anomalies related to these phonons could come from rather strong spin-phonon couplings.
The strong spin-phonon coupling could result in a shift of the phonon frequency. Let us consider that the exchange
in-teractions between the magnetic atoms become the strongest for those located at the nearest-neighboring sites. For a dis-placement by x from the equilibrium position, the crystal potential U can be given by U =12kx2+兺i,jJij共x兲具SiSj典. The
second term appears, since the exchange energy constant Jij is a function of the structural parameters, such as the lengths between the magnetic ions and the corresponding angles me-diated by the O ions. Its second derivative, 2U /x2⬇k +兺i,j共2J
ij/x2兲具SiSj典, gives the harmonic force constant.
Note that the second term represents the spin-phonon cou-pling, which suggests that the phonon frequency should have an additional contribution 具SiSj典.19 Here, 具SiSj典 denotes a
statistical mechanical average for the adjacent spins, and is the spin-phonon coupling coefficient which can be different for each phonon and can have either a positive or a negative sign. Note that the T-dependent value of具SiSj典 can be
evalu-ated from the integrevalu-ated intensities of the neutron-scattering peaks of magnetic origin.8 By fitting with the deviation of
T2 and T3 from the prediction of Eq. (2) as 具SiSj典, we
found that the deviation could be explained quite well by the spin-phonon coupling term. We could also estimate that val-ues of for the second and the third phonons are about 6 and 9 cm−1, respectively. The magnitudes of these values are intermediate, compared to兩兩⬃1 cm−1for FeF2and MnF2,20 and兩兩⬃50 cm−1for CuO.21
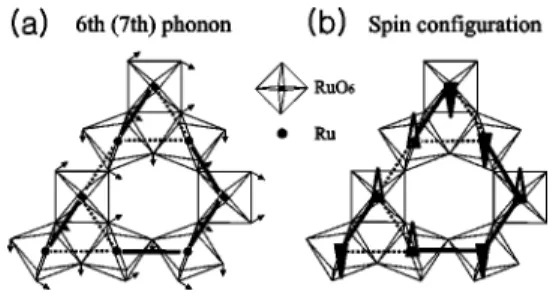
How can we understand the anomalies of⌬⌫ and 1/q for the sixth and the seventh phonons? Figure 6(a) shows the displacement of the oxygen ions for one of these low-frequency phonon modes.12Note that the exchange energy is very sensitive to the Ru-O-Ru angles for the superex-change interaction; while the 180° superexsuperex-change gives a negative共AF兲 J, the 90° superexchange provides a positive J. Note that the value without the lattice displacement,0, is about 129°.9Under the lattice displacement, some of the Ru-O-Ru angles become larger than 0, and the others be-come smaller than0. In Fig. 6(a), the Ru pairs with⬎0 and those with⬍0are indicated by the solid and the dot-ted lines, respectively. With the lattice displacement, the AF interaction between the Ru pairs connected by the solid line should increase, and vice versa. Based on these changes, we could figure out a favorable spin configuration, which is dis-played in Fig. 6(b). Actually, this spin configuration, ob-tained from a simple argument based on the superexchange changes, is similar to the spin-configuration obtained from theoretical calculations,6 which assumed an E
u phonon-FIG. 5. The T-dependent parametersT,⌫, S, and 1/q. These
are categorized into three columns, i.e., the first column for the first, fourth, and fifth phonons, the second column for the second and third phonons, and the third column for the sixth and seventh phonons, respectively. The solid lines in (a), (b), and (d) are the theoretical predictions assuming only the thermal effects. Details of each figure are described in the text.
FIG. 6. (a) Atomic displacements of the sixth (seventh) phonon modes(Ref. 12). The thick bold and dotted lines connect the Ru ions with⬎0and⬍0, respectively.(b) Possible spin configu-ration related to such atomic displacements.
provide a possible explanation for changes in phonon dy-namics due to the spin ordering. The nearly long-range AF ordering in Y2Ru2O7 could increase the coupling between the phonon and the corresponding spin wave, resulting in the increase in 1 / q. Also, the abrupt decrease of ⌫ might be attributed to the reduction of the phonon decaying paths due to the occurrence of the nearly long-range magnetic ordering.19
As we mentioned in the Introduction, Y2Ru2O7 is a unique compound since it shows a very strong AF correla-tion without any noticeable structural distorcorrela-tion. Our infrared studies show that such an intriguing phenomenon should be closely related to the large spin-phonon coupling effect. Al-though the local structural disorder and/or the chemical dis-order could drive short-range magnetic dis-ordering, such possi-bilities can be excluded in the Y2Ru2O7 case for the following reasons. First, if there are local structural disorders below TG, the phonon linewidth should be broadened
accord-ingly. However, we found no phonon peak exhibiting the predicted linewidth broadening below TG, indicating that the
local structural disorder could not play an important role.
and phonon degrees of freedom could be the most plausible origin to explain the strong AF correlation in this pyrochlore ruthenate. In order to get a more thorough understanding of the magnetic state of Y2Ru2O7, further studies, including ex-act assignment of all of the phonon modes and a detailed understanding of the spin-phonon coupling mechanism, are seriously desirable.
In summary, we investigated the temperature-dependent behaviors of the transverse optical-phonon modes of Y2Ru2O7. Through quantitative analysis, we observed strong signatures suggesting that the structural degrees of freedom are strongly coupled with the spin degrees of freedom. We proposed that the strong spin-phonon coupling effects should be closely related to the strongly AF correlation(but just a little short of forming an ordered state) observed in this geo-metrically frustrated system.
We would like to thank Jaejun Yu for helpful discussion. This work was supported by the Ministry of Science and Technology through the Creative Research Initiative pro-gram. The experiments at PLS were supported by MOST and POSCO.
1J. S. Gardner, B. D. Gaulin, S.-H. Lee, C. Broholm, N. P. Raju, and J. E. Greedan, Phys. Rev. Lett. 83, 211(1999).
2H. Mamiya, M. Onoda, T. Furubayashi, J. Tang, and I. Nakatani, J. Appl. Phys. 81, 5289(1997).
3A. Karen and J. S. Gardner, Phys. Rev. Lett. 87, 177201(2001); C. H. Booth, J. S. Gardner, G. H. Kwei, R. H. Heffner, F. Bridges, and M. A. Subramanian, Phys. Rev. B 62, R755
(2000).
4Y. Ueda, N. Fujiwara, and H. Yasuoka, J. Phys. Soc. Jpn. 66, 778
(1997).
5Y. Yamashita and K. Ueda, Phys. Rev. Lett. 85, 4960(2000). 6 O. Tchernyshyov, R. Moessner, and S. L. Sondhi, Phys. Rev.
Lett. 88, 067203(2002); Phys. Rev. B 66, 064403 (2002). 7S. Yoshii and M. Sato, J. Phys. Soc. Jpn. 68, 3034(1999). 8M. Ito, Y. Yasui, M. Kanada, H. Harashina, S. Yoshii, K. Murata,
M. Sato, H. Okumura, and K. Kakurai, J. Phys. Soc. Jpn. 69, 888(2000).
9R. Kanno, Y. Takeda, T. Yamamoto, Y. Kawamoto, and O. Yama-moto, J. Solid State Chem. 102, 106(1993).
10H. J. Lee, J. H. Jung, Y. S. Lee, J. S. Ahn, T. W. Noh, K. H. Kim, and S.-W. Cheong, Phys. Rev. B 60, 5251(1999).
11E. Buixaderas, S. Kamba, J. Petzelt, M. Savinov, and N. N. Kol-pakova, Eur. Phys. J. B 19, 9(2001).
12N. T. Vandenborre, E. Husson, and H. Brusset, Spectrochim. Acta, Part A 37, 113(1981).
13U. Fano, Phys. Rev. 124, 1866(1961).
14A. B. Kuz’menko, D. van der Marel, P. J. M. van Bentum, E. A. Tishchenko, C. Presura, and A. A. Bush, Phys. Rev. B 63, 094303(2001).
15Compared to the Lorentz oscillator, the Fano-type function has an additional parameter q. The parameter S has a different meaning from that for the Lorentz oscillator, and it is not directly related to the strength of the peak.
16We have observed similar results for the Raman-active phonon modes, which will be reported elsewhere.
17J. Menendez and M. Cardona, Phys. Rev. B 29, 2051(1984), and references therein.
18J. S. Lee, Y. S. Lee, T. W. Noh, K. Char, Jonghyurk Park, S.-J. Oh, J.-H. Park, C. B. Eom, T. Takeda, and R. Kanno, Phys. Rev. B 64, 245107(2001).
19K. Wakamura, Solid State Commun. 71, 1033(1989).
20D. J. Lockwood, R. S. Katiyar, and V. C. Y. So, Phys. Rev. B 28, 1983(1983); D. J. Lockwood and M. G. Cottam, J. Appl. Phys.
64, 5876(1988).
21X. K. Chen, J. C. Irwin, and J. P. Franck, Phys. Rev. B 52, R13 130(1995).
22S. Naler, M. Rübhausen, S. Yoon, S. L. Cooper, K. H. Kim, and S. W. Cheong, Phys. Rev. B 65, 092401(2002).
23N. Taira, M. Wakeshima, and Y. Hinatsu, J. Mater. Chem. 12, 1475(2002).